Between 1950 and present day many demographic changes occurred due to urban developments in the Kansas City area. Adjustments made to the city are directly reflected in the changes that appear in the annual census reports. Crowded cities were extremely common in the 1950s and the earliest census tracts records held very high population density levels. Due to laws held in certain neighborhoods people other than whites were restricted from residing there which heavily swayed the demographics. Due to suburban developments the number of houses in urban areas took a major decrease and it was evident in the census reports.
Monthly Archives: November 2017
Troost Avenue and 34th through 37th street
Kansas City is the heart of America. Troost Avenue runs north-south, cutting the city in half while also serving as a racial dividing line. I am analyzing the development over time of Troost avenue, focused specifically on 34th through 37th street. The time periods examined for this project are three years in specific, 1950, 2000, and 2010. The 3 levels that these dates were each examined by were the Census Tract, Kansas City level, and for 2010 only, the Metropolitan Statistical Area. For each year at each level, the general population info, demographics, and housing info were examined. The census tracts that corresponded to my designated area, were tracts 50 through 53. From 1950 to 2000, and from 2000 to 2010, the total population in each of the tracts decreased tremendously. The total population for the year 1950 had the largest total population out of all three years that were examined. In terms of the number of housing units, as a whole we see a decrease of units from 1950 to 2000, and 2000 to 2010. The only exception to this would be tract #51 from the year 1950 to 2000, for the number of housing units in this tract actually increased from 964 to 1,123 units.
https://docs.google.com/spreadsheets/d/1HG6fS-u_X5ltYrMlVpOjR2JzlGKARBcON2qNlL0GYw4/edit#gid=0
Troost Avenue
The area east and west of Troost Avenue between 78th St. and 82nd Terrace has changed drastically from 1950-2010. This part of the land is divided into three census tracts, 90, 94, and 95. In 1950, all three census tract areas were predominately white, wealthy, homeowners. In 2000 and 2010, that had changed drastically to predominately black, lower-income, renters. The most noticeable change was the census tract north of 79th St. It had the sharpest drop in white population, while the area south of 79th St. was much less significant, retaining most of the white population.
Demographics of Troost Avenue 55th St to 58th St
The two census tracts (81 and 82) illustrates well the shift from what was previously a wealthier, homogenous outer section of the city into a more divided and generally poorer area. In 1950 the two tracts were each more than 99% white, but now west of Troost is just barely 80% white, and east of Troost is almost 88% black. High school graduate rates have gone up in both tracts, but west of Troost has a much higher rate of higher education.
A nasty correlation to the demographic shift is that the west side has twice the median house value and almost twice the median income. This trend illustrates the great power of Troost as a dividing line and the implications of living just a block over.
Census Data of Troost Ave. 10th-13th Street
The 1950’s was the prime time for Troost Avenue, but it has only seemed to decline over time. Data was collected from the Social Explorer website and was pulled from census tracts on Troost Avenue, between 10th and 13th street, Kansas City, Missouri, and the Metropolitan Statistical Area (MSA). Since the 1950s, majority of the population in Kansas City, the metro area, and the west side of Troost has remained white, but the east side of Troost Avenue has steadily continued to grow in its black population. In 2000, over 92% of the population on the east side of Troost Avenue was documented as black. On the other hand, only 12.5% of the population of the metro area appears to be of the black population. The data collected express that majority of the metro area population is of the white population and the small amount that is of the black population is settled to the east side of town. Over the last 60 years, Kansas City appears to have become more diverse. Kansas City, Missouri has gone from over 87% of a white population down to 59.2% and has over 10% of a population that defines themselves as other.
Columbus Park Education vs. Income
The area I researched was 4th through Independence Ave. It involved only one Census Tract (lucky I know). It seemingly followed most of the same trends the other areas had. I adjusted the Median income for inflation and compared the Tract level to the KCMO median income. Further, I compared the education rate from the Tract level to the KCMO.
In summary, as time went on the education rate of Tract 3 ROSE higher and closer to match that of the city level, while the income rate compared to the city DROPPED significantly. Wow. What’s wrong with this picture?

Census Data Analysis – 18th Street to 22nd Street
The Kansas City Metro area has had periods of growth and decline like any other city. These changes are apparent in the city census data and in census tracts. This paper will analyze those changes in the Greater Kansas City area, Kansas City, MO, and an emphasis on Troost Avenue from 18th Street to 22nd Street. The main focus will be between the census tracts, one on the West side of Troost and the other on the East side. The race, median income, and median age are all very important categories that help shape our understanding of what has happened on Troost over time.
Volker to Brush Creek
Exploring this part of the city and its physical environment over time through maps and on foot left me wondering about the citizens and their living conditions. Through census analysis this picture became slightly clearer. However, the optimism I felt after the previous historical analysis quickly came to an end while I poured over the numbers that shined a light on how truly divisive this street has always been. During the 50’s the prosperity and education were equal on both sides only to a population that was nearly 100% white. By 2000 the line was drawn and while the West side continued to flourish the East continued to decline.
After finishing the project my feelings on investing in public education became even more strong
Census Analysis Report : 1950, 2000, 2010 (Troost Ave. Brush Creek to 43rd St.)
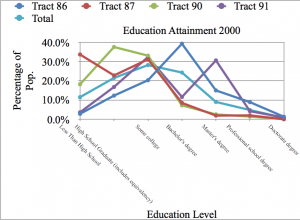
My research was over census analysis in 1950, 2000 and 2010. During the time of 1950 from Brush Creek to 43rd St were dominantly occupied by white alone only about one percent occupied by African-American. But the educational attainment were very surprising for example the most population were people with high school education level. But after 50 years everything were changing. The race distribution in the year 2000 were somehow very diverse. The African-American population increased dramatically and many other race emerged. Educational Attainment in 2000 were better and many people had some college level and also high school graduates. Renter in the Housing unit also increased. In 2010 the environment even became diverse and the percentage kept on increasing. The educational Attainment gradually increased such as people with bachelor, master, doctorate and professional degree, Renter in that area increased rapidly but not owner occupiers.

Census Report: Troost Ave. 25th Street- 27th Street
Troost Avenue is a main artery that runs north to south through Kansas City, Missouri and though it appears to only be a road it is also representing a defined dividing line of people in the city. Through the use of census data from the years 1950, 2000, and 2010 a comparison of the census tracts 41, 42, 43, and 162 will show the differences and similarities of people on both sides of Troost Ave. from 25th street to 27th street and why a new tract arose after 2000.
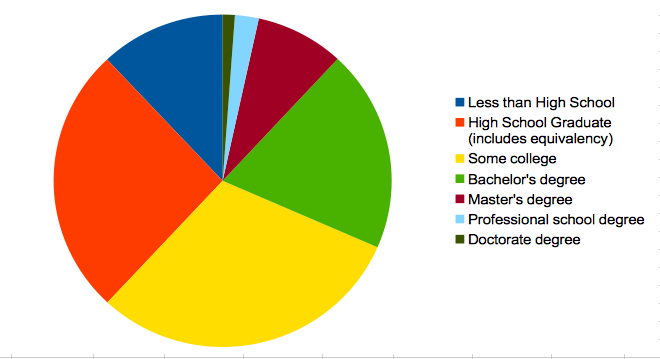
Education Among Predominately Black Community Lags Behind
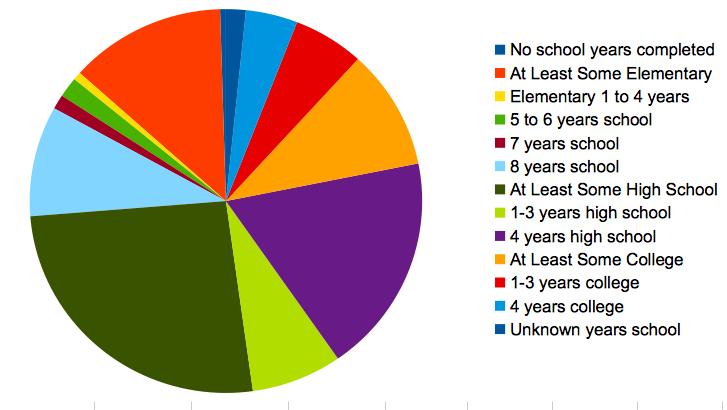
Poverty and education are incredibly linked to one and other. One can directly determine the other in most cases. In the Graph, it shows the educational attainment for 4 blocks along Troost, tracts 86 and 91 on one side and 87 and 90 on the other. From this figure, we see that on the side with 86 and 91 have a high educational attainment, with the majority having at least a bachelors degree or masters. The other two show a very different story, with the majority having a high school diploma, if that. It is not surprising that the less educated side is the side that almost half the population is impoverished. It is also not surprising that this side is 88% African American. This is yet another ripple in a long history of social injustice and is a huge indicator of the negative feedback loop which is this community.
Census Data Analysis: 31st to 34th and Troost
My report examined the four blocks on Troost that included 31st to 34th street, there is Linwood Boulevard as well. Up until 1953, the area was along a major streetcar line. One conclusion I made in the report had to do with the difference between the census tract on the west side of troost and the census tract on the east side of troost, in regard to number of housing units. In 2010, the western tract had 2,402 total housing units in comparison to the eastern tract’s 677 total housing units. I concluded that this was due to a distinction of blight and high rates of vacancy. So most of the housing units that the east side did have, have been demolished, instead of renovation or any other alternative in an attempt to save already low housing values in the area.
77th and Troost
My Troost
Chainy J. Folsom
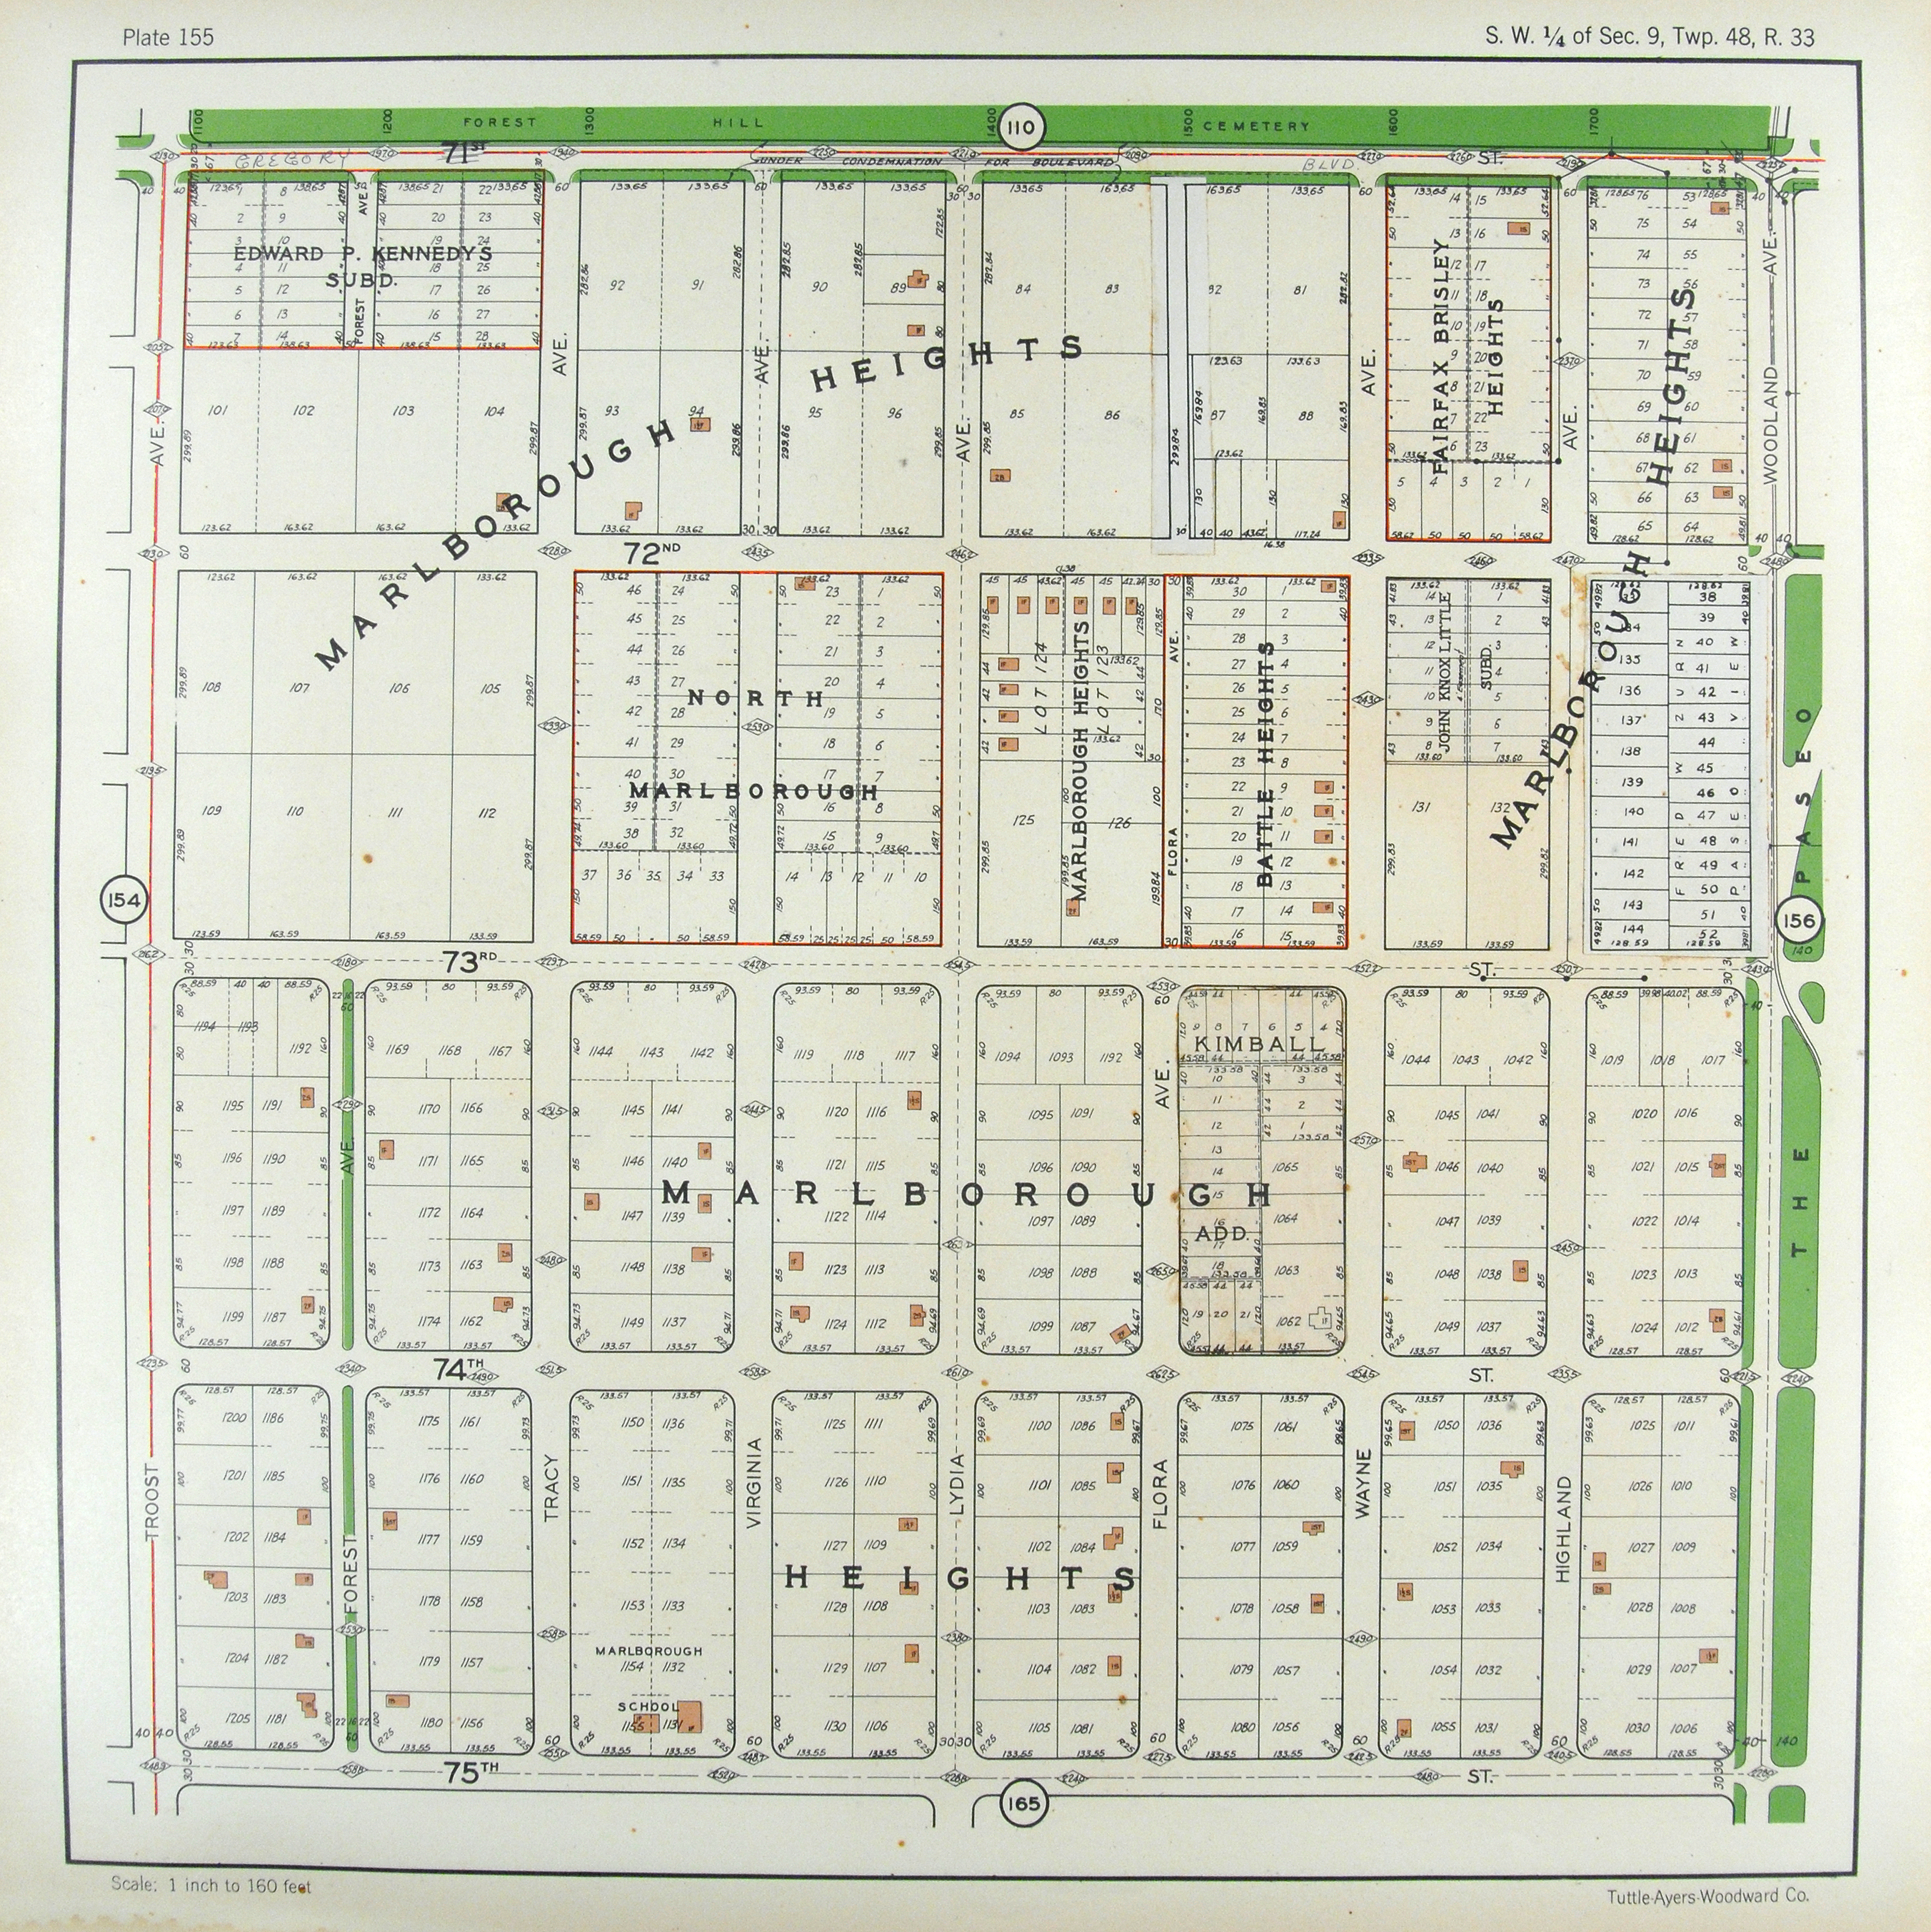
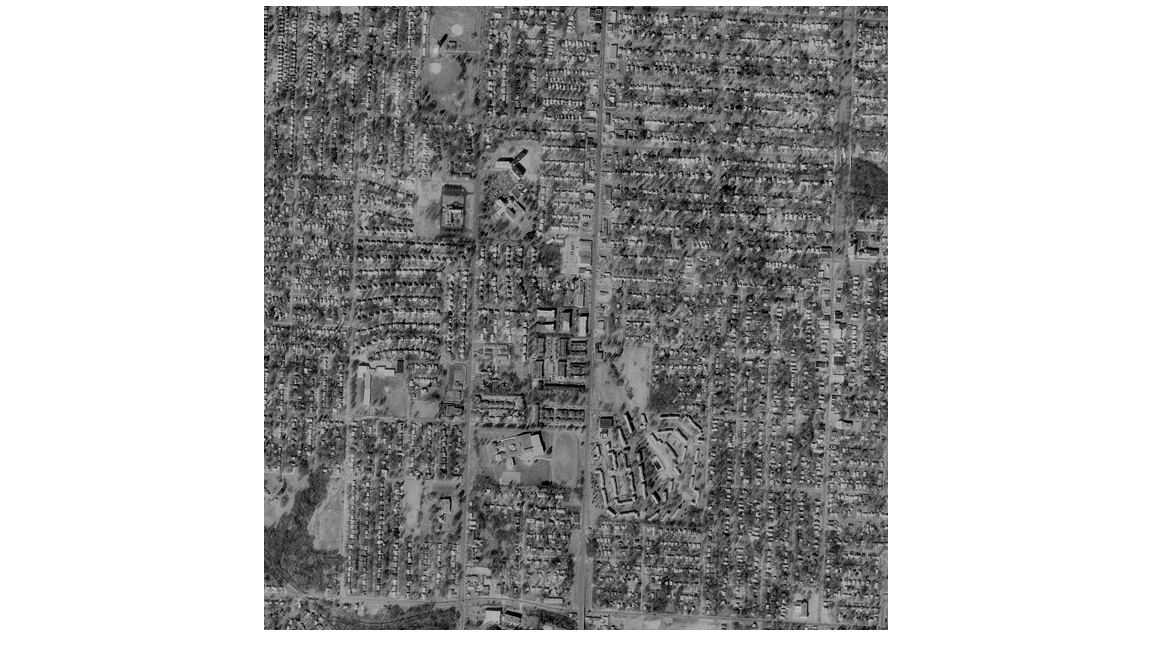
For my post I selected several geographic images of the 77th and Troost area.
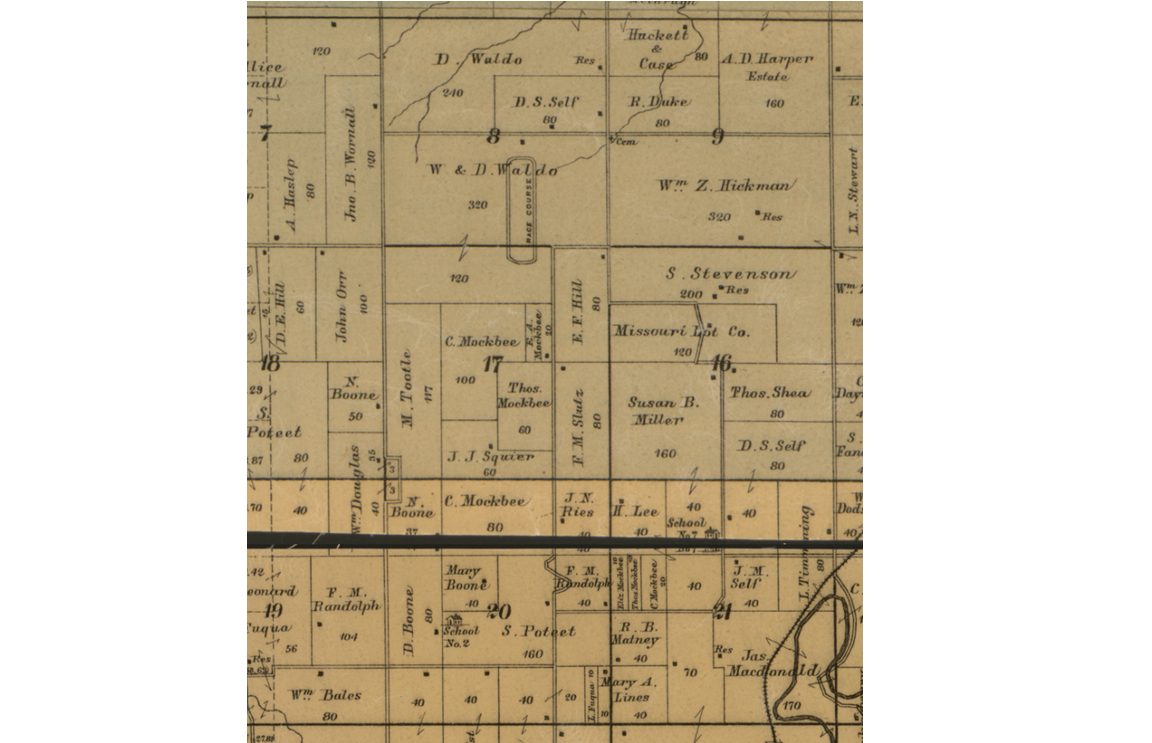
Edward’s Map for Jackson County Missouri, 1887.
It is possible to make out the owners’ names within the lots. Note several names prominent in the Kansas City development history; Waldo, Wornall, Boone, and Hickman. Find the Thos. Mockbee 60 acre lot at the lower center.
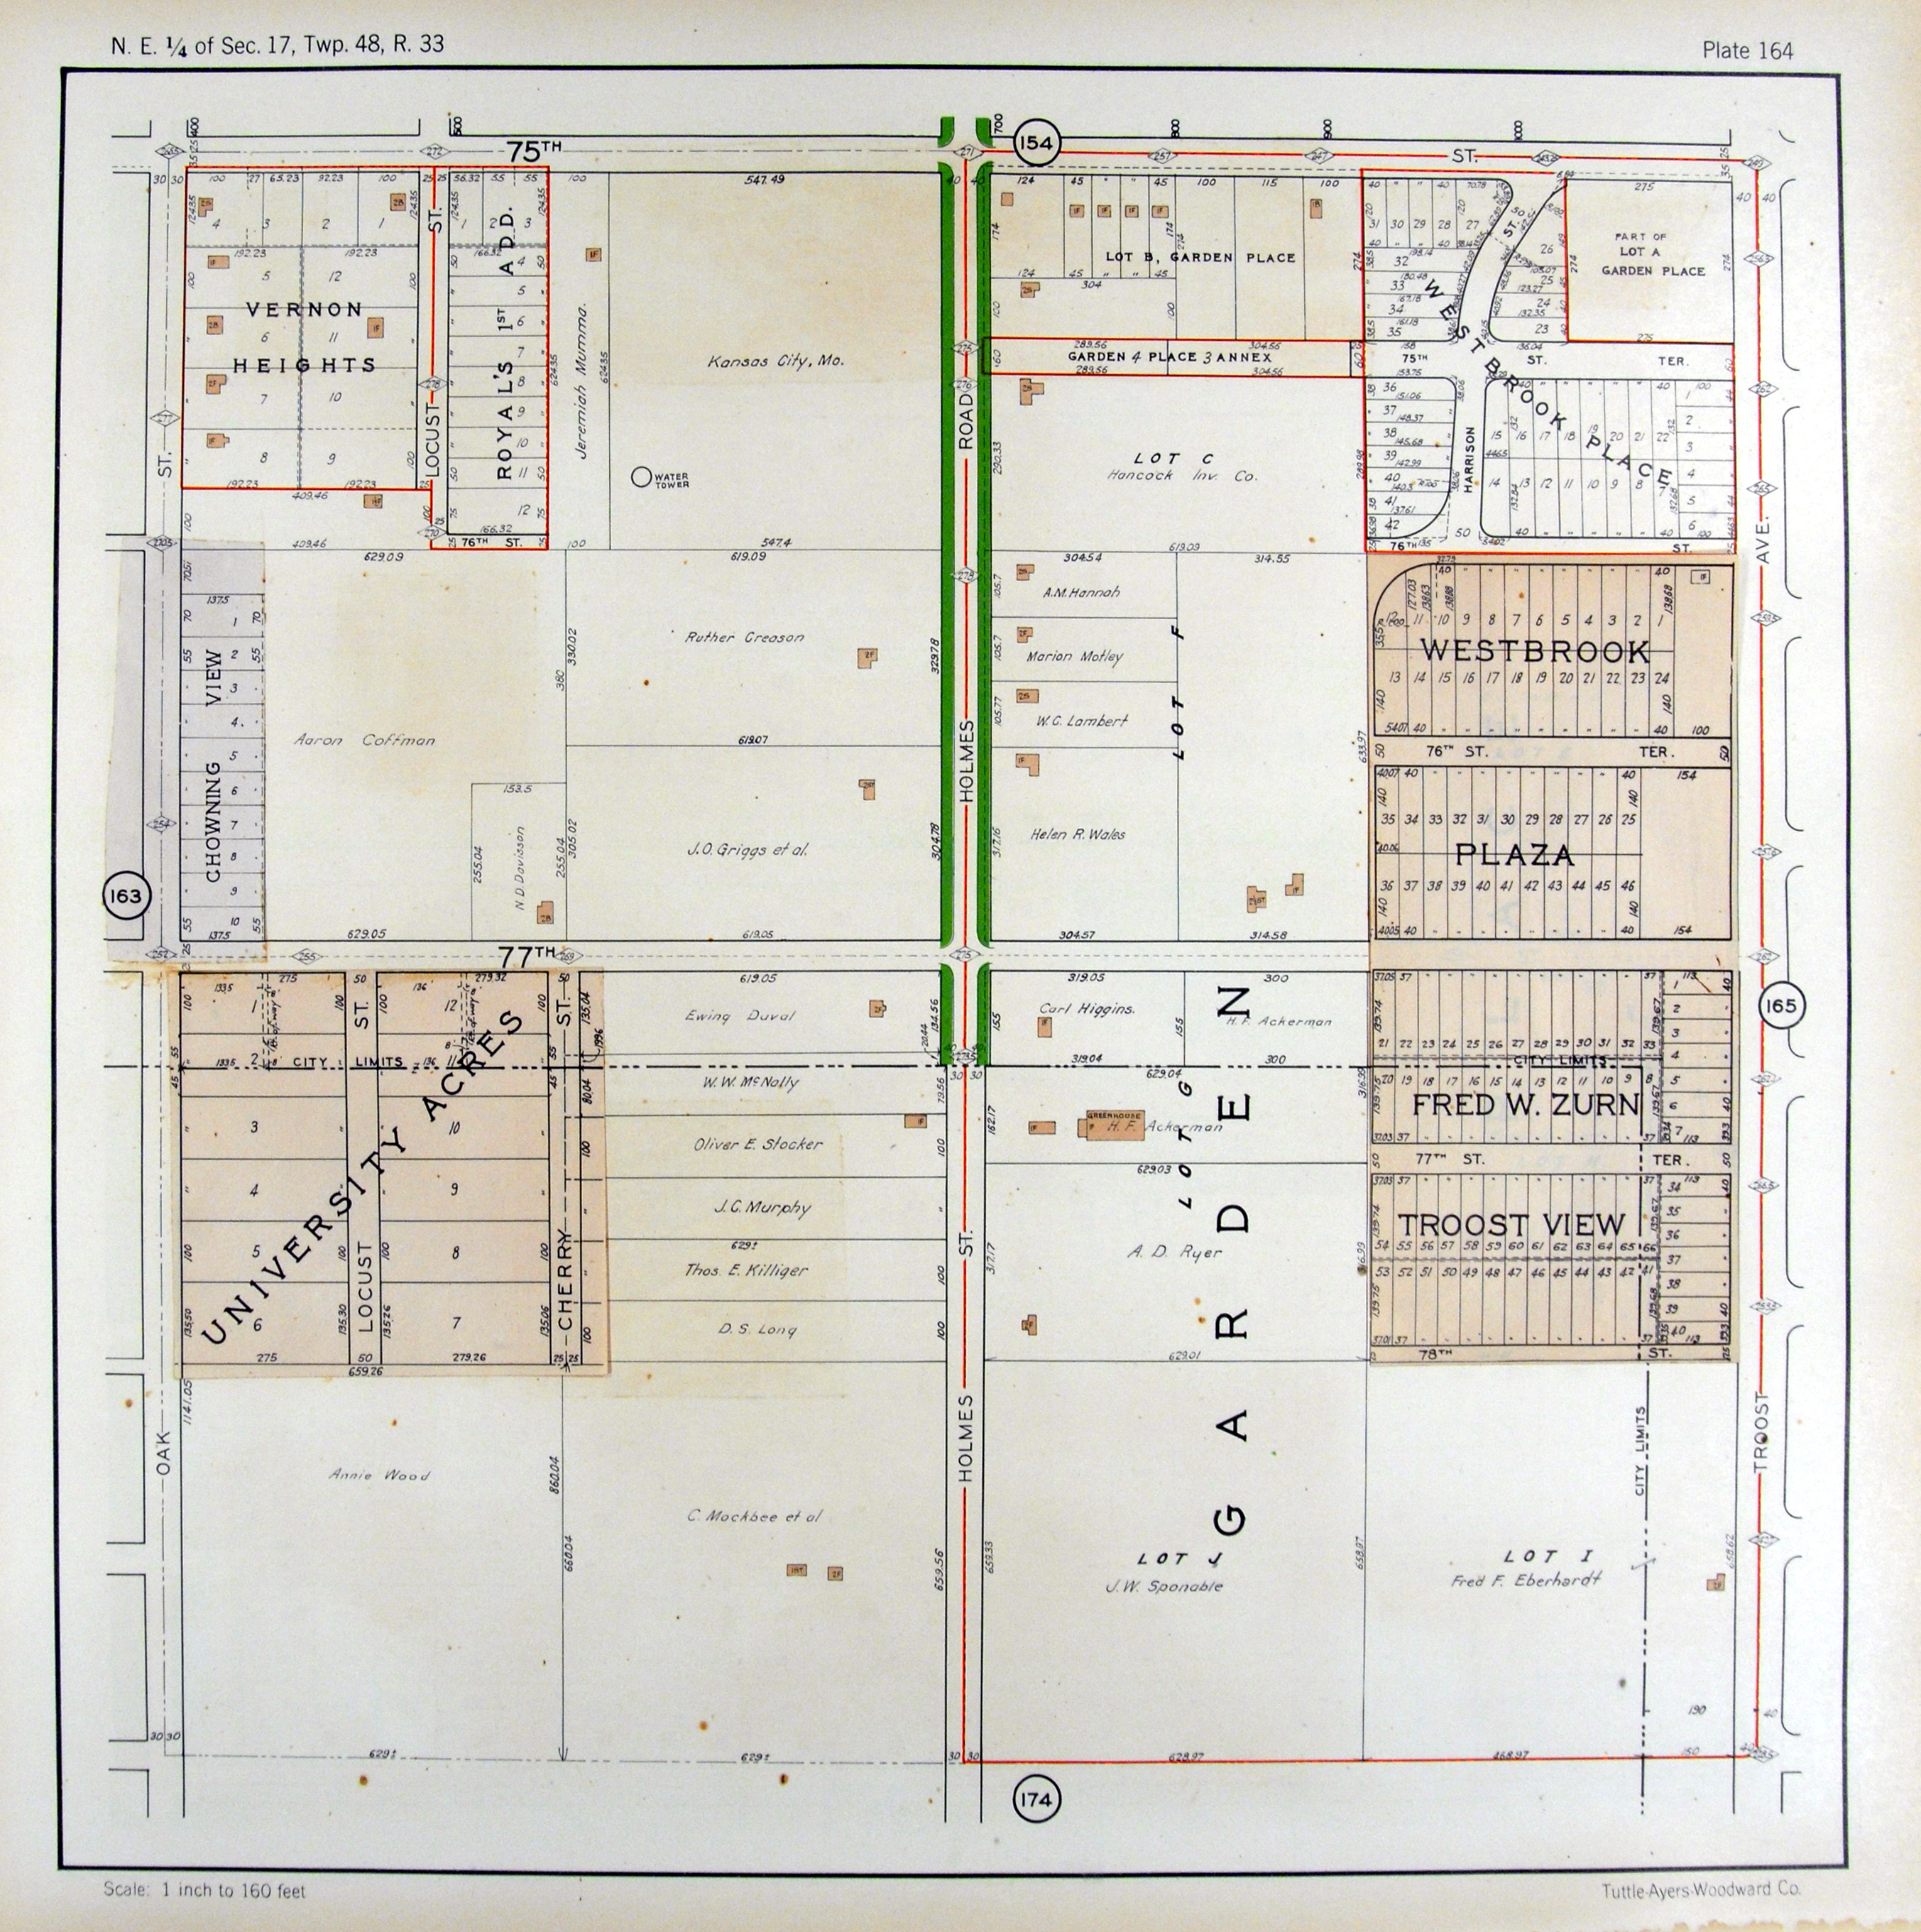
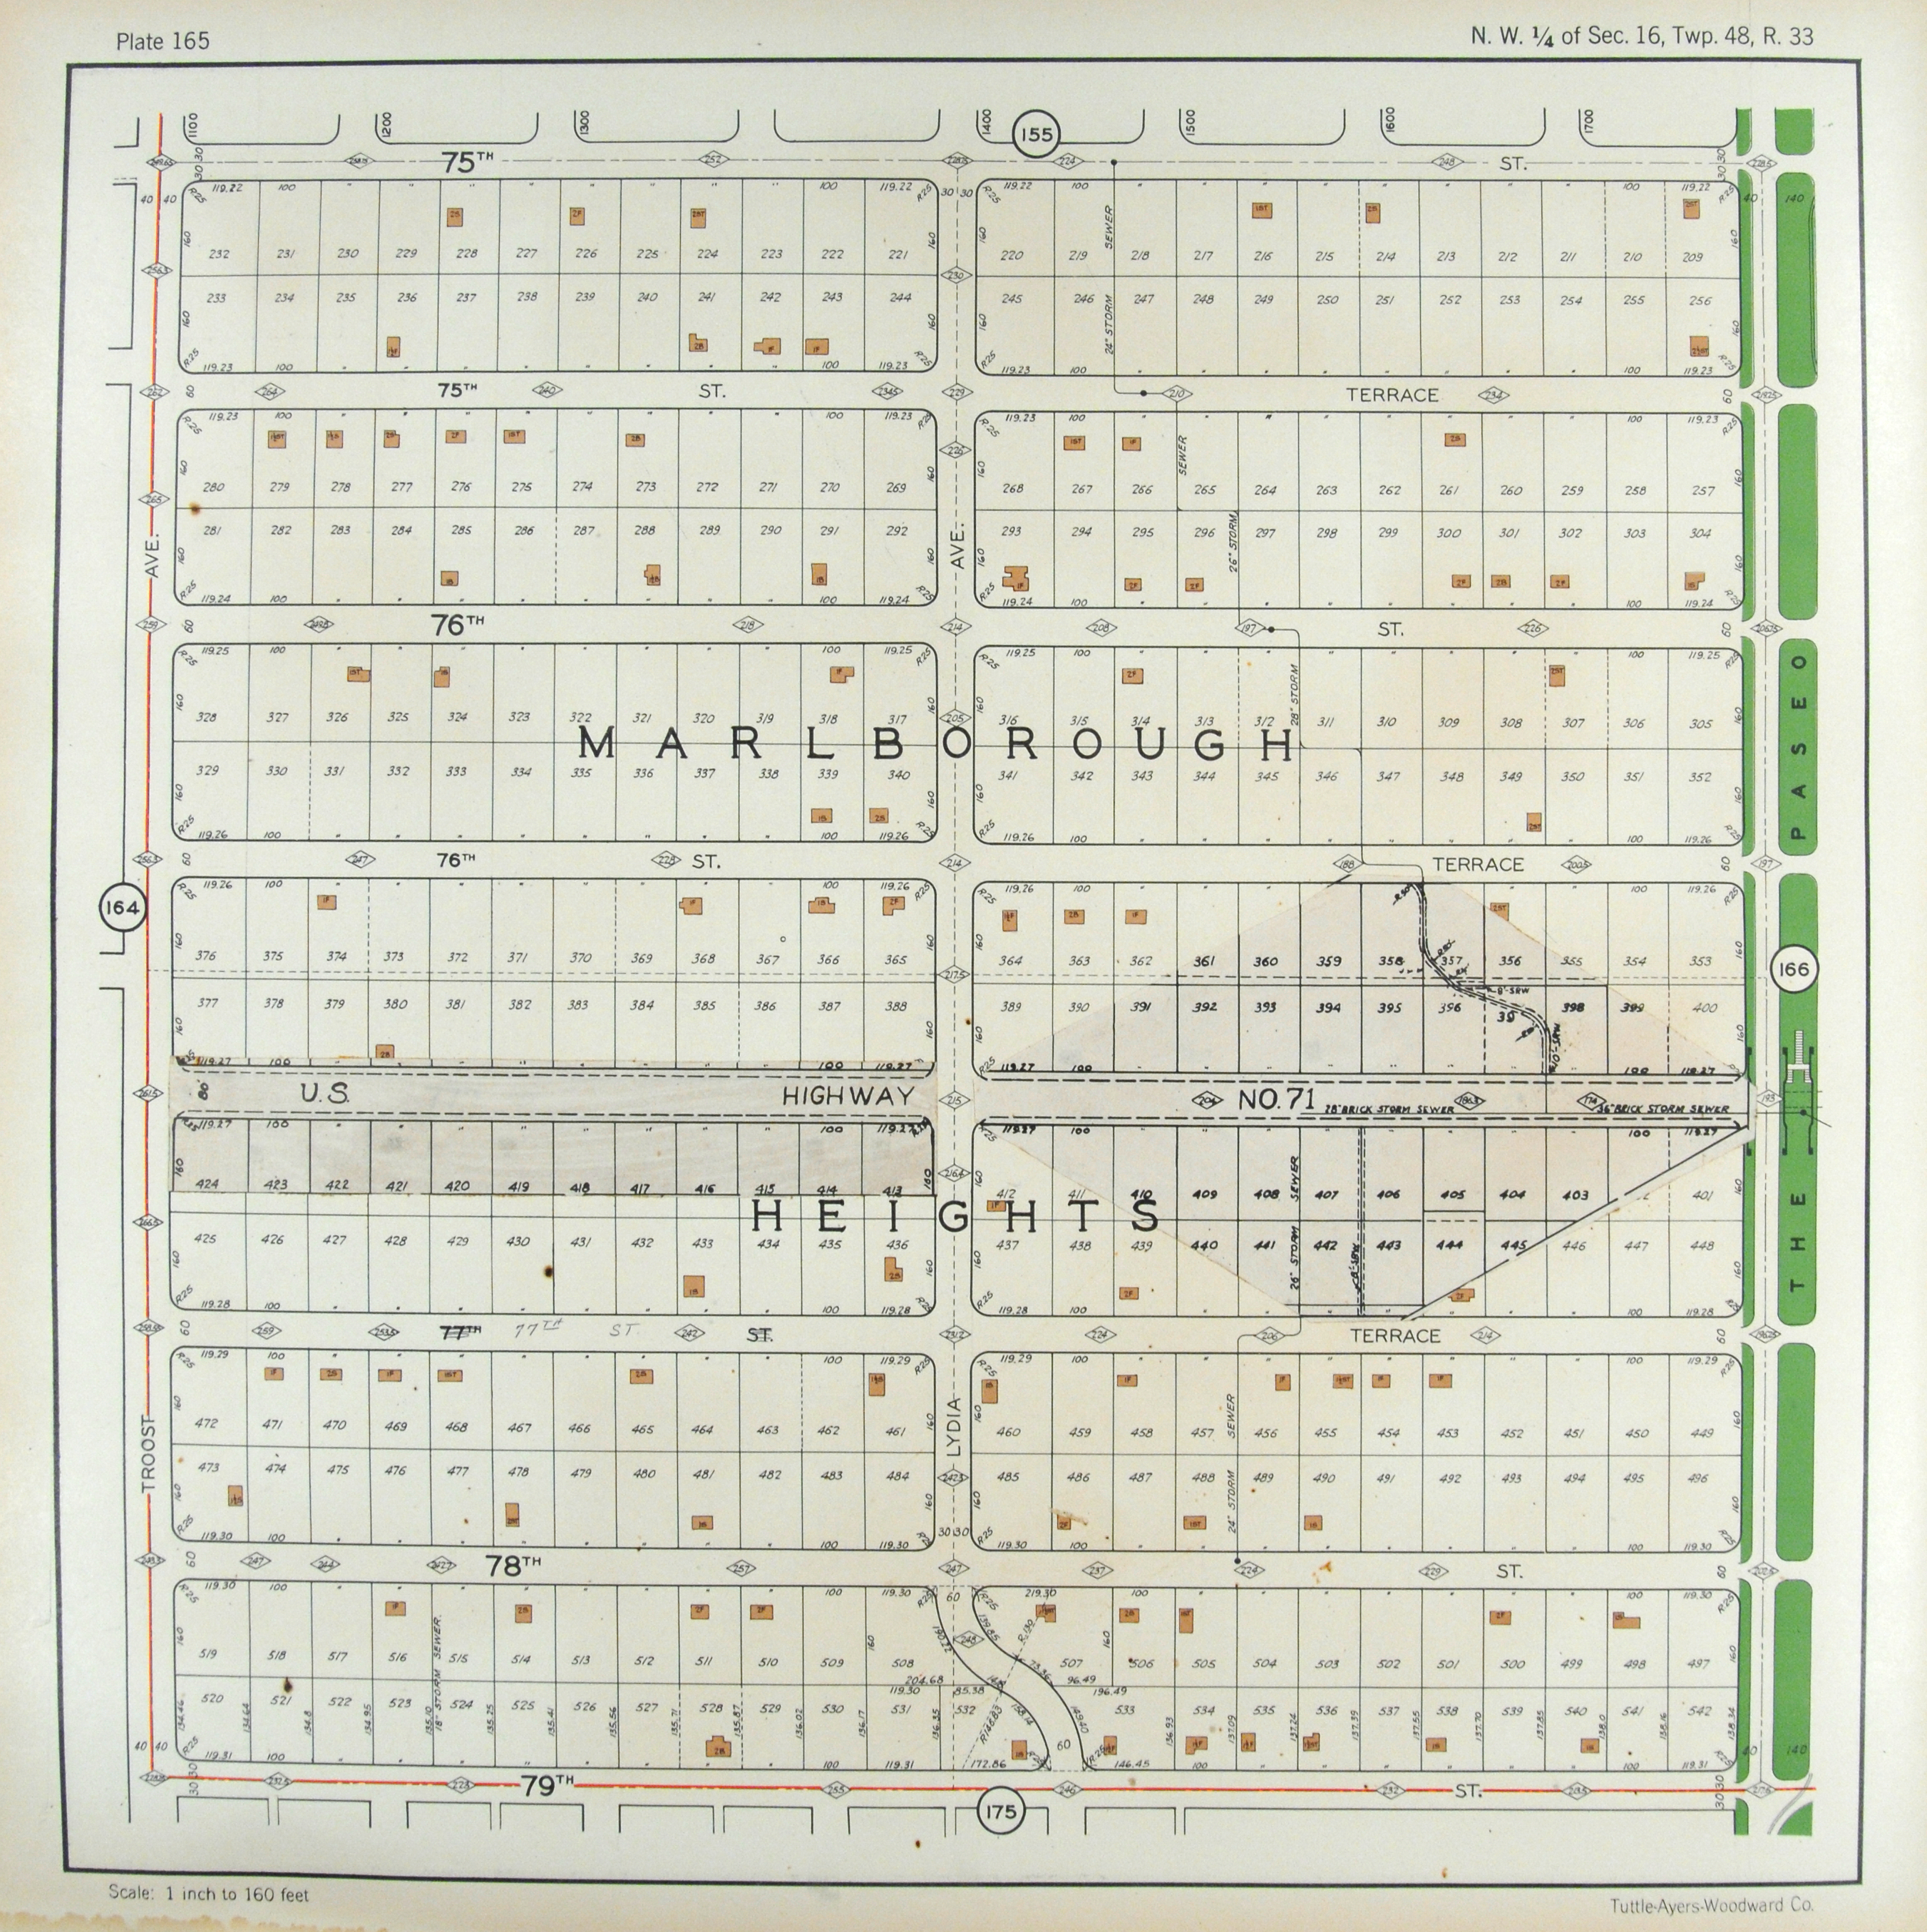

The area as represented in the 1925 Atlas of Kansas City. Thos. Mockbee’s lot is in the lower left map. The lot has been subdivided into 40 acre and 20 acre lots.
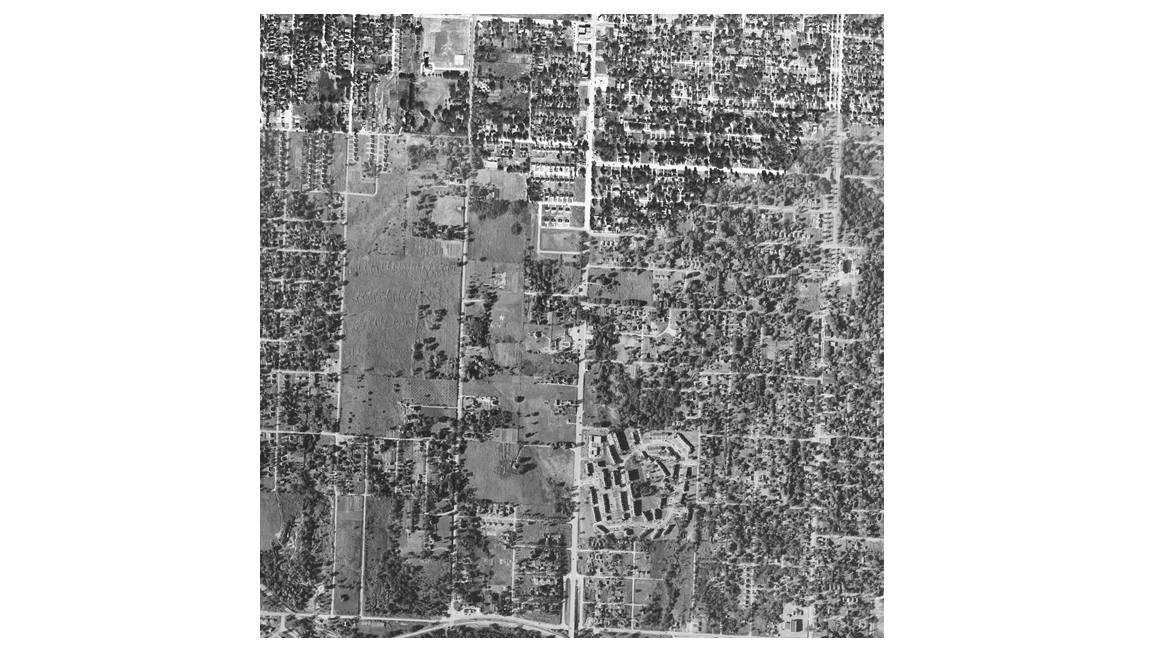
1948 USGS (1948-08-24 – 1948-10-19)
1996 USGS DOQQ (1996-02-10 – 1996-07-18)
 2012 USDA (2012-06-05 – 2012-06-29)
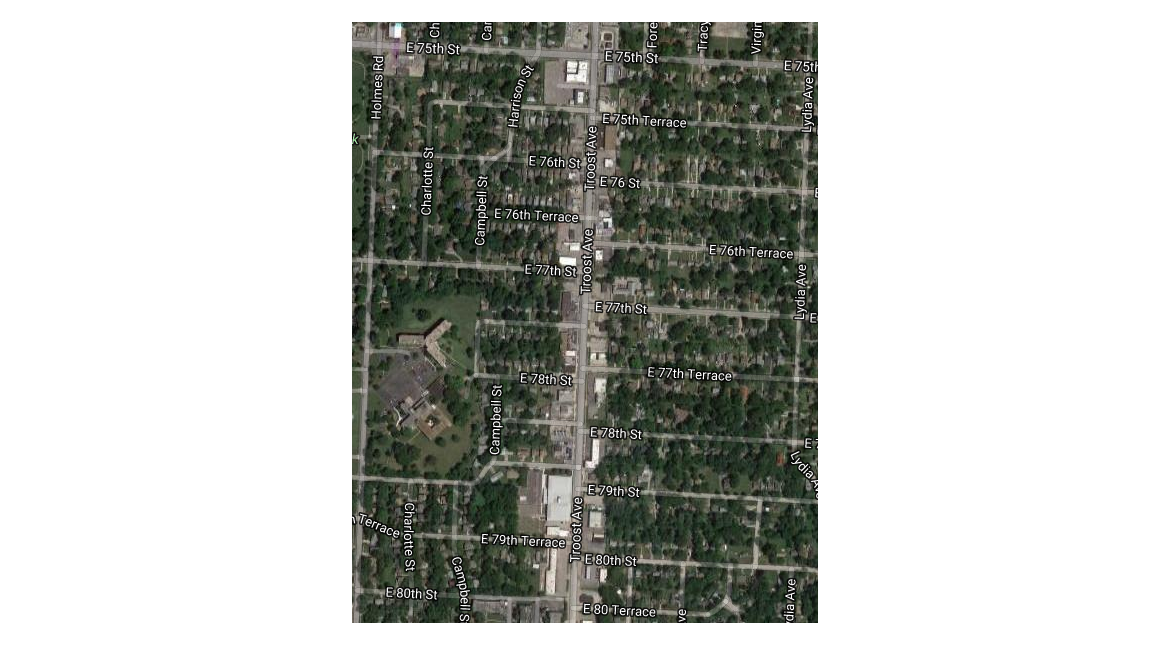
Close up from the 2012 aerial photo. 75th and Troost is at the center top.
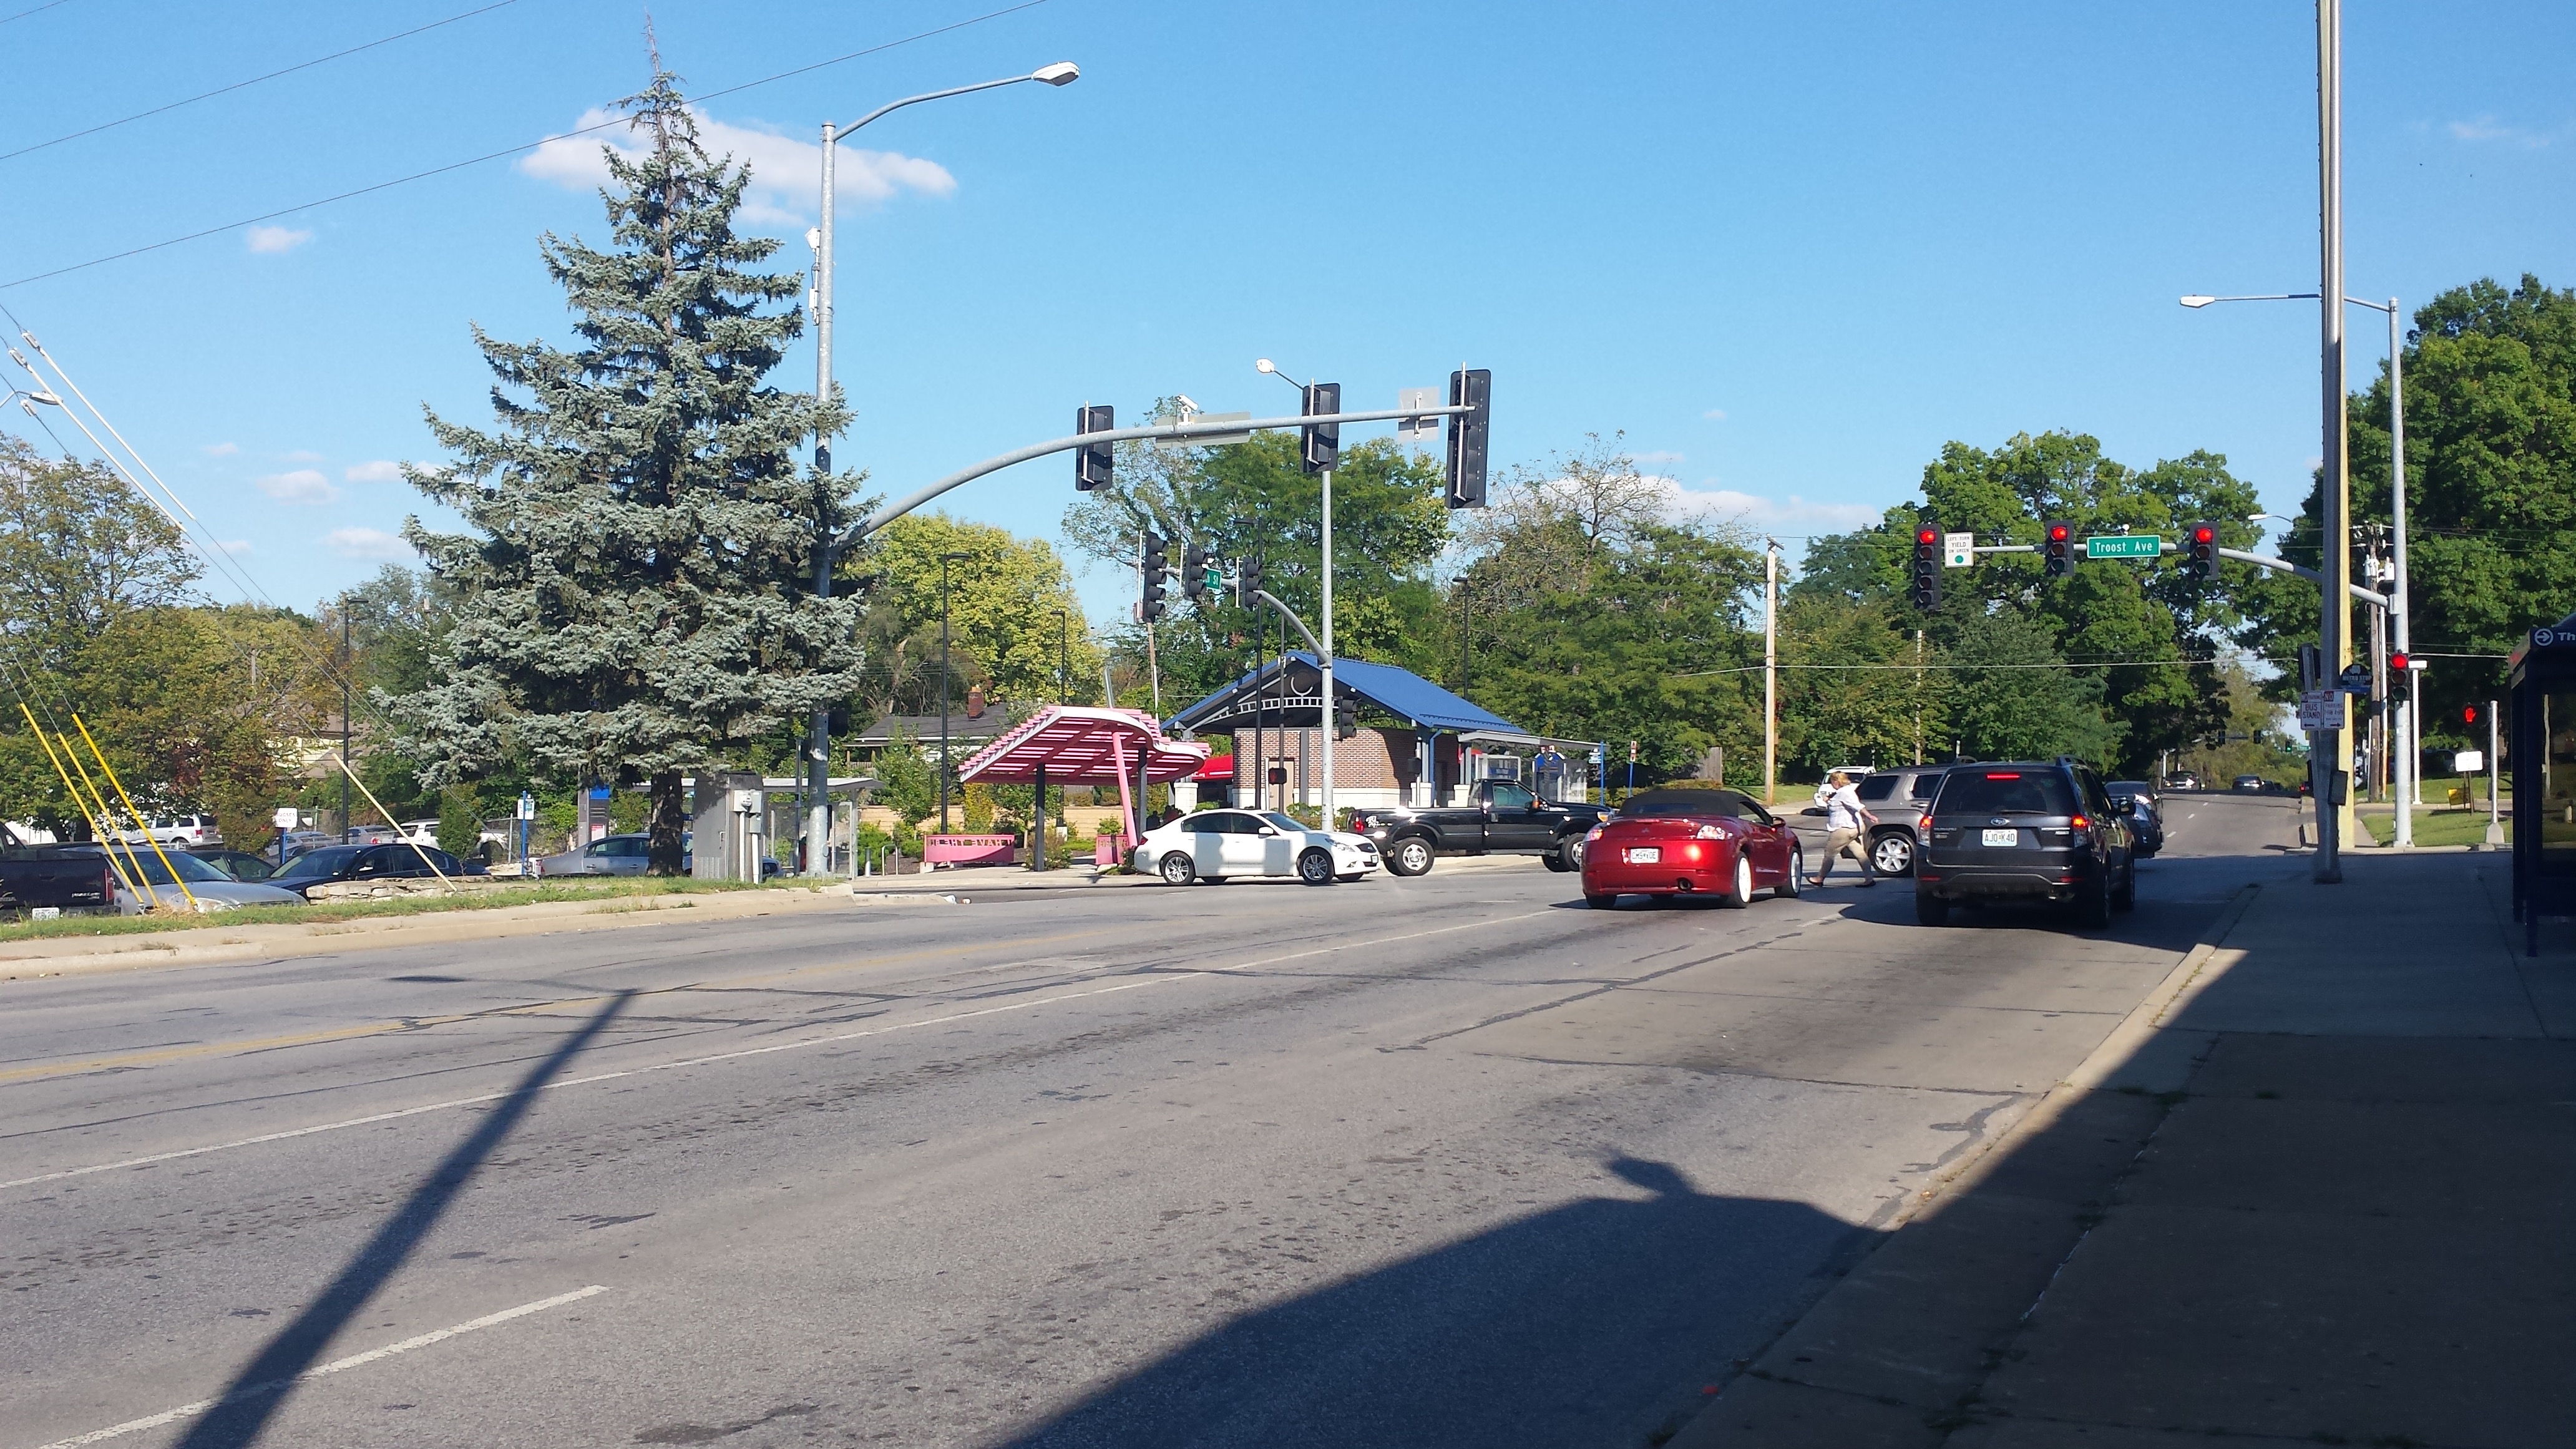 Looking east at 75th and Troost Intersection today
 Looking north at 75th and Troost intersection.
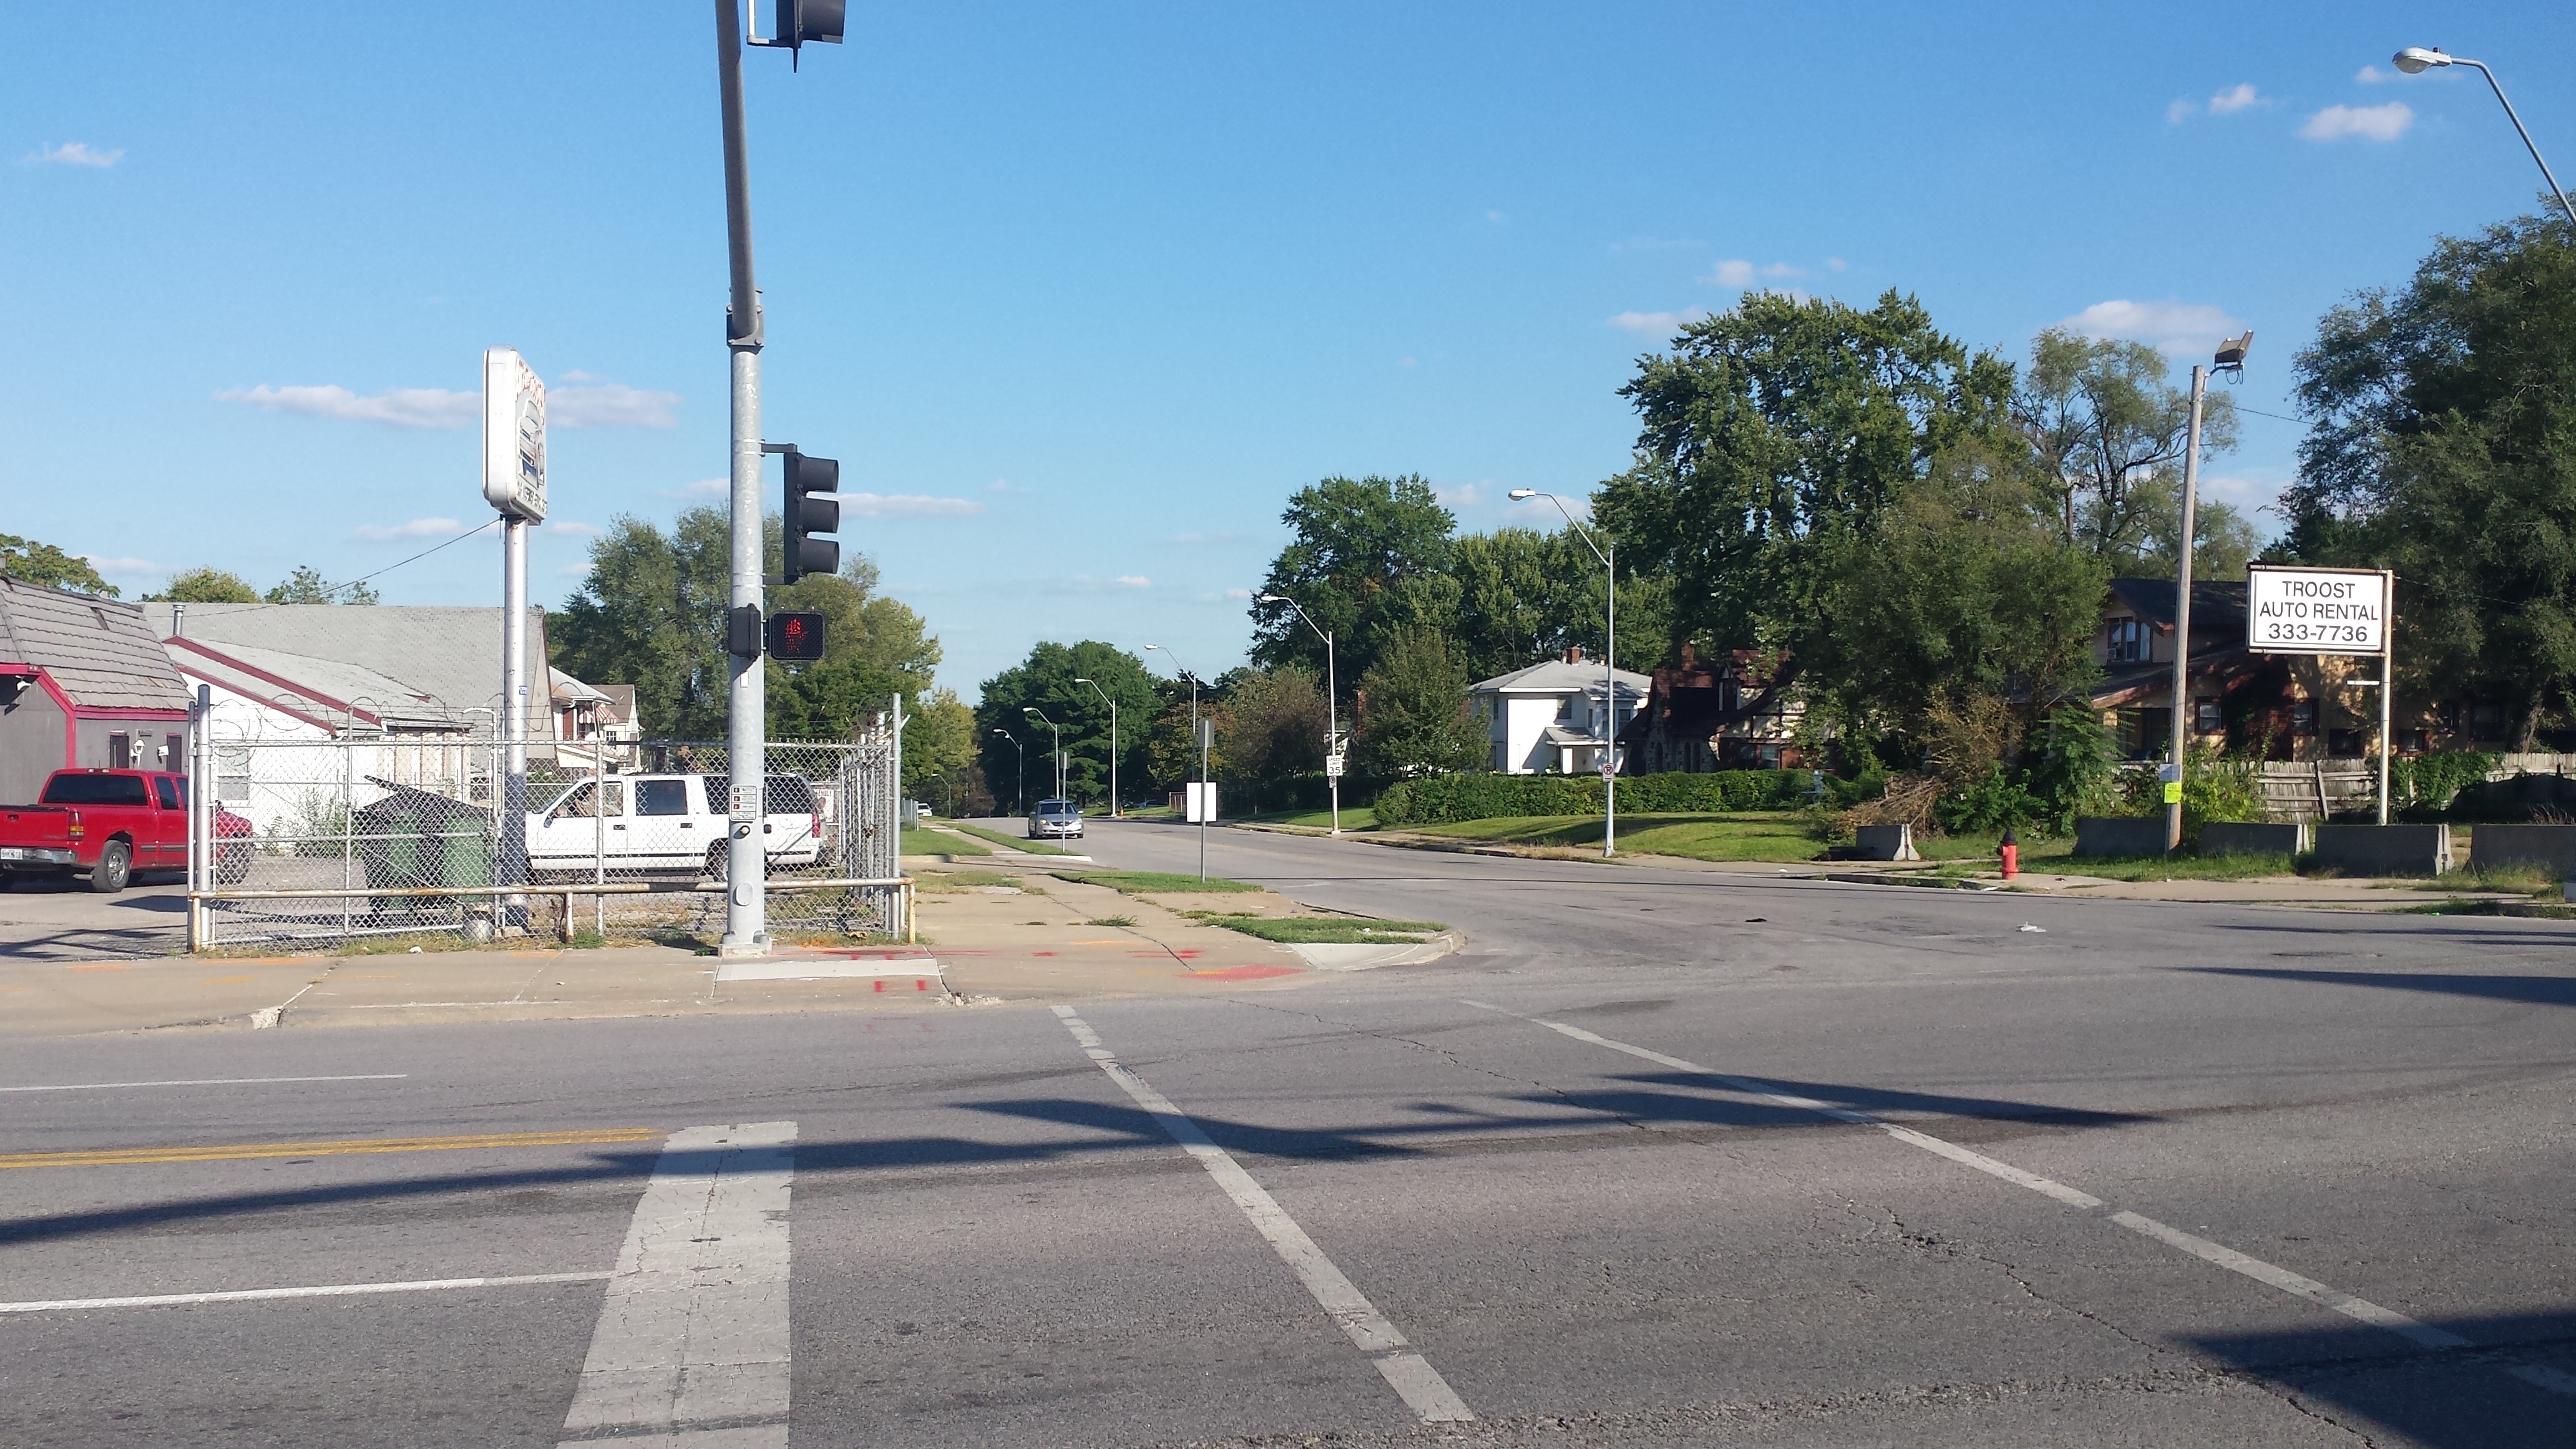
77th and Troost intersection, old Highway 71
61st and Meyer Blvd Census Entry – Carlos M.
The area I am covering is 61st and Meyer Blvd, the area has changed drastically over time, but one of the most prominent things that changed over time was the fact that education became something that was more valued, seeing as the number of high school graduates increased. Also, I was surprised that the population decreased rather than increased, seeing as at the KCMO level, the population amount boomed.
Census Data Analysis of 66th Terrace through 70th Street
My area of data analysis rests around 66th Terrace and 70th Street, which is home to census tract 86, on the west side of Troost, and tract 87, on the eastern side of Troost. A common theme of both tracts is a steady decreasing total population from 1950 to 2000. Tract 86 in particular, had an especially drastic decline of 2,294 residents during this time. Tract 87, followed the same pattern though to a much lesser extent, and lost 215 residents from 1950 to 2000. Interestingly, from 2000 to 2010, the Tracts seem to “flip”. During this time, tract 86, saw a mild decline of 14 residents, compared to tract 87, on the east side of Troost, which saw a rapid decline of 470 residents.
Another interesting thing I noticed; in 1950, when the black population of the western tract 86 outnumbered the eastern tract, 87 (a twist to where we are today), Troost Avenue still served as an economic and educational attainment dividing line. In 1950, the median income in the west tract was $6,855 and the median housing value $15,586, where in the east tract, the median income was $4,270, and the median housing value $9,790. Further, on the west side, 74.7% of the population over 25 completed high school or more, whereas on the East side, only 62.6% completed high school or more. Neat.
Census Data Analysis of Troost Avenue Between 40th Street and 43rd Street
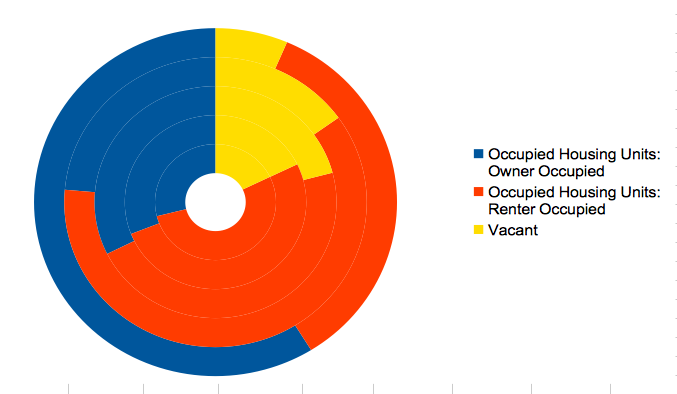
Troost Avenue between 40th Street and 43rd Street lay within Census Tracts 65 and 64 (64 changing to tract 169 after 2000) of Jackson County, MO. Between 1950 and 2010, many changes occurred within the area, most prominently seen in the total population, race/ethnic group majorities and vacant housing units. In 1950, both areas housed roughly 4,000 residents per tract. By 2000, the total population in both areas decreased by over 2,000 residents. In 1950, white residents dominated the area, but by 2000, black residents highly concentrated the area, becoming the dominate race in Census Tract 65 by a large sum and equaling the total number of white residents in Census Tract 64. The most imperative change that occurred over the sixty-year time span was the housing units that have become vacant along the Troost Avenue corridor and surrounding area. The number of vacant homes in both tracts increased to over 200 homes between 1950 and 2000. The unkempt, vacant homes can be seen while driving through the area, supporting the statistics provided. With the disinvestment the area has gone through, many buildings are left vacant or knocked down and left as empty lots. As more residents move out of the area, vacating and abandoning their homes, the area becomes less safe as less people are on the streets and the lack of community continues to grow which in turn creates a larger gap between the newly developed investment areas of Kansas City, and the areas built one hundred years ago that lack reinvestment and continue to further decay.
Census Report: East 13th Street and Truman Road
Examining the census data for the area around of East 13th Street and Truman Road along Troost Avenue, I see consistent similarities and difference among the three different years being examined. Those similarities and differences are among race and migration and housing statistics.
As I have research this area before when looking at sanborn maps, I found that there was a shift in interest of building interstate highways from rural areas to urban areas in the 1970s (Missouri Department of Transportation, 2013). I can clearly see that this is evident in my data. There is a clear decline in population from 1950 to 2010 in those first three tracts. For 1950, the total population for tract 16 was 6,549 (Social Explorer). In Tract 16 for 2000, the total population was 1,080 (Social Explorer). For 2010 in tract 154, the total population was 3,484 (Social Explorer).
As the population of black people still stays dominate throughout the three years being examined, when we get to the year 2000, the third major category is Hispanic/Latinx which was at a total in both tracts of 4.47% (Social Explorer). The number of Hispanic and Latinx people in both tracts in 2010 was 6.24% (Social Explorer). In the area that I have been analyzing there is a slow migration of Hispanics to the Independence Avenue area, extremely close to east 13th Street and Truman Road. From a Kansas City Public Radio article in 2014, “A surge of new immigrants from Central America and Mexico revitalizes Kansas City’s most established Hispanic communities. Armourdale is repopulated with new Latino immigrants. Many immigrants resettle in corridors, such as Central and Minnesota Avenues in Kansas, and Independence Avenue in Missouri” (Rodriguez, 2014).
Missouri Department of Transportation. (2013). “Missouri’s Interstate System: Yesterday, Today and Tomorrow”. Retrieved from http://www.modot.org/interstate/ MissourisInterstateHistory.htm.
Social Explorer. (1950, 2000, 2010). Retrieved from https://www.socialexplorer.com/a9676d974c/explore
Rodriguez, Lisa. (2014). “Timeline: Events That Shaped Kansas City’s Hispanic Communities In Missouri, Kansas”. KCUR. Retrieved from http://kcur.org/post/timeline-events-shape d-kansas-citys-hispanic-commmunities-missouri-kansas#stream/0
Census Report – Troost Avenue Between Volker Boulevard and 52nd Street/Rockhurst Road
The census tracts that contained my area of Troost Avenue between Volker Boulevard and 52nd Street/Rockhurst Road were census tracts 74 and 75. I compared these two census tracts to one another as well as the overall city and the larger metropolitan statistical area across three censuses – 1950, 2000 and 2010.
Census tracts 74 and 75 had both similarities and differences to each other over the years. For example, in 1950, both census tracts were over 99% white. However, in 2000, tract 74 remained predominately white (78.1%) whereas tract 75 became predominately black (60.4%). This is the trend that we still see to this day as tract 74 lies on the west side of Troost, which is often associated as mainly white and tract 75 lies on the east side of Troost, which is often associated as mainly black.
One area where the census tracts are similar is on the median rent price. In 1950, tract 74 had a median rent price of $53 while tract 75’s was $54. In 2000, both census tracts’ median rent price was $539. Finally, in 2010, there began to be a little bit more of a gap because tract 75’s median rent was $865, while tract 74’s was only $850.
Demographics of Troost Avenue Between 31st St. and Armour Blvd.
In 1950, the area between 31st Street and Armour Boulevard on Troost Avenue was a dense community of almost exclusively white residents. This changed drastically over the next fifty years. The population density greatly decreased as many Kansas City residents relocated outside the city center and the population became decentralized. These changes also led to differences in race and class. As many wealthy, white residents expanded outward, this area of Troost Avenue was left to predominately low-income, minority residents. By the 2000s, Troost Avenue had become a dividing line. Residents on the west side had a more even distribution of race and a higher median income. Residents on the east side were predominately minorities with a lower median income.
Census Report of Area Between 72nd Street and 75th Terrace
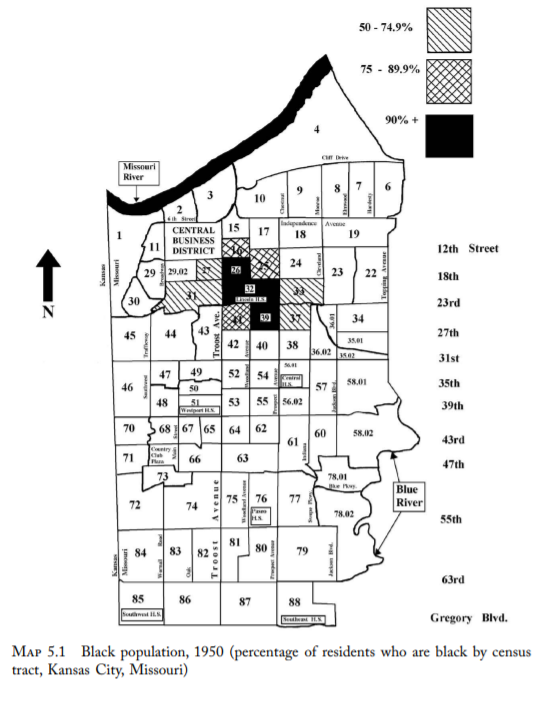
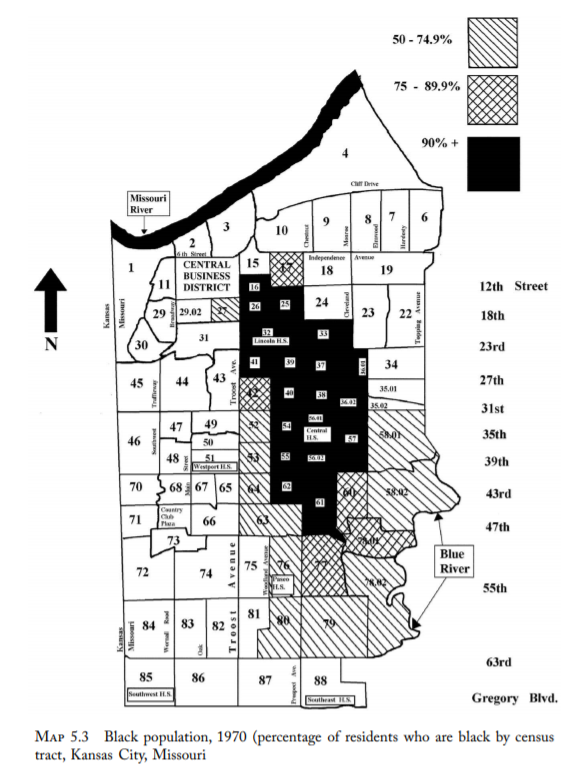
For my census project I was tasked at exploring the different demographic variables for the areas between 72nd street and 75th terrace. To do this I looked at census tracts 90 and 91 for Jackson County in Kansas City for the years 1950, 2000, and 2010. Census tract 91 shows information for blocks west of Troost Avenue and 90 represents areas east of Troost. Upon exploring information from the US Census Bureau and American Community Survey, I found some very interesting information. The most interesting thing that I found was the segregation of the African American population east of Troost and how it could not really be seen in 1950 for my area, but was very visible by 2000. The first picture shown in this post shows that segregation of the African American population was happening in Kansas City by 1950, but that it had not quite reached 72nd street yet. The second picture shows Kansas City in 1970 and how segregation had expanded. Although not yet to 72nd street, these two pictures show how racial division was following Troost and expanding rapidly. By 2000 segregation would have reached my census tracts. In fact in 2000, census tract 90 was around 88% African American and around 8% white, while census tract 91 was almost 77% white and only around 19% African American (United States Census Bureau (2000). Social Explorer, Jackson County Missouri Census Tract 90 & 91. Retrieved From https://www.socialexplorer.com/tables/C2000/R11508552). I thought it was very interesting to learn when segregation became present in my area and the other demographic variables that were affected by segregation.