The area between Gilham Rd and Cherry street changed drastically over these time periods. The main reason was because the population continued to grow every year. African American and
White were the more dominant races between the years. As this area began to change, there was an increase in income, greater amount of individuals that were educated and attended some college and the housing rates and rent were increased dramatically.
Census Data Analysis Wyandotte to Main
The census tracts for the blocks of Armour Boulevard between Wyandotte and Main were 47 and 48 for the 1950 and 2000 censuses but changed to tract 167 in the 2010 data. For the most part, my area did not change as much as other blocks. This portion of Armour has always been made up of working class individuals. The 1950 data shows the area to be predominately white and the 2000 and 2010 data is very similar. While the population of the city as a whole increased, the population on Armour between Wyandotte and Main decreased. This decrease is most likely due to the demolition of many apartment buildings to make space for retail and corporate buildings such as the American Red Cross at Wyandotte and Armour.
Norton Avenue to Spruce Avenue: Census Analysis
The Census Tracts for Norton and Spruce Avenue are split between Census Tracts 57 and 58, so i analyzed both. As one of my other classmates has observed, the most striking statistics in this area, are that of race. In Both census tracts, the area does a complete 180, in terms of the white and black populations, in the 50 years between 1950 and 2000. The area shifts from nearly exclusively white (100% white in Census Tract 57) to almost completely black.
Another interesting statistic is the number of houses built and destroyed between the two census tracts. They roughly balance each other out. While about 100 houses are built in Census Tract 57, nearly 100 houses are destroyed in Census Tract 58.
Census Data Blog
My assigned blocks were 35th and Prospect Avenue through Chestnut Avenue. This is a low income neighborhood that revealed some very interesting census data. The most intriguing piece of data I found for this area was the racial demographics. In 1950, this area was almost all Caucasian. There were over 8,000 Caucasian people and only 18 African American people in this neighborhood back in 1950. As of 2010, this data has virtually flipped. There was a big decrease in population through those 60 years, so now there are 19 Caucasian people and 1,918 African Americans. Throughout the past 60-70 years, we’ve seen most of the Caucasians move out of the city and into the suburbs, while African Americans have moved into the downtown area.
Census Tract 57
Within my boundary of Indiana to Askew, not much had changed population wise from 1950 to 2010, however, there was a major racial shift from 1950 to 2000. The tract population was 100% white people in 1950, particularly the white middle aged people who were well off in their jobs and set in their lives. This all changed and on the 2000 census, tract 57 was recorded as having almost 96% of it’s residents identifying as African American, who turned out to be making more income and raising the value of the houses. A concept that was “unbelievable” at that time in history. I believe this was due to the lifting of the racially restrictive covenants as well as the redlining that was around before the Civil Rights movement. Even in present day Indiana and Askew, the population is predominantly African American and slightly more Hispanic and Latino than it was in 2000 as well.
Back in 1950, pretty much every house had a family or somebody living in them. Unfortunately as time has passed, this has not remained the case. There were 312 vacant housing units in this census tract in 2010, but there were 30,000 vacant housing units in the metropolitan area of Kansas City. This was a huge shock and a disappointment as most of us drive by at least one homeless person a day. The fact that we have this many unused houses is astounding and heartbreaking when they could be put to good use instead of just rotting away.
Harrison Boulevard to Forest Avenue, Census Tracts 52 and 178
The two census tracts along Armour Boulevard that contain portions of Forest Avenue and Harrison Boulevard have seen better days. During the 1950s, it was a densely populated area, outfitted with many grocery and drug stores to serve the nearly 20,000 residents within just these two tracts. 82% of those residents lived in the many apartment buildings in the area, as many as 6 within a four block radius. 99% of these tracts’ residents were Caucasian. By 2000, the landscape had dramatically changed, nearly all of the previous apartments being demolished, and the population shifting to an almost even distribution of white and black. This period of 50 years saw the population decrease by almost 5,000 people. As disinvestment crept in, so did crime of all kinds which made the area even more undesirable. By 2010, the area’s population density had sunk to just 5, 219 people per square mile on average (it was an average of 26,862 in 1950). The population had become so small in fact that the two tracts that had contained Harrison and several other streets to its West for 50 years were consolidated into just one tract in 2010. Though this area was and is still blighted, promising signs of revitalization are appearing. A community center at the intersection of Armour and Forest that sat abandoned for more than 40 years has been purchased and is currently under construction, and an Operation Breakthrough Center has opened at 31st and Armour.
Census Data Analysis
I was assigned 35th Street from Chelsea Ave. to Emanuel Cleaver II Blvd, which is attributed to census tract 58.1. Kansas City has historically had a low representation of non-Whites, in 1950 they only represented 13% of the population in the City, which rose somewhat in 2000 to 31.2, and by 2010 non-Whites represented only 29% of the overall population. When taking the census tract into consideration, it is immensely clear that non-Whites in Kansas City are segregated from White communities, they are not receiving adequate education (by 2010 the educational attainment was high school graduate), they are working low paying jobs, and are forced to live in poverty conditions. This is some of the information gleaned from gathering this data, and for census tract 58.01, which is east of Troost, the 1950 to 2010 is representative of White flight and segregation of non-Whites.
Hardesty and Oakley
My area consisted of Hardesty Avenue and Oakley Avenue on 35th street. This area today is close to Van Brunt Boulevard and has not much development around and just a few houses. One of the most interesting things that I came across was the simple fact that as black families moved in white families fled for segregated neighborhoods. Taking a look at 1950 census data shows 3,214 white people lived in this census tract. In 2000 only 91 white peopled here. This alone was very shocking
Census analysis on 35th street between Olive St and Prospect Ave
Four blocks which I had to analyze are between Olive St and Prospect Ave on 35th St. From 1950 to 2010, there are two big changing in this area. Firstly, I recognized that throughout the time, population of this area was decreased clearly and the ratio of white people was also decreased. The second point is educational development and this point is also the most effective point of this area. Throughout 1950 to 2010, the ratio of college graduation was increased mostly ( From 19.6% to 29.6% and From 17.7% to 25.9%). This point was the foundation for median household income increasing. From the increasing of income, the median housing value was also increased and make this area becomes more valuable.
Census Analysis (Census Tract 0050/50/178)
The census tract that my blocks reside in started off as tract 0050 in 1950, simplified to simply tract 50 in 2000, and then redefined as tract 178 by 2010. I mentioned in my previous project that the blocks that I analyzed once had two or three rows of homes behind the three large apartment buildings that dominate E. Armour Blvd between Gillham Rd. and Warwick Blvd. Some time in the early to mid-century, those homes were demolished to make way for a massive parking lot. Whether this had anything to do with the overall population of the census tract, I’m not sure, though it could possibly relate to the steep population drop between 1950 (5,972) and 2000 (2,395).
I also discussed in my paper the domination of white residents within the tract, being at 98.76% in 1950, and actually reversing the ratio with white residents making up 39.87% of the tract population and non-white residents making up 57.42% in 2000. I wonder if this could have anything to do with those apartment buildings and surrounding residential plots, and racist/biased leasing policies for the area, though it could also simply be the dispersion of the mere 12.3% of non-white residents that made up Kansas City in 1950 according to the population census.
Census Data Analysis
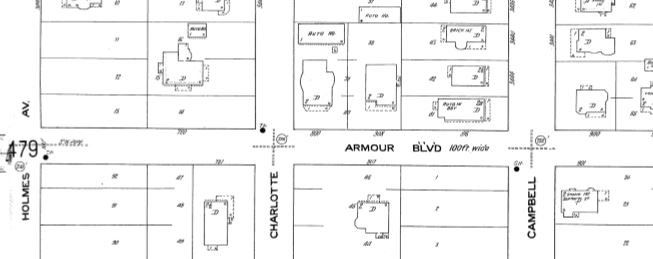
The block of Armour Road that I had was between, Holmes St. and Campbell St., I noticed that from 1950 to 2010 there haven’t been many new housing units built. But also the fact that Between 1950 and 2010 the population was almost cut in half and same with the percent of housing units occupied. The Growth of the number of whites through the years has changed where there was almost close to the same percentage amount of whites as there were blacks. back in 1950, the Blacks had the majority by almost 20 percent. Also the fact that people of 25 and above made up about 68 percent that only 25 percent of that 68 percent had some college and only 13 people had a doctorate.
Census Analysis Between McGee and Locust
My assigned blocks were off of Armour Boulevard and in between McGee and Locust. The most shocking conclusion that I came to when doing this assignment was the amount of vacant houses in the area. In 1950 only a little over two percent of the housing units were considered vacant, but then jumping to 2010 the number grew to an astounding 40%. There were almost as many vacant houses as there were that were renter occupied. This seems to be a major issue for the area.
Census Analysis
My part of Armour was between Gillman Rd and Cherry St. The most interesting trend that I saw within my Census data was the changing Median age in my area. In 1950 the median age was 38.1, in 2000 the median age was 32.9, and in 2010 the median age was significantly lower at only 31.5. As the median age decreased, so did the median income.
Census Data Analysis, 35th St. between Cypress Avenue and Chelsea Drive
The blocks on 35th St. between Cypress Avenue and Chelsea Drive in Kansas City, Missouri resides within census tract 58. These two blocks are fairly sparse with development. There are a handful of residential buildings, (small houses) and one tiny Baptist Church. However, there is mostly just open lots along the road between Cyprus and Chelsea.
Upon looking at the census data for this particular census tract, I found a drastic change in racial composition from 1950 to 2000. In 1950, the population of this census tract was predominantly white. By the year 2000 the census tracts population was made up of over 90% black, and the total population had decreased by 37%. The population decrease doesn’t stop there though. From 2000 to 2010, the census tracts population continues to bleed out, dropping another 49% in just 10 years.
Census Data
I Had the blocks off Armour blvd, from Main St to Warwick. It was interesting to see the largest change happened in population and race with tracts 50 and 51. The population started off in the thousands and quickly dropped to the hundreds as time progressed. In the same tracts looking at race starting at 1950…As soon as more African Americans moved into the area the White population began to decrease.
Baltimore and Walnut Census Data
The census tracts containing Baltimore and Walnut at Armour Boulevard have changed demographically over time. In the 1950’s the whites dominated the neighborhood, while blacks and “others” were small in number. This could have been attributed to the redlining and restrictive covenants of the time. Over time, however, other races would populate the area. In 2000, the neighborhood would drop considerably in population. This makes sense due to the fact that many people (mostly white people) would move further south as the city sprawled. However, the white people would return and the population would rise in 2010.
Chestnut to Agnes Census Analysis
The area on 35th Street between Chestnut and Agnes (Census Tract 56) has transformed from a predominantly White, suburban neighborhood to a predominantly Black, lower income area. In 1950, Tract 56 was reflective of Kansas City as a whole in terms of race, income, and education. However, the 2000 Census shows a very different picture. Tract 56 is no longer representative of Kansas City, which indicates a certain level of segregation between White and Black, between high income and low income, and between the upper class and lower class. Combining this data with observations about how Kansas City is laid out, it is not hard to see the correlation between race and income which could stem from the (still-existing) role of racism during the 1950’s and 1960’s.

Euclid to Brooklyn Avenue Census
Blocks Euclid Ave to Brooklyn Ave on 35th street underwent much development from 1950 to 2010. A seemingly quiet residential street next to Highway 71, these blocks changed very dramatically in educational attainment over the years in different ways. In 1950, the percentage of residents with a high school degree was only 31.%, and climbed to 58.4% in 2000. Amazingly, it increased 26.9% in just 10 years, the final percentage of residents with a high school degree being 85.3% in 2010. Unfortunately, the story was not the same with bachelor’s degree recipients. The percentage of residents achieving a bachelor’s degree in 1950 was 7.1%, and peaking at 9.7% in 2000. Sadly, the percentage dropped completely in 2010, settling at 0%.
Agnes Avenue to Benton Boulevard
Analyzing the census data from 1950, 2000, and 2010 for the blocks along 35th Street from Agnes to Benton was an illuminating experience. If I had ever perceived dramatic racial turnover as a myth, here was data and proof that it was not. From 1950 to 2000, the area of Kansas City named Oak Park Northwest, where my blocks are located, went from being almost 100% white to almost 100% African American in their demographic makeup. This was especially interesting, as many of the ideas of racial segregation that we typically think of occur before the 1950s and the historical Brown v. Board case, but here it shows that the 50s instead of desegregation were the beginning of a whole new set of circumstances that prevented integration and equal housing.
Tracy Ave and The Paseo
I studied the section of armour blvd between tracy ave and the paseo. In this area, the most interesting thing I found demographically was the racial shift between 1950 and 2000. In 1950, there were about 5/6,000 whites and 50/60 blacks and by 2000 those numbers had flipped. It is interesting to see in factual data how racism can affect an area and how powerful white flight was and how it still affects our city today.
McGee and Locust
When looking at the blocks between McGee and Locust along Armour Boulevard and 36th Street, you see that today it is a busy but quiet part of the city. The blocks are lined with houses and apartment buildings for the most part, but are also home to a school, health facility, a coffee shop, and a few other businesses. This was not what the blocks would have looked like over a hundred years ago though. When looking back in 1895, this area was only used for housing purposes but over the years other establishments have came and gone. Most of these blocks are located in the historic Hyde Park area along Gillham Road, so there is also some history that comes with the area. 
Between Denver and Hanesty
The urban sprawl has expanded out to where it does connect to the block, but it hasn’t really been overwhelmed yet. It’s at the end of 35th street, and unfortunately, there isn’t a whole lot there in terms of development. Cool church though. Also anytime I try to rotate the photo, my computer locks up, I do apologize.

Norton to Spruce
Norton, Jackson, and Spruce Avenue are located about 4 blocks east of current day Kansas City VA Medical Center. Just west of Norton Avenue, (between Norton and Mersington Avenue) there is a space, larger than the spaces between the other blocks, of almost solid trees. No development has ever been done in this space. Most of the space is used, and has always been used, as residential, with more and more single family homes being built over time. As more homes were built, a church and restaurant were also built 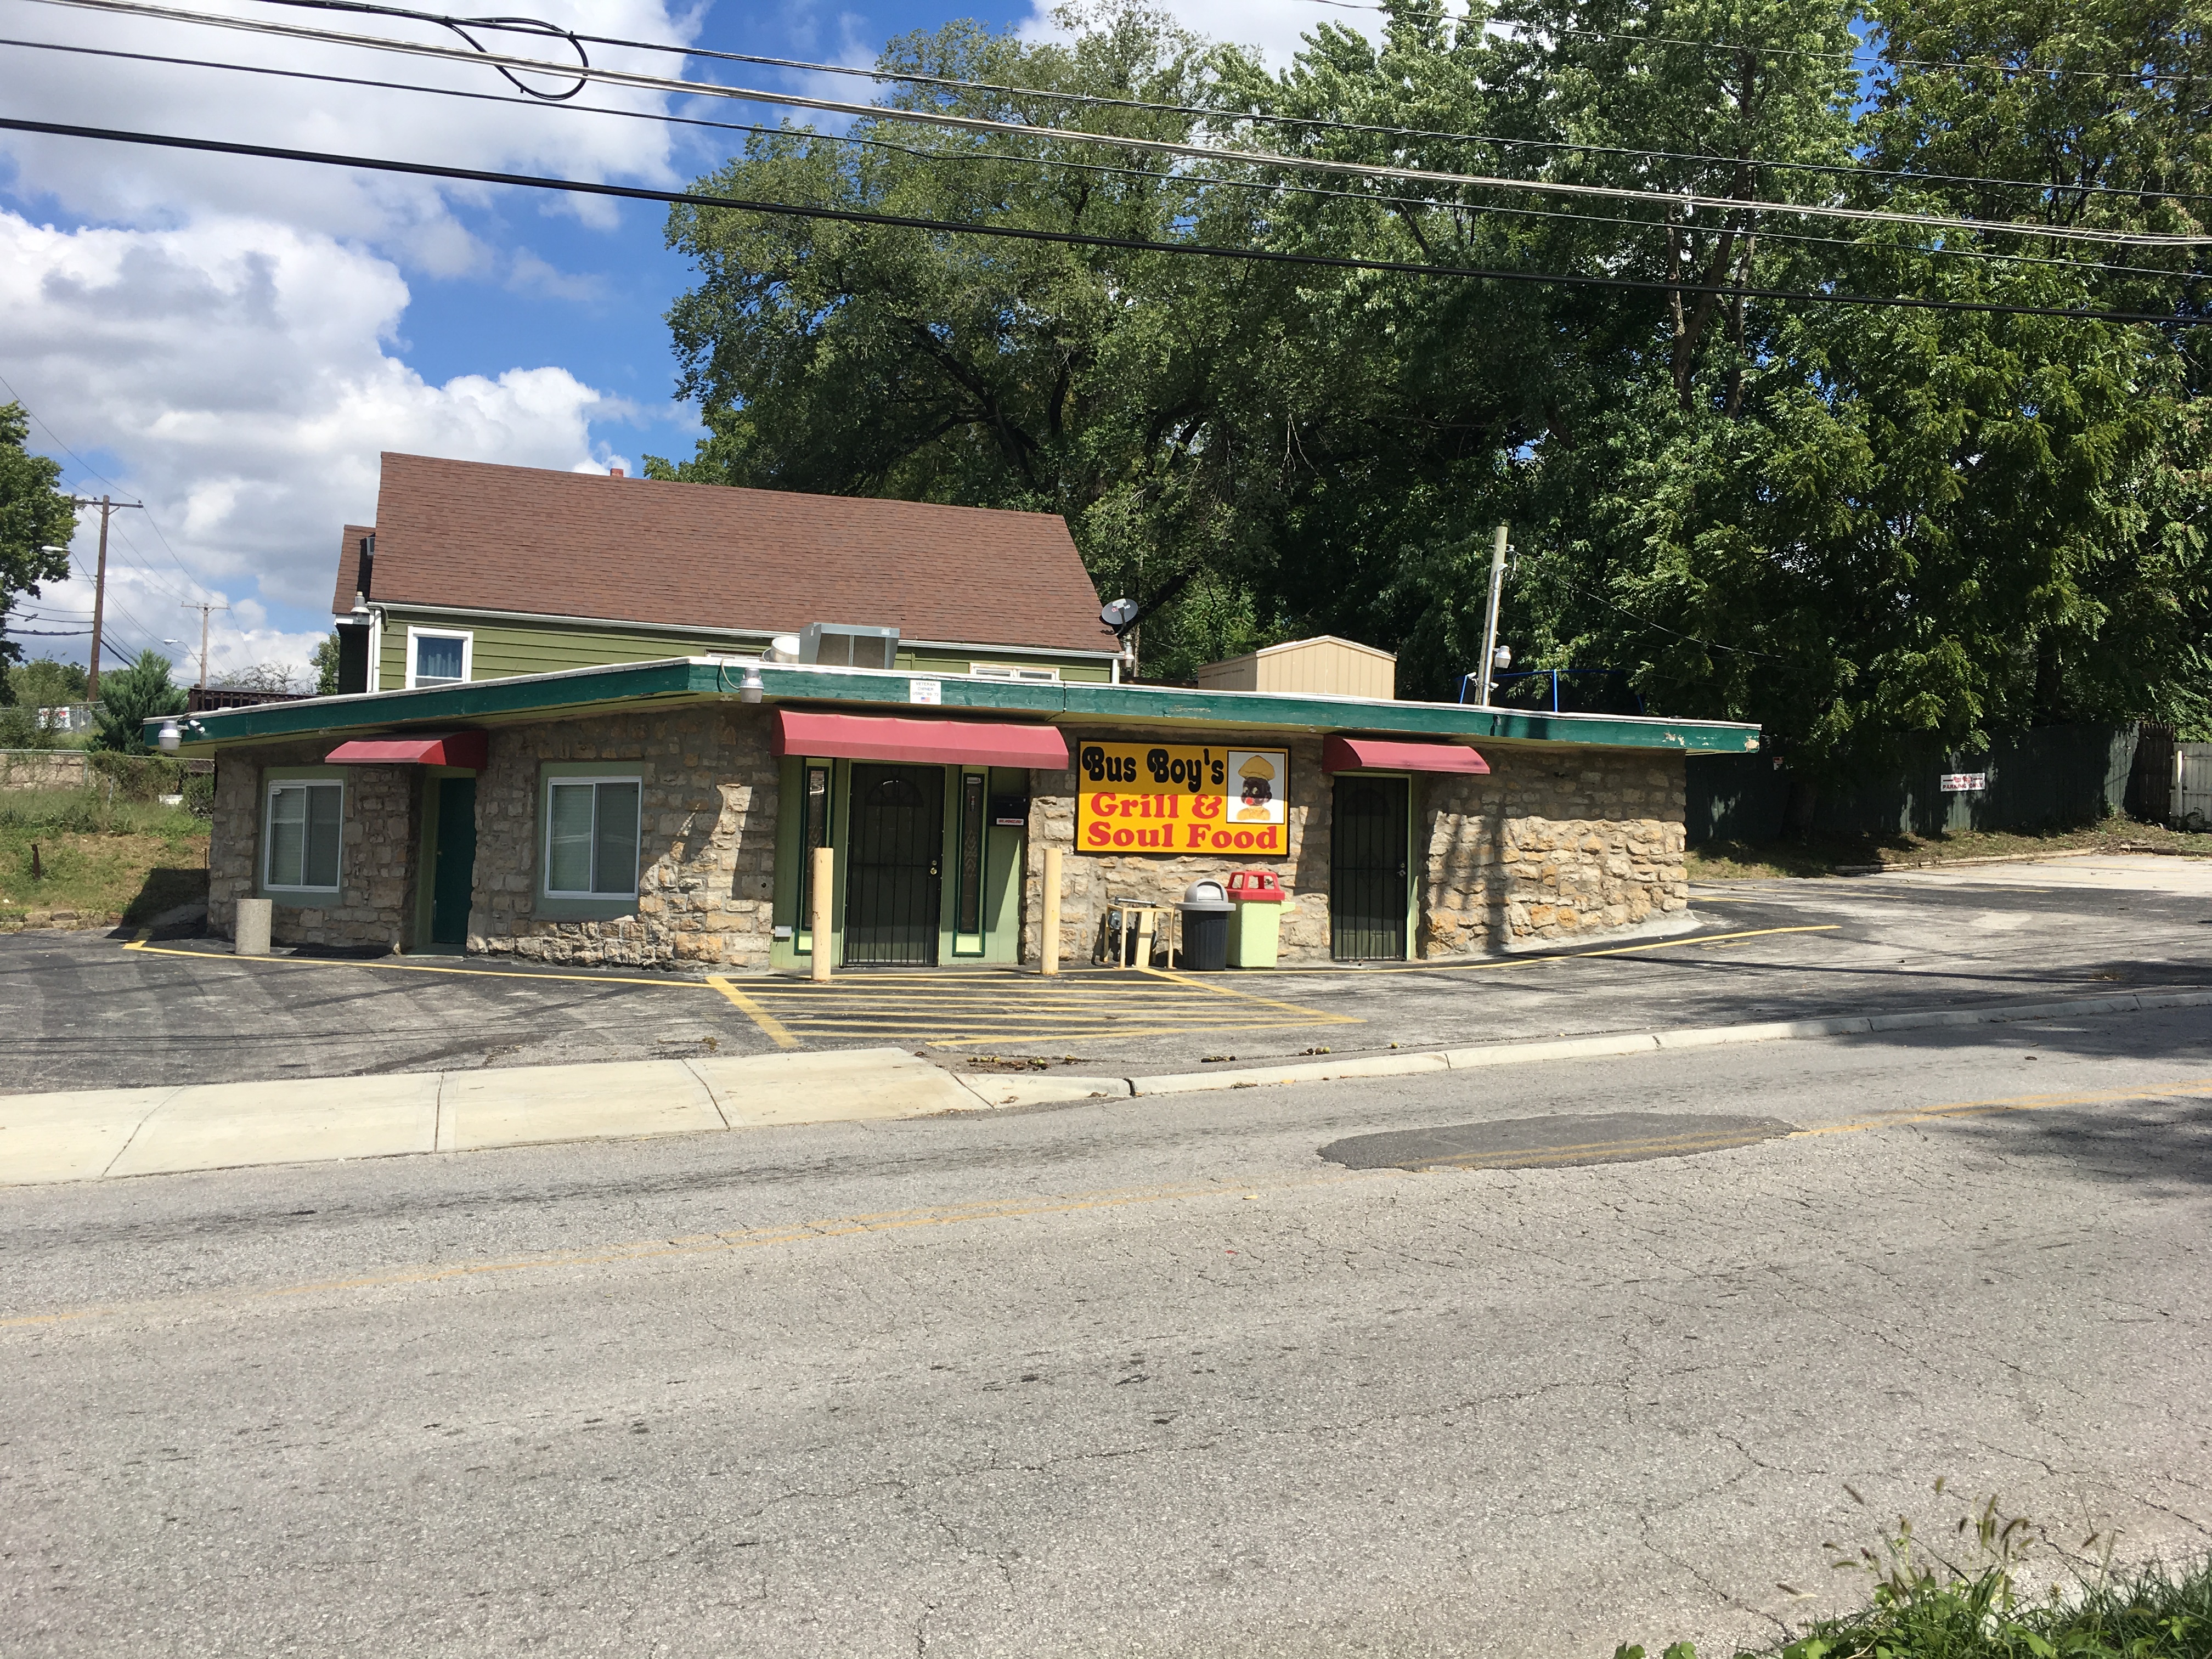
Between Warwick Blvd. & Gillham Rd.
My blocks ran north and south of E. Armour Blvd. between Warwick Blvd. and Gillham Rd.; over 100 or so years, the area gradually transformed from sparse, empty space, to a bustling and over-crowded residential hub, to the minimal but larger-scale business area that rests there today. There are three constants in the area starting from roughly 1909: The Bellerive, Park Central, and Clyde Manor “Apartment-Hotels”. These three apartment buildings sit in a row north of E. Armour and still stand today, but the gaggle of houses that once took up the land behind them have long since been replaced by a massive parking lot for the buildings’ inhabitants.
 (2018)
 (c. 1909)
Summit to Pennsylvania
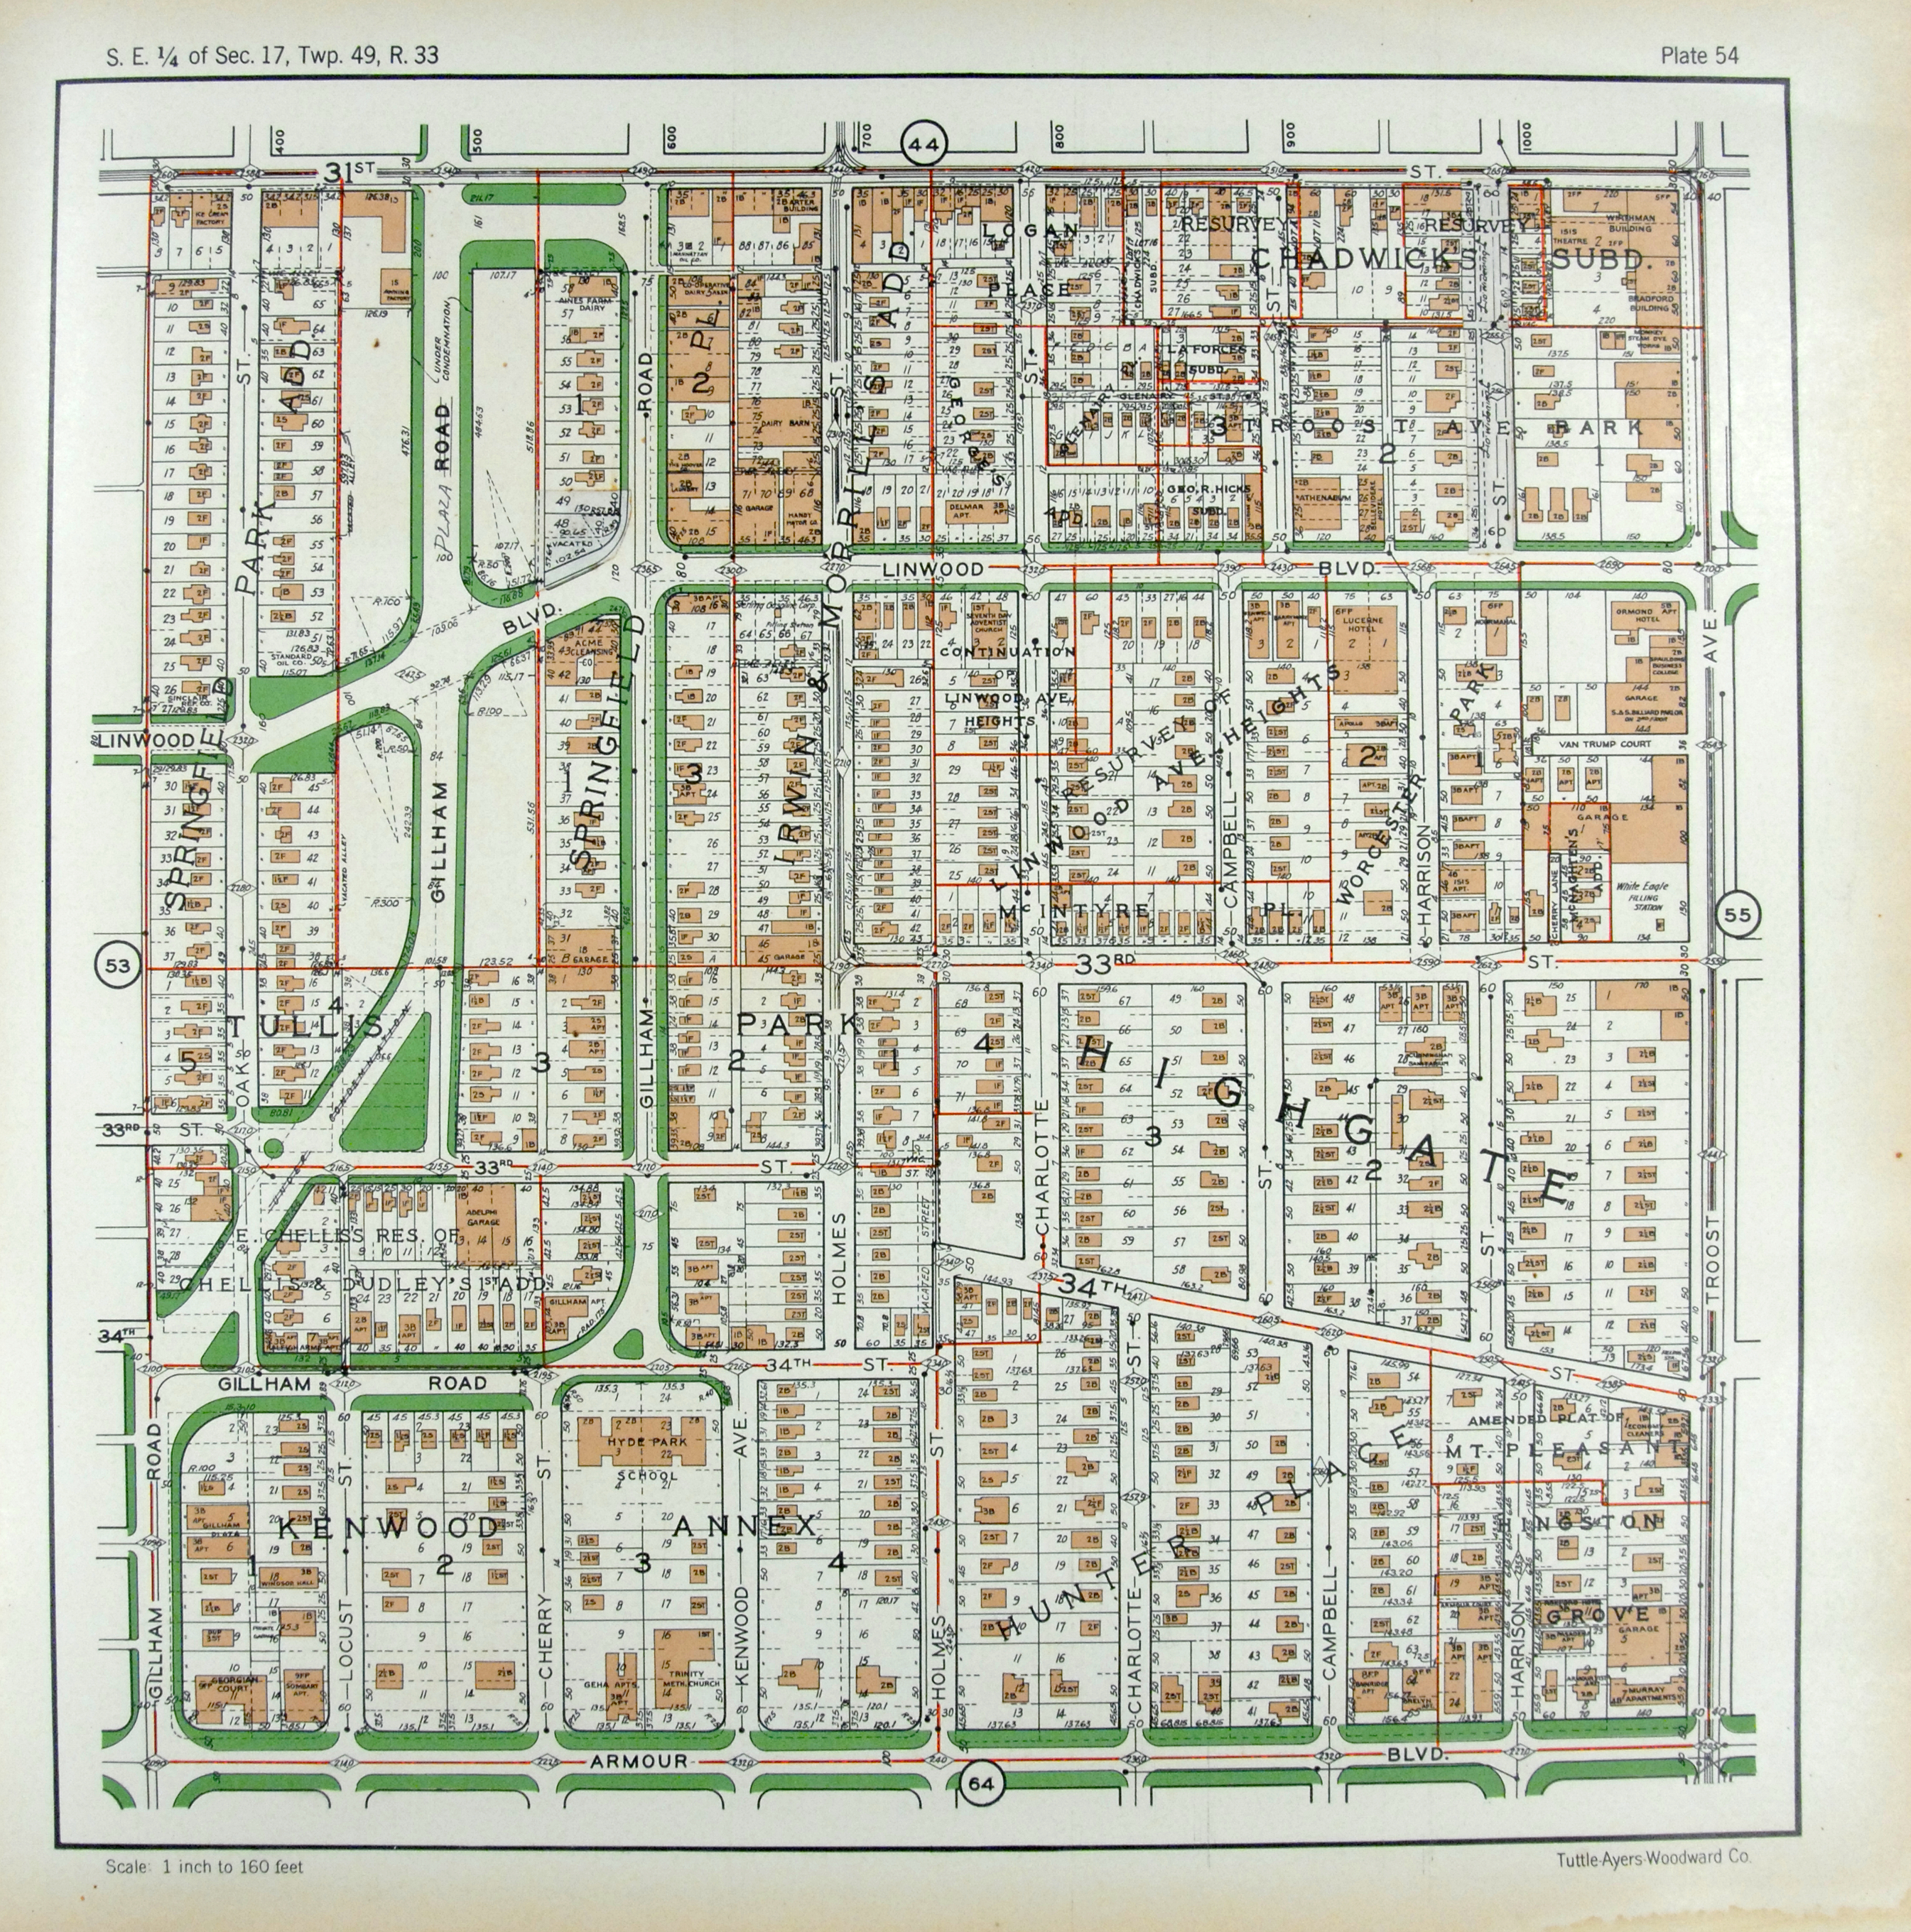
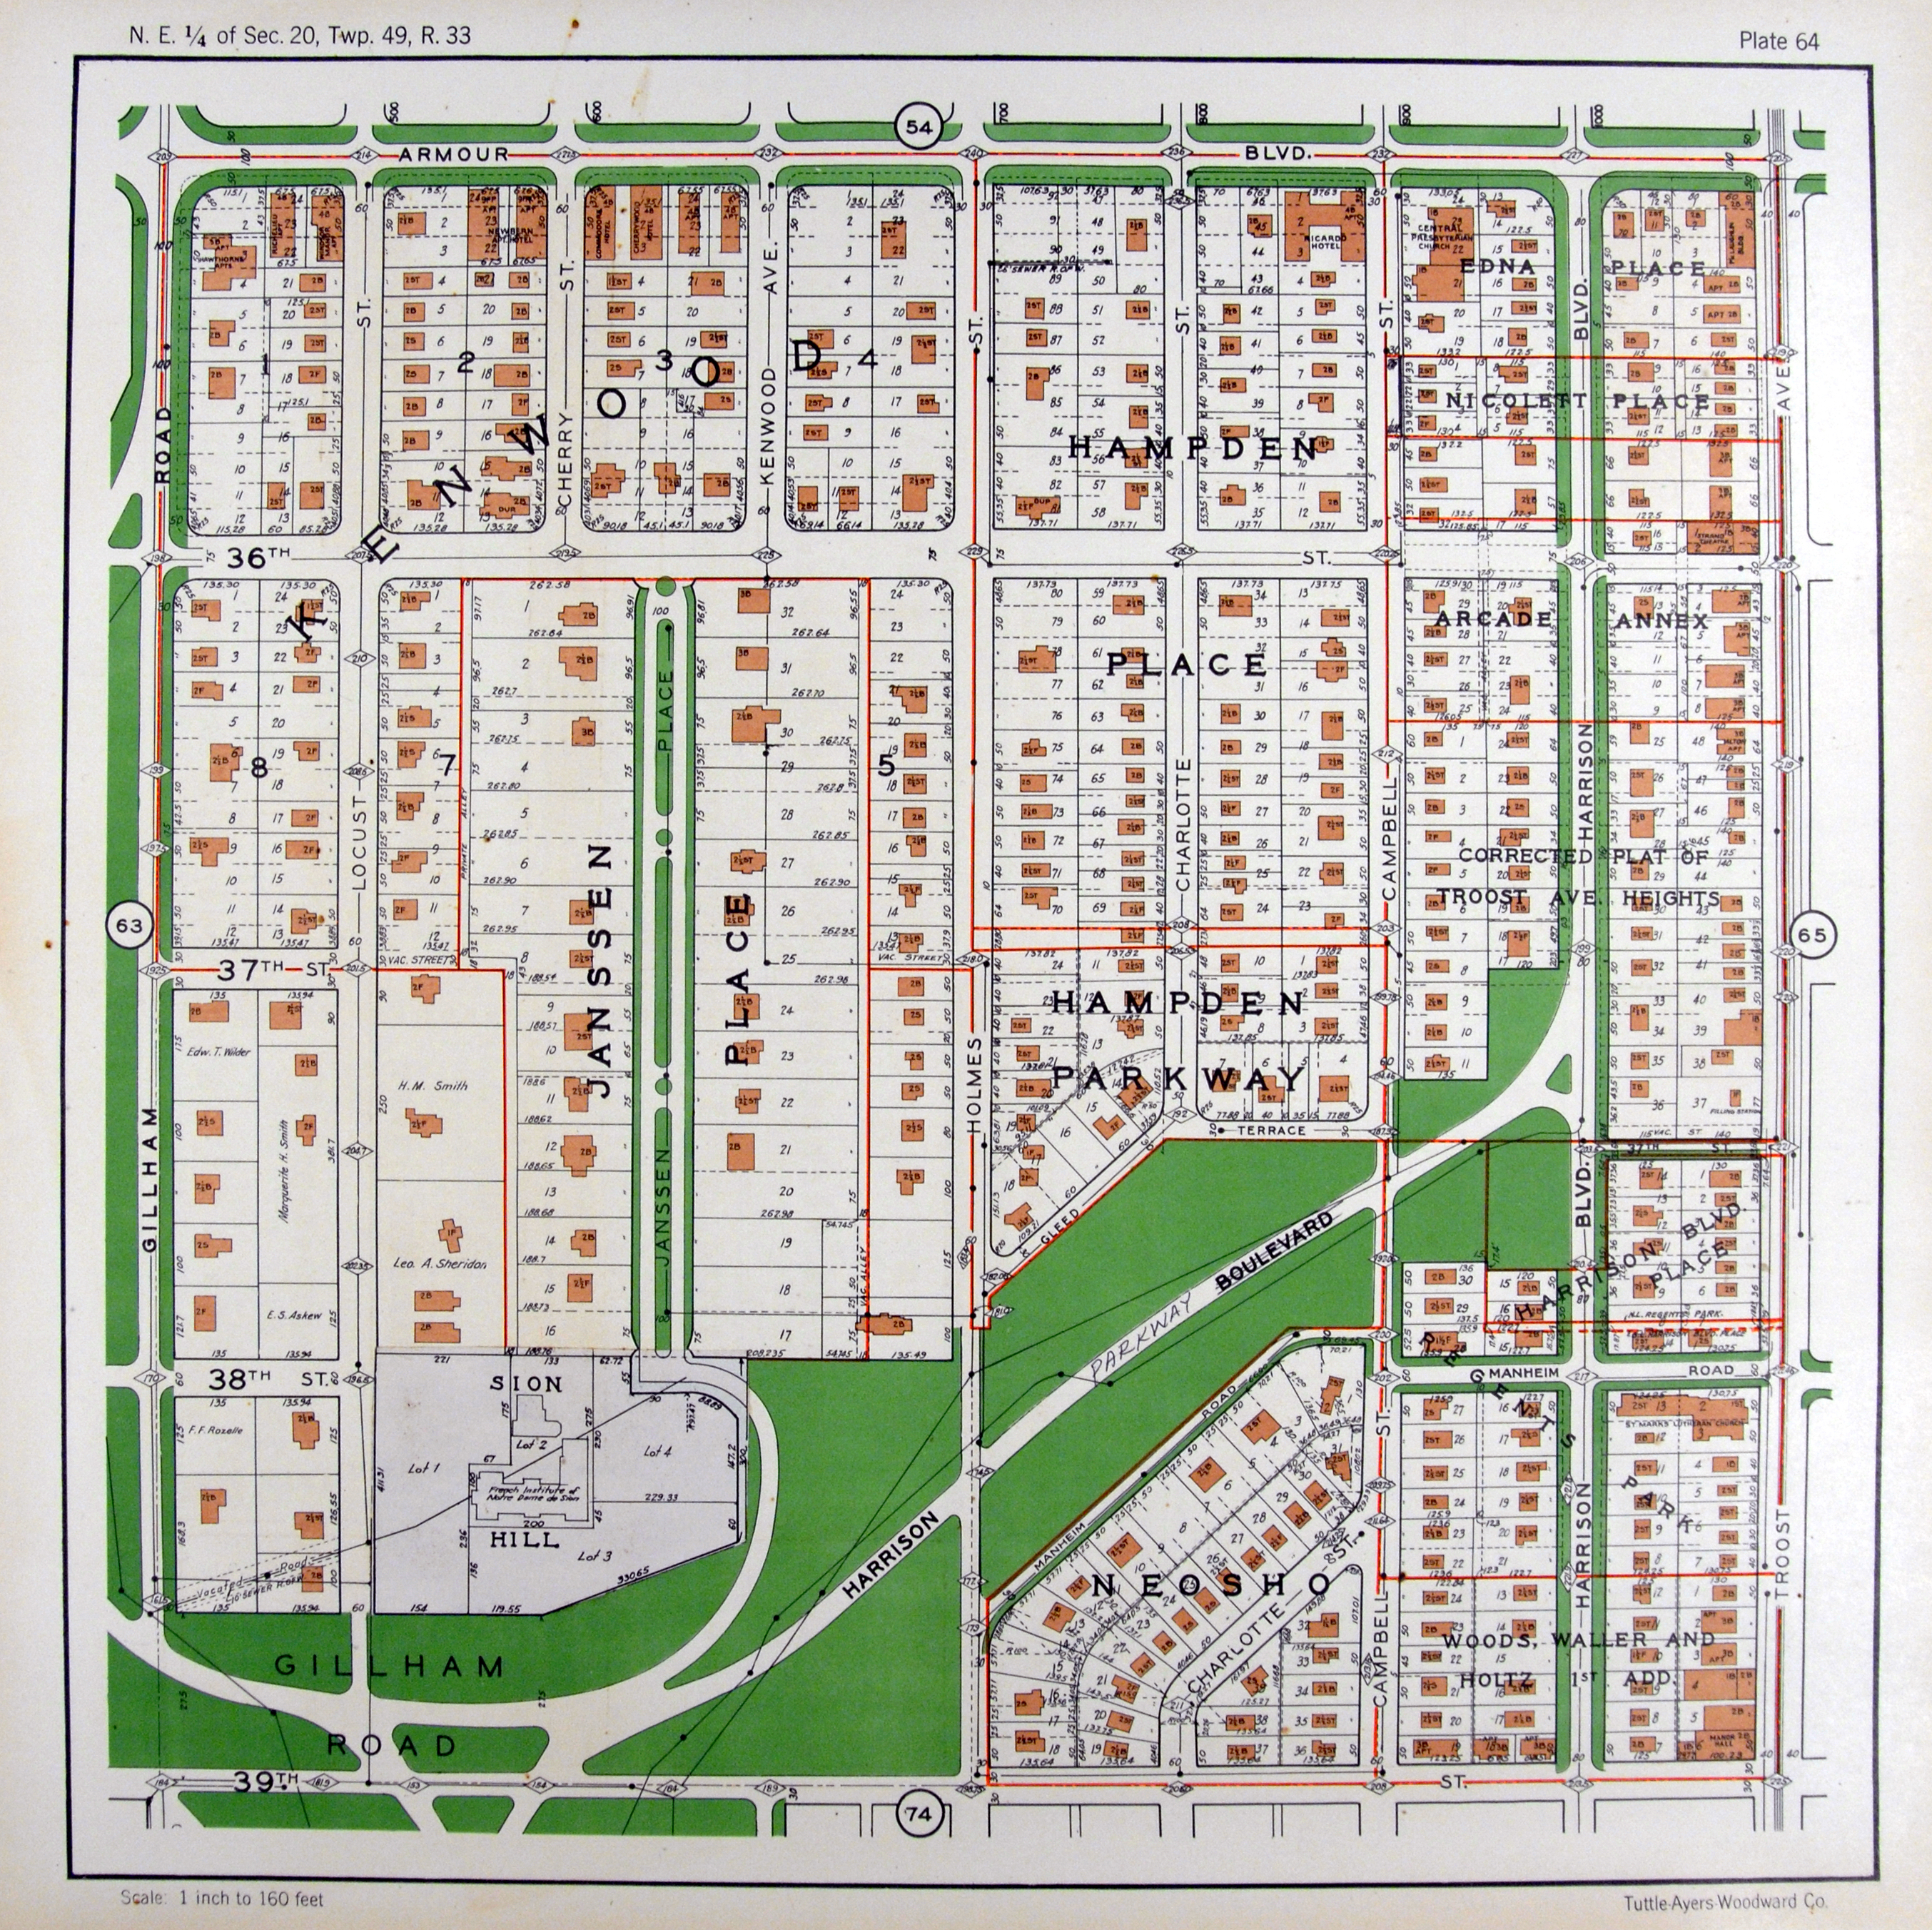
Tuttle, Ayers, Woodward Co. (1925). Atlas of Kansas City Missouri and Environs. Kansas City, MO
The two blocks located at this western tail-end of 35th St. used to be a quaint little neighborhood. The area erected a subdivision in the early 1900’s, a few apartment complexes were built around the twenties and a few more individual homes popped up throughout the years. The neighborhood developed rather quickly initially but over the years the development has regressed. In fact, roughly 40% of the initial development is now vacant land space. The blocks are located right between two busy thoroughfares, Broadway and South West Traffic Way. It serves as a decent shortcut between the major roads but they also appear forgotten or hidden. Four of the six apartment building are still in use today, serving mostly low-income families.

The Paseo and Wayne Ave
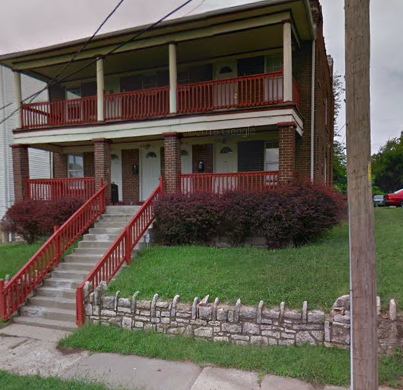
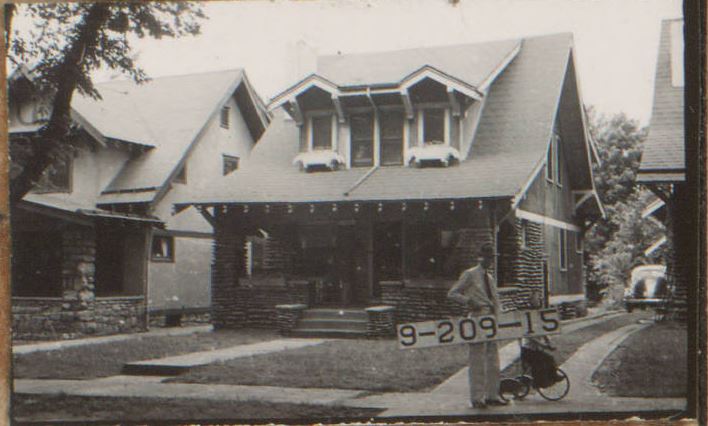
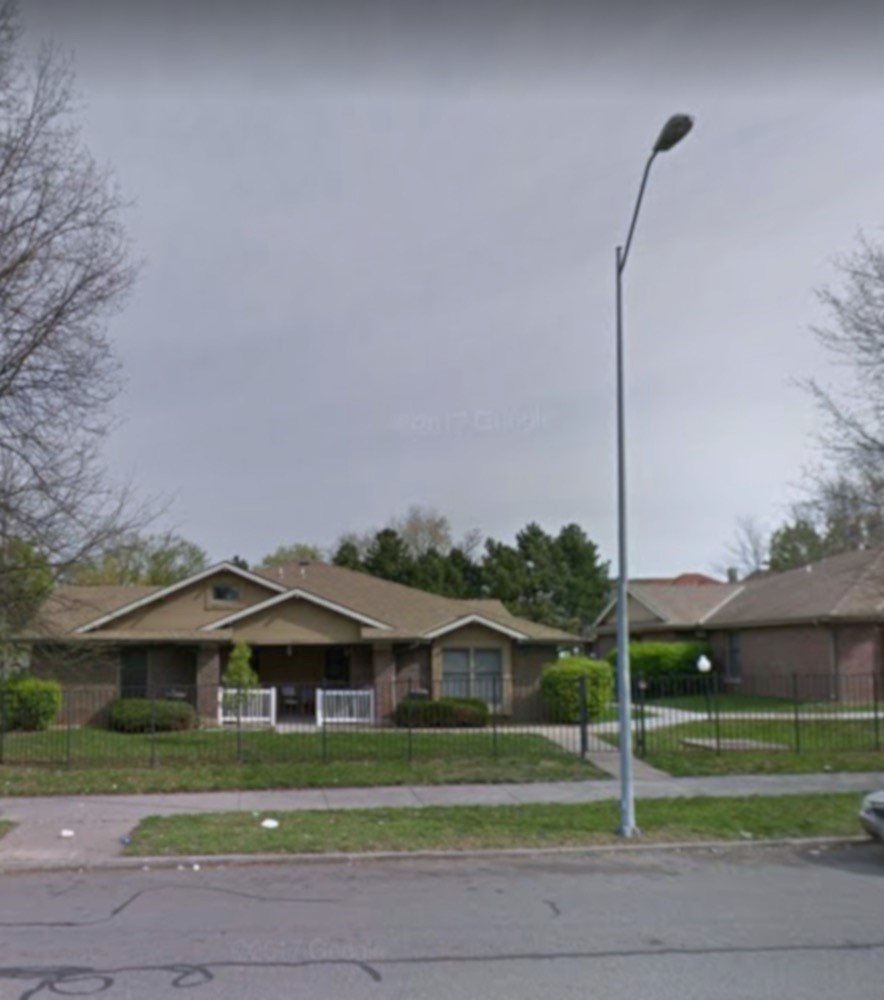
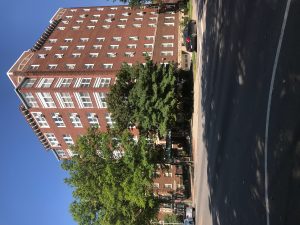
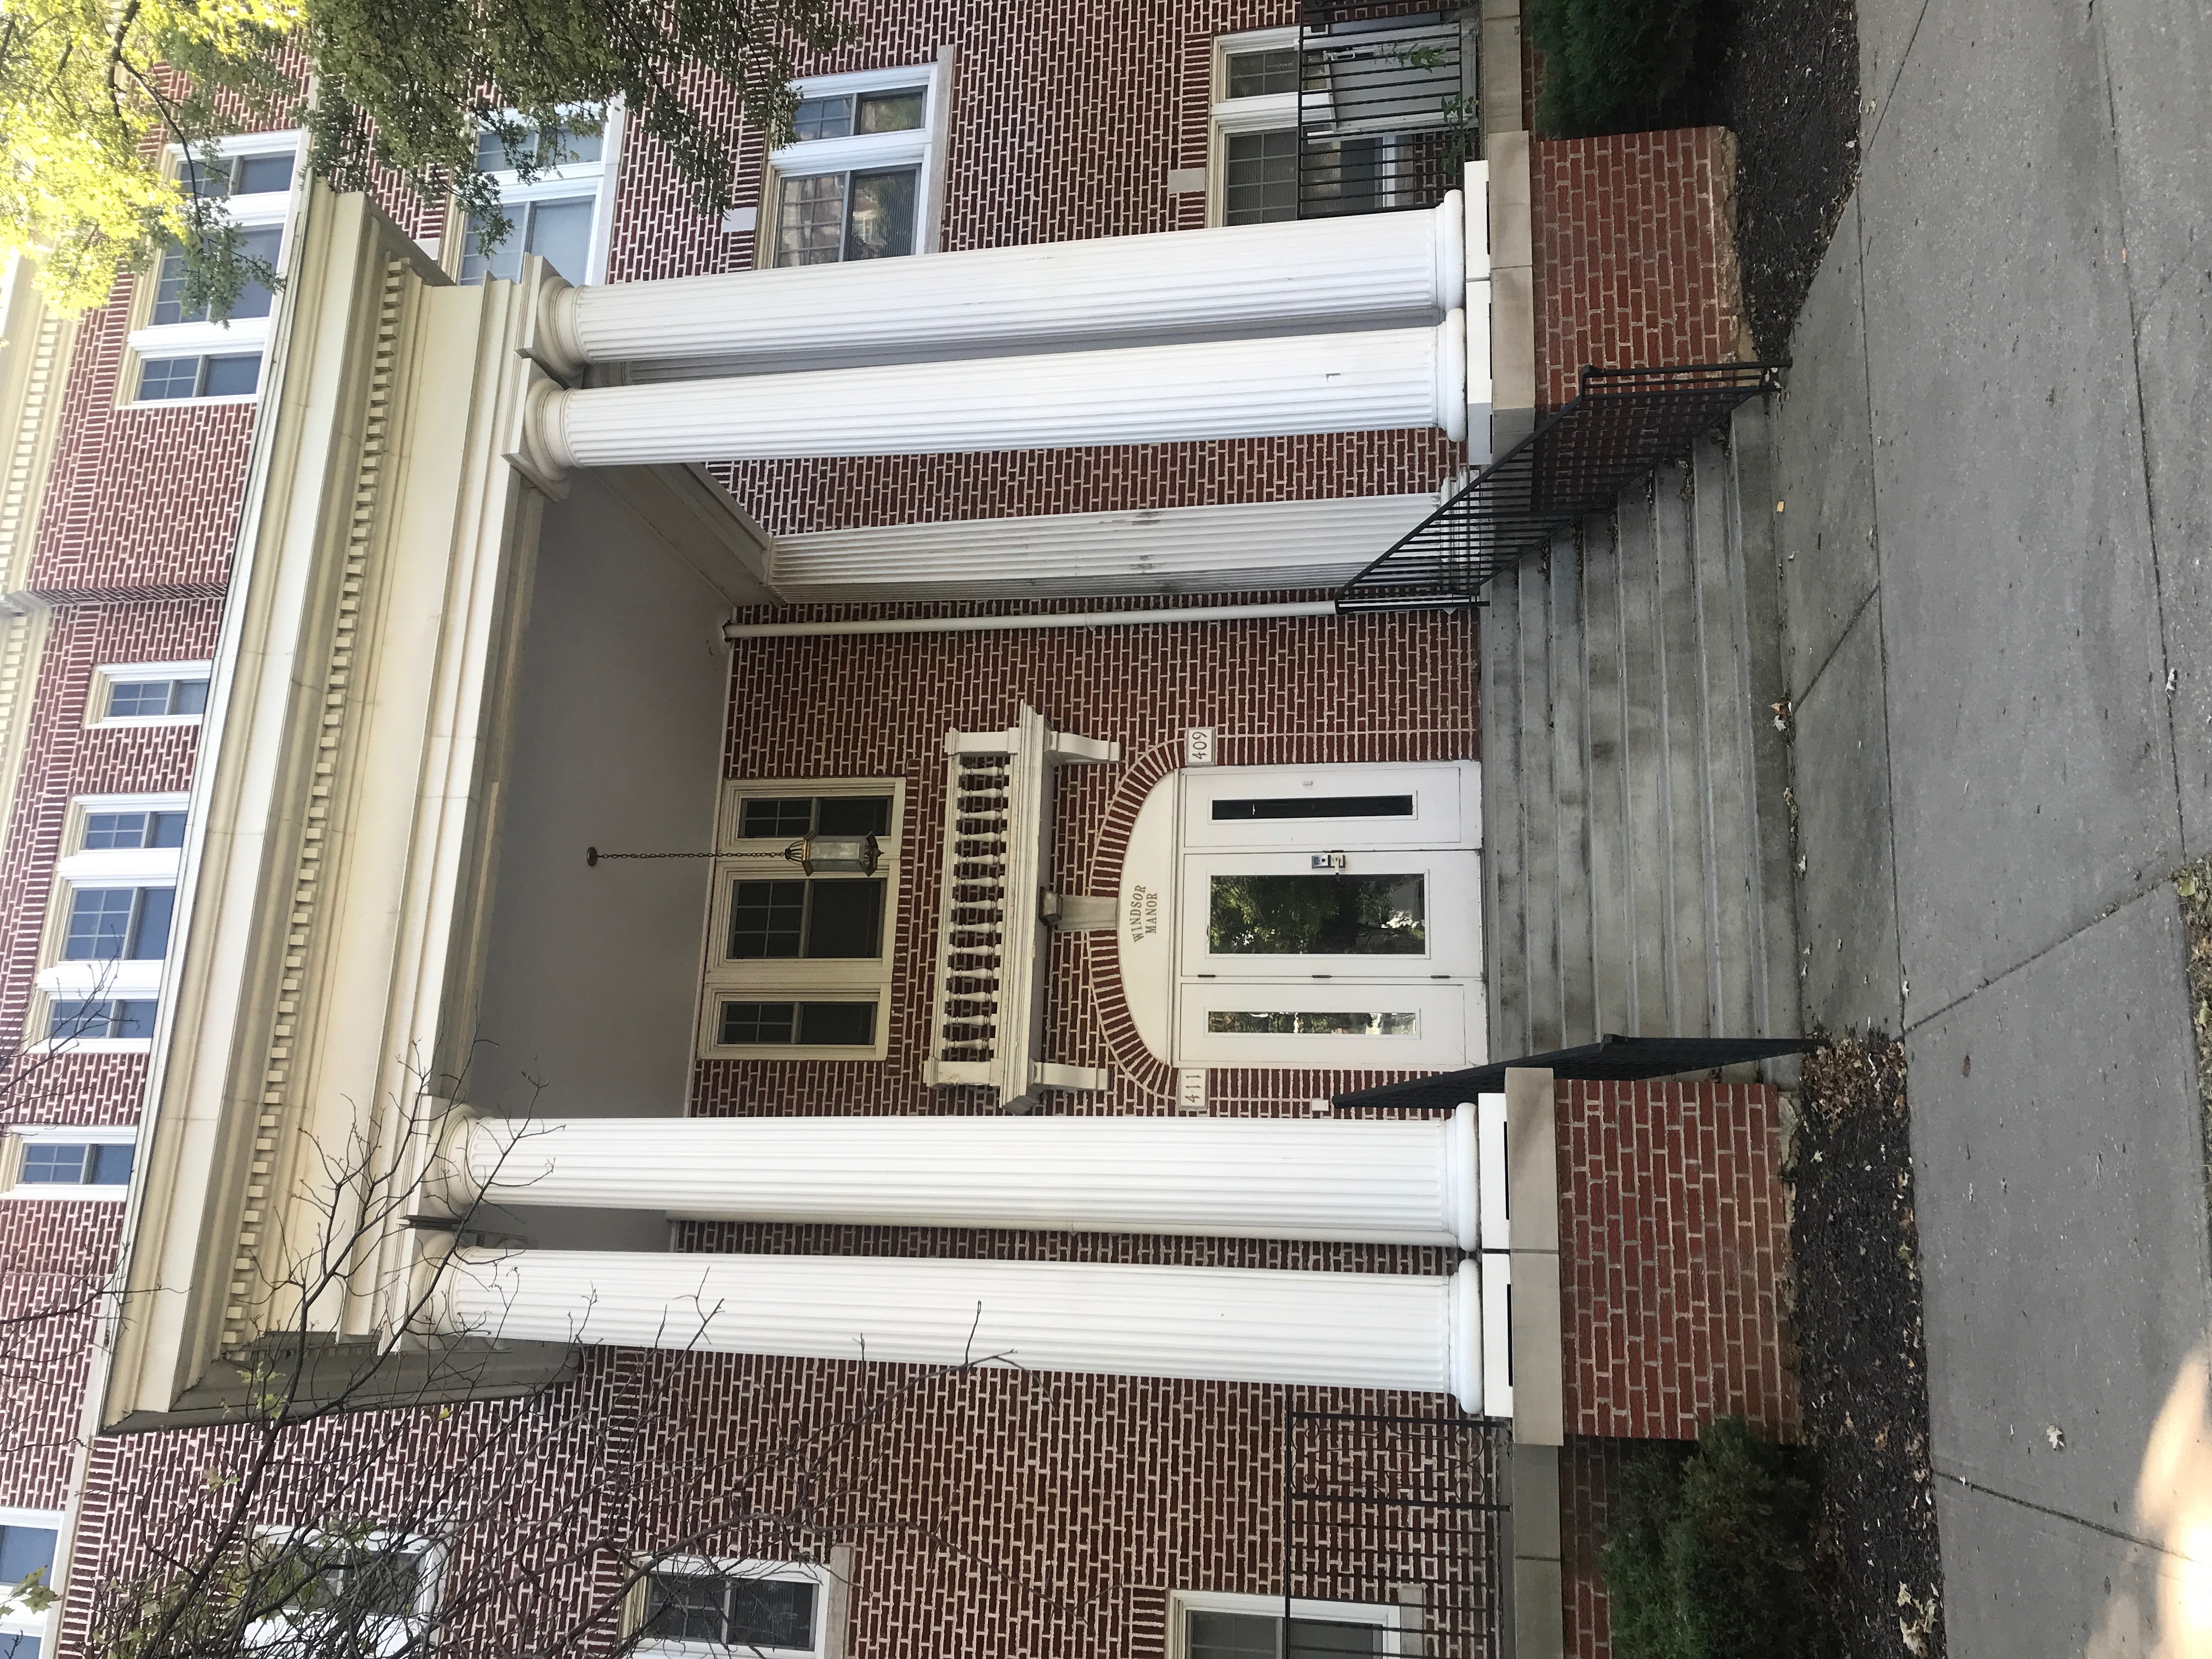
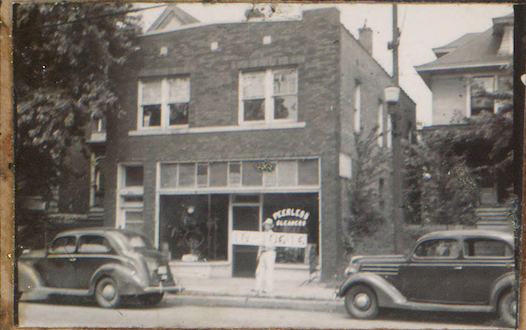
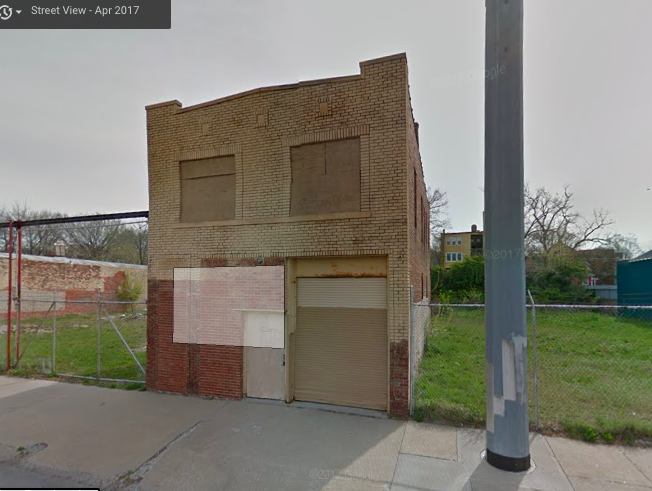
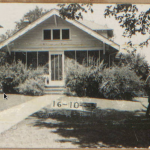
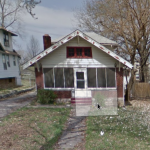
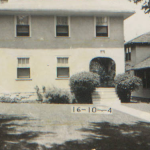
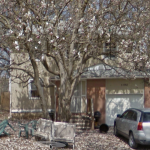
My assigned area was mostly residential. When putting together the according tracts, I noticed an extreme amount of development between the year 1895 and 1909. Between the year of 1950 to 2018, my area as a whole went through a destruction of many of its homes. This is something that was really interesting to me because when you compare these two Sanborn maps you can see how they appear very similar in terms of the amount of developed land and the amount of vacant land. Besides the residential homes, there was also a few apartment buildings. The architectural style of these buildings was that of a colonnade style. This is shown in the pictures below. The photo from the left was from the Kansas City 1940 Tax Assessment Photographs. The photo on the right was from google maps. We are able to see how the home that was located on the right of the apartment building from 1940 was destroyed since it is now present in the 2018 image.
35th Street between Prospect Ave and Olive Street
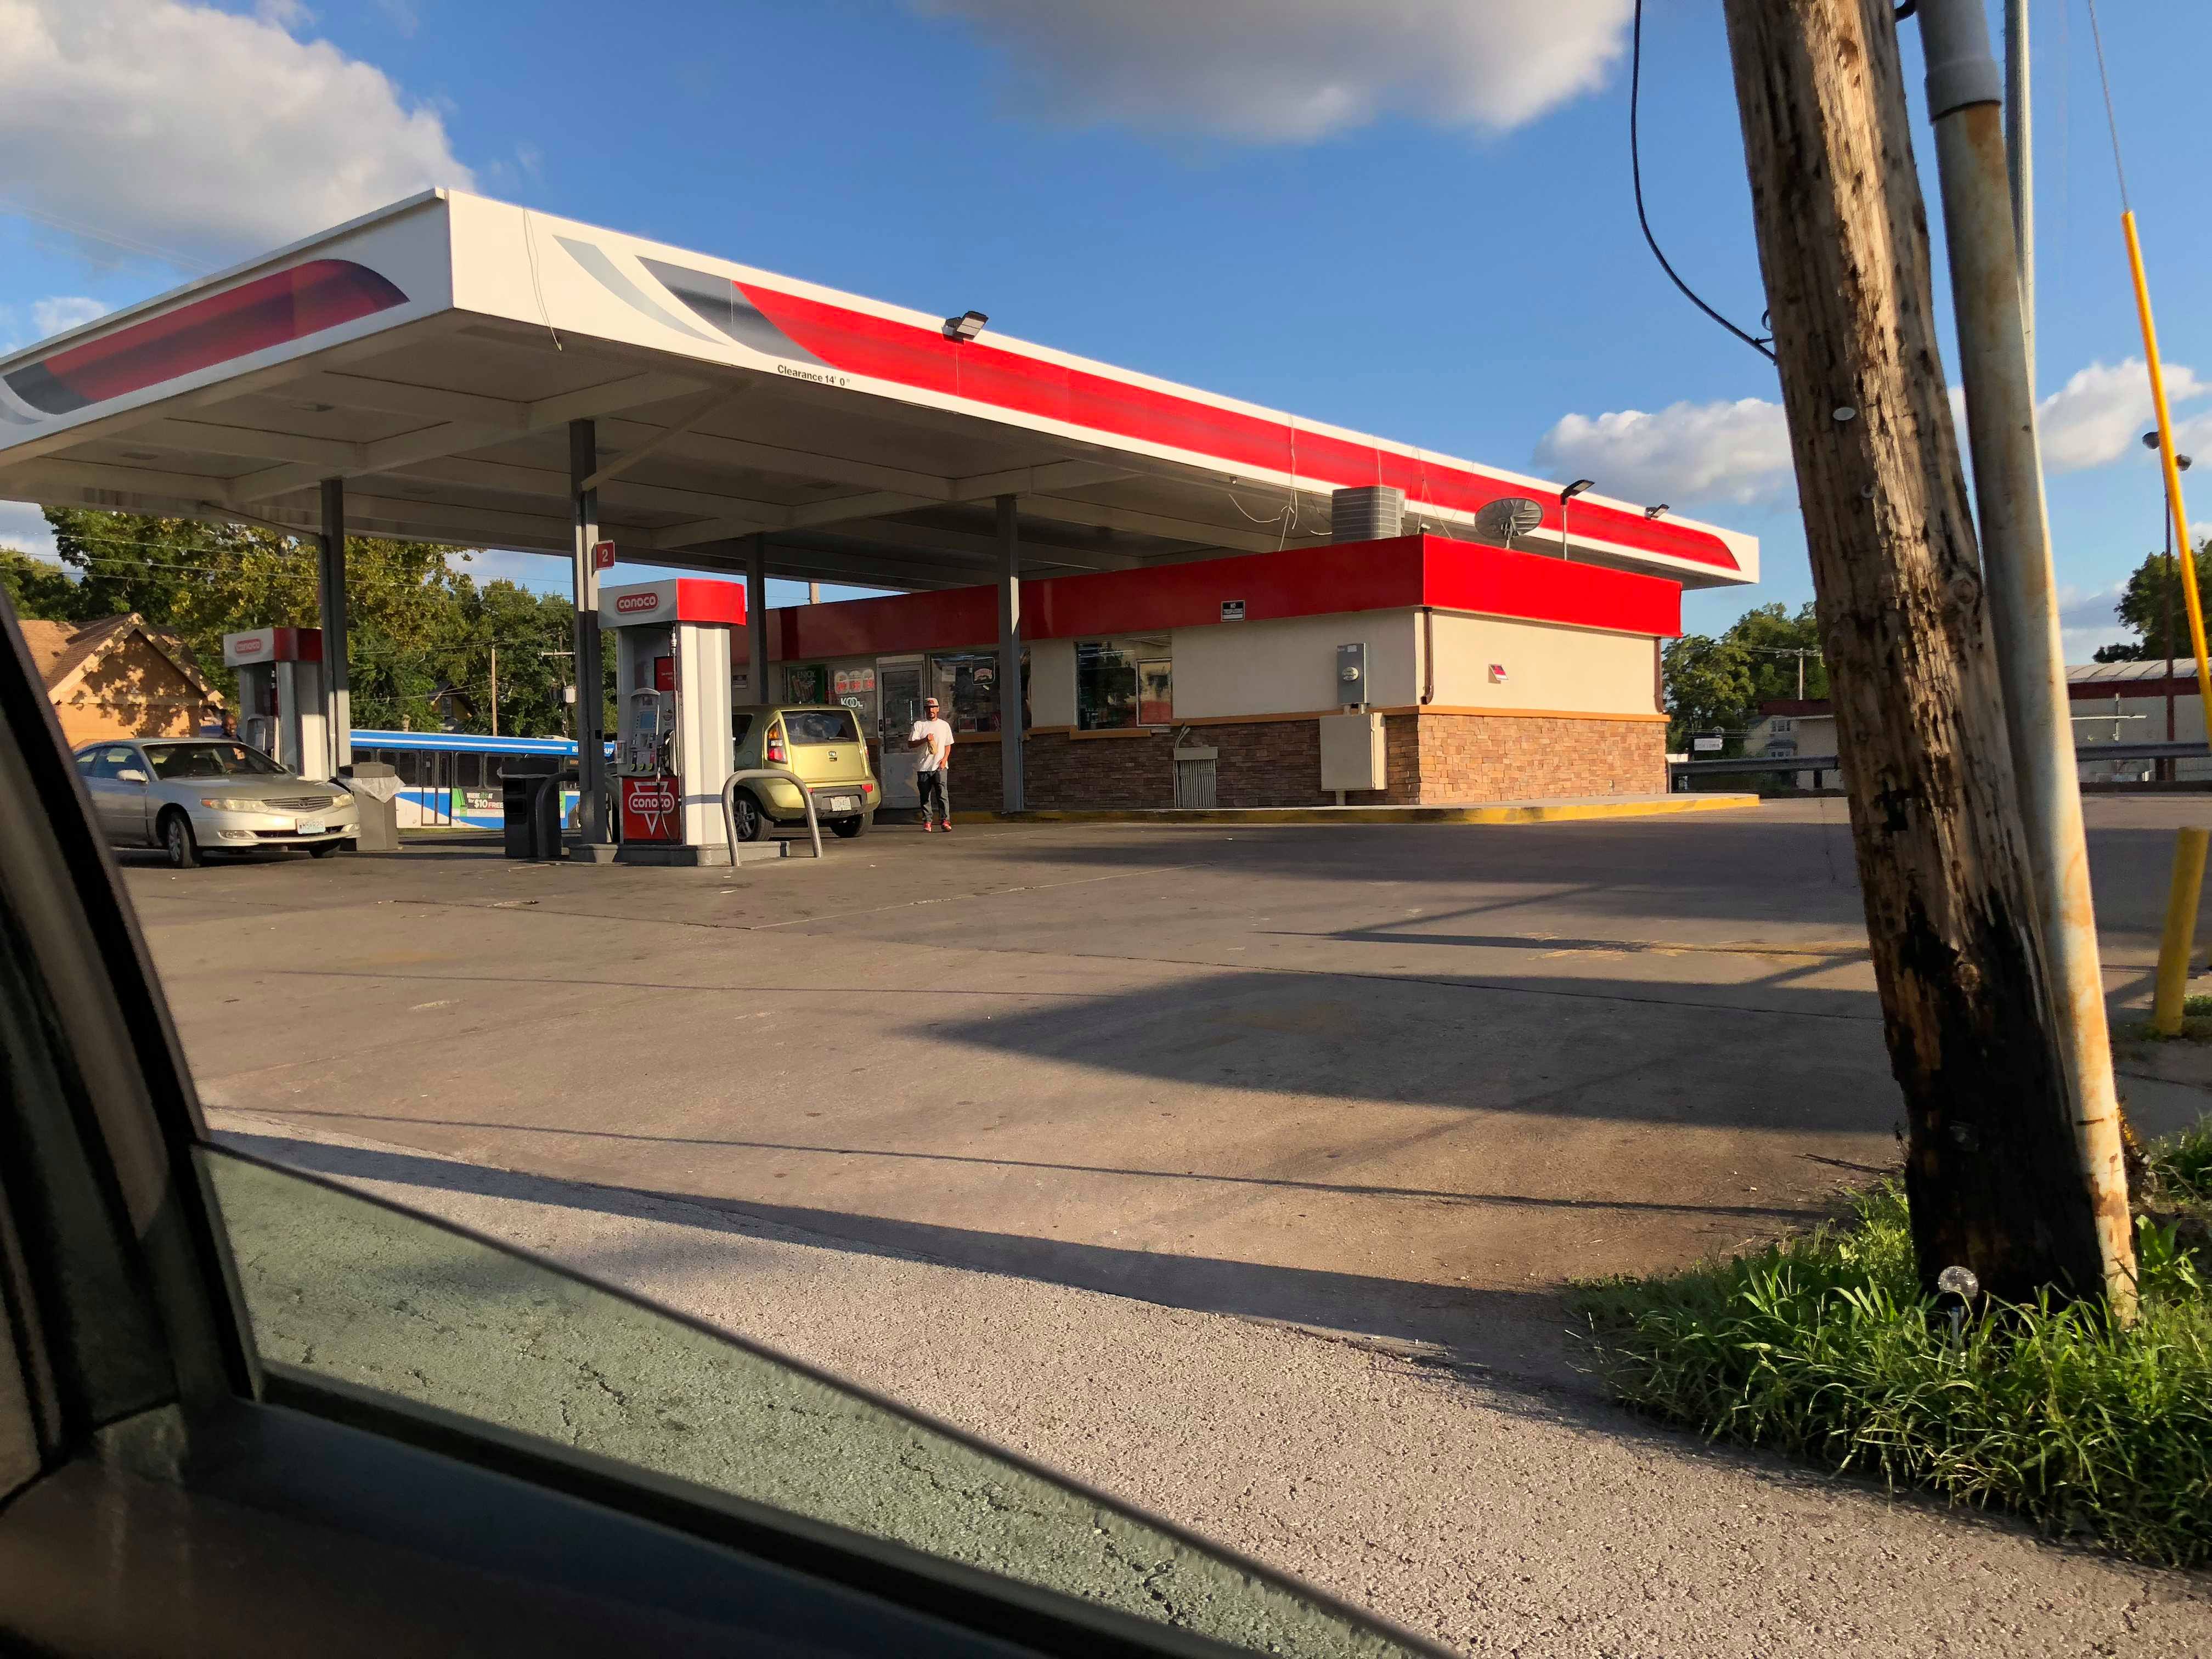
This area is located next to the highway. It includes four blocks and the most of these are houses. There still having an empty land which is opposite to the only gas station. The gas station is located on 3500 Prospect Ave and it’s on the corner of Prospect and 35th St between Prospect and Wabash. This area is a desert area. You can only find out the empty land and house right there. There is some picture of Prospect and Olive on 35th St.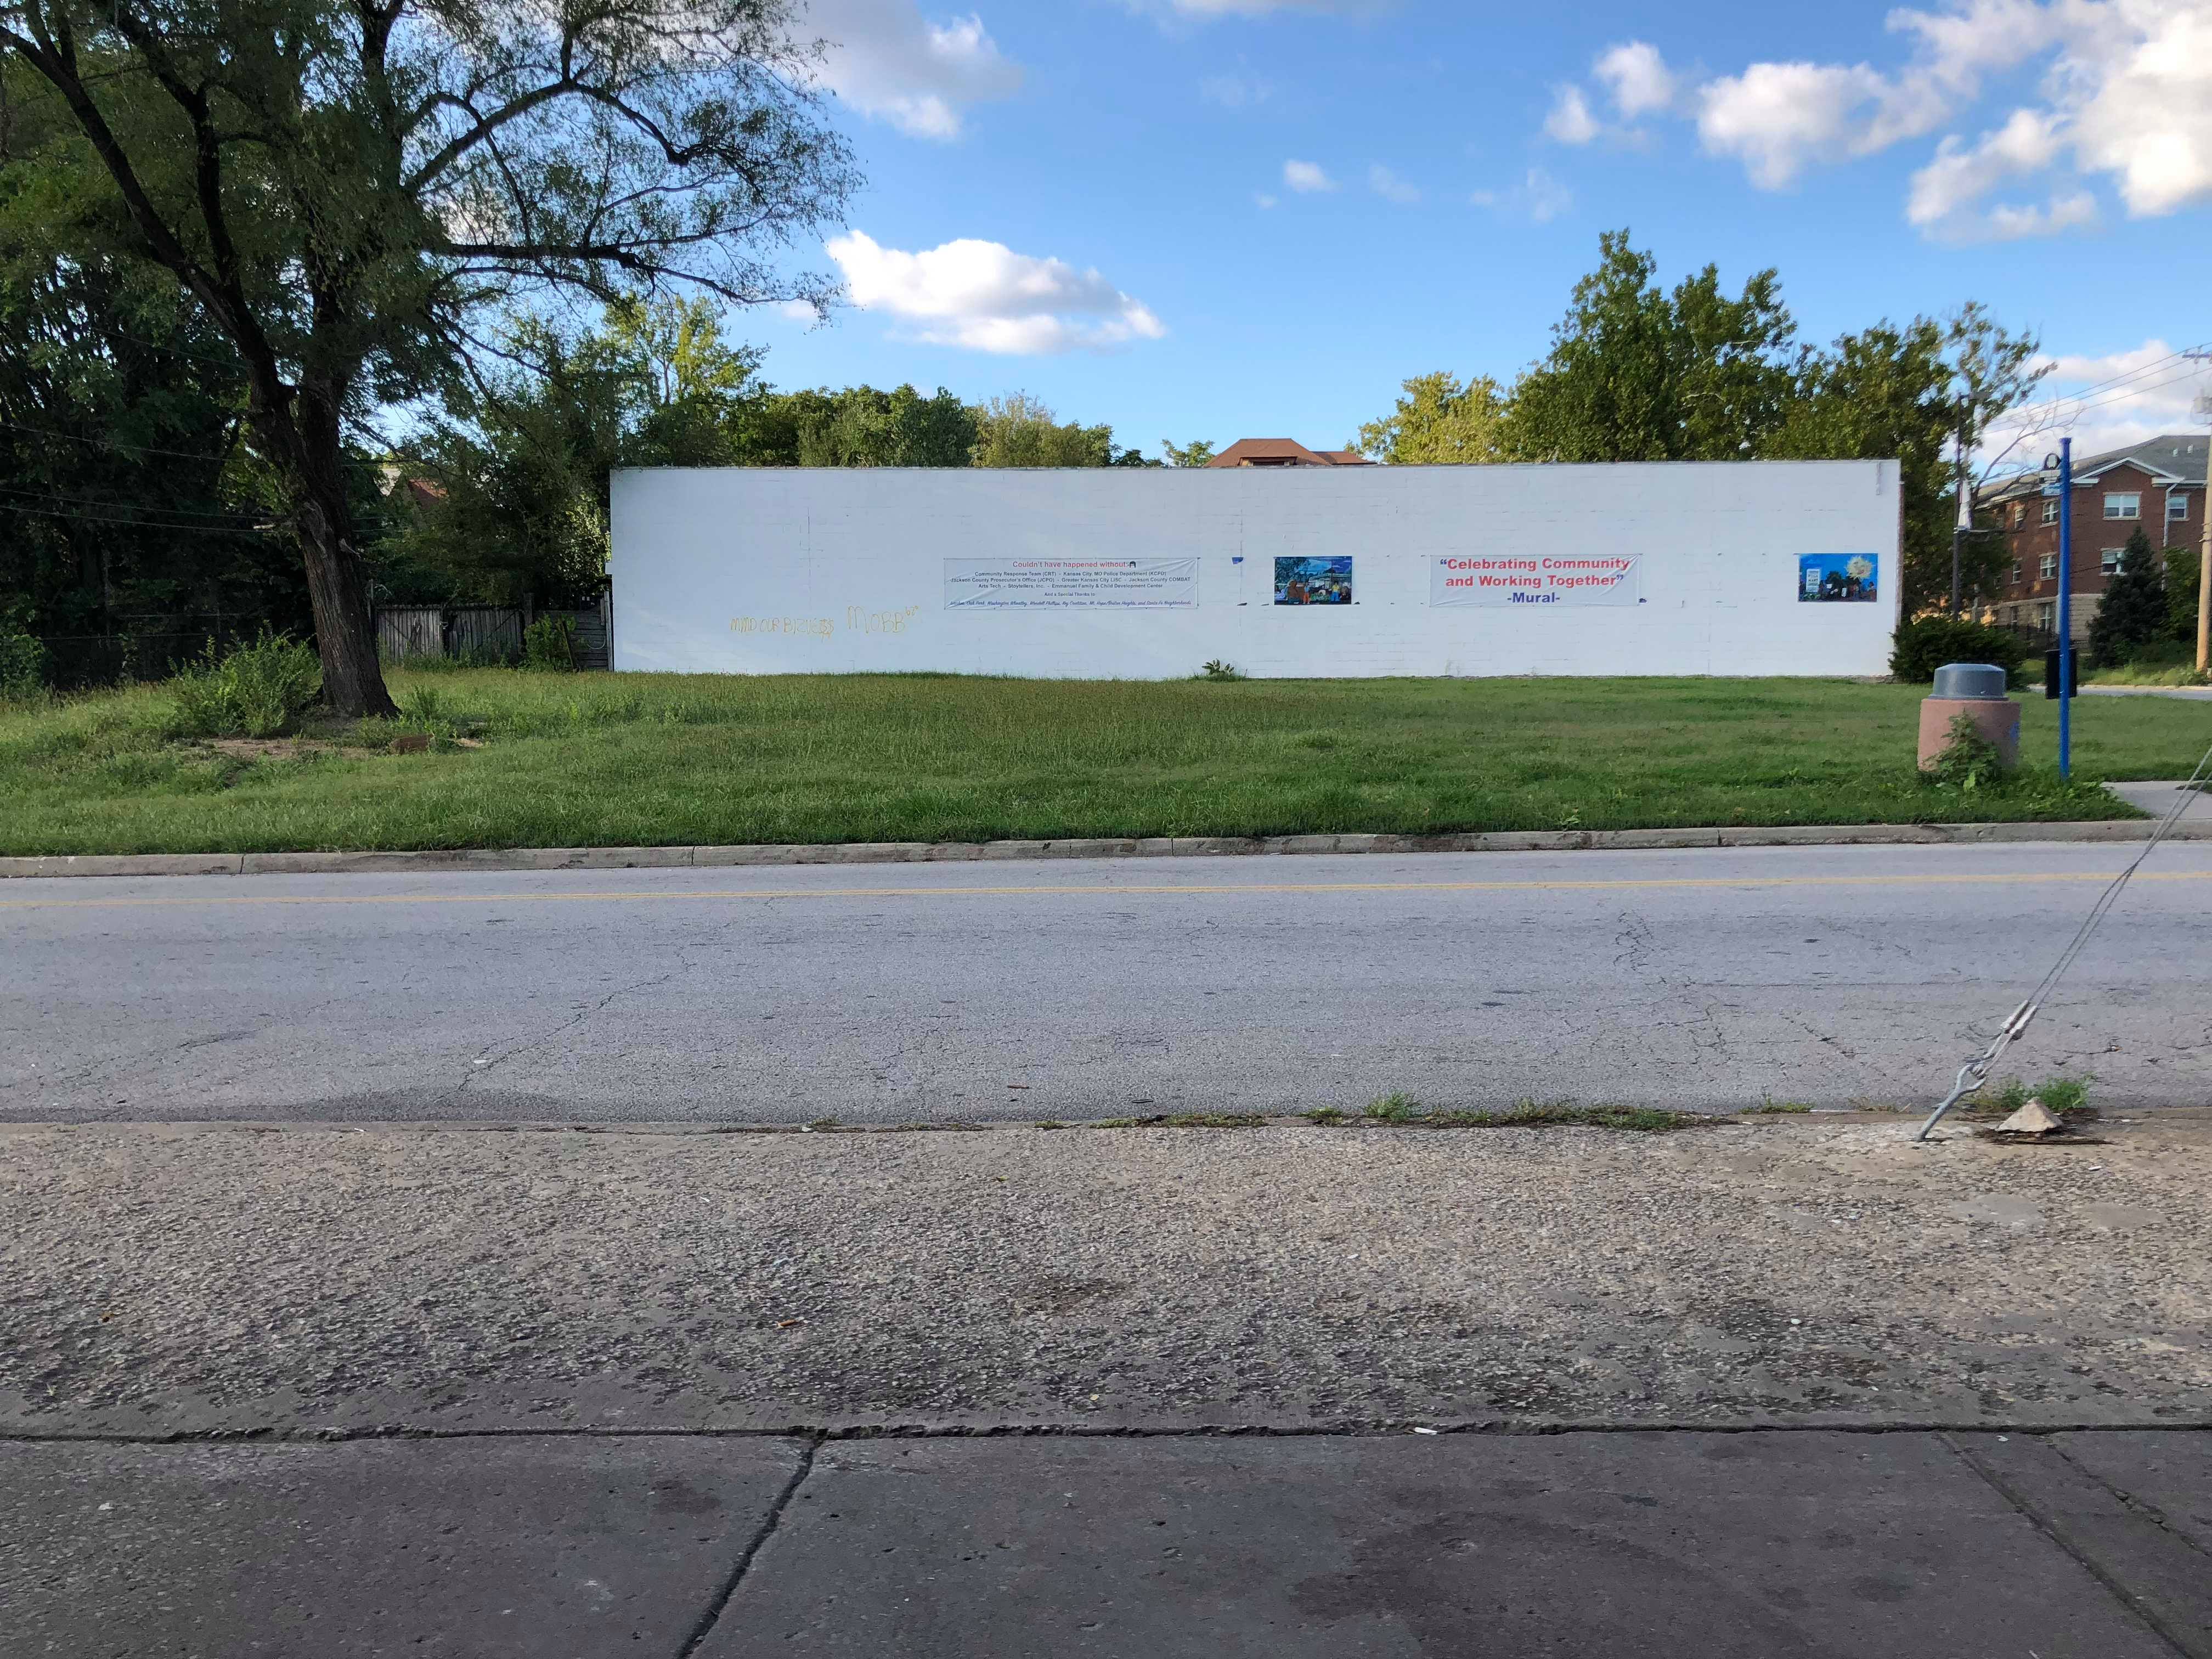

Historical Map Analysis
The assigned area is located within the boundaries of the Palestine East Neighborhood based on data retrieved from Open Data KC. The Palestine East Neighborhood is described as far North as Linwood Blvd, East to Jackson Avenue, as far South as 39th St. and West to Cleveland Ave. The built environment within the assigned area consists primarily of single-family residential structures. There are no multi-family residential structures located within the assigned boundaries.
According to the City of Kansas City Parcel Viewer, most of the residential structures were built in the early 1920’s. The approximate building area of the residential dwellings inside the designated boundary range between 800 and 1100 square feet. Residential is the dominant land use type. The built residential structures are in close proximity of one another. Dwellings face 35th St. on the North and South side of the street and are set back providing frontage for green space. Most residential structures have green space in the rear of dwellings as a buffer between residential structures on side streets.
Social explorer revealed some statistical information. The designated area was in census track 57. Listed below are some the statistics retrieved from that source.
- Population 1950: 3,935
- Population 2016: 2,164
- Owner occupied housing 1950: 1248/1261
- Owner occupied housing 2016: 482/842
- Race: 1950 – 100% Non-Black
2016 – 89% Black
In conclusion I did not find a lot of statistical information prior to the year 1960. The area upon observation is neighborhood oriented. The people I encountered during my walk through were friendly and helpful. In my opinion the area could use an alternate option for small food items, hot meals, and fresh fruits and vegetables. The roadways were well paved, and signage was visible on all side streets in the designated area. Due to low traffic both by pedestrian and vehicles the area was seemingly tranquil.
35th Street: Benton Blvd to Indiana Ave
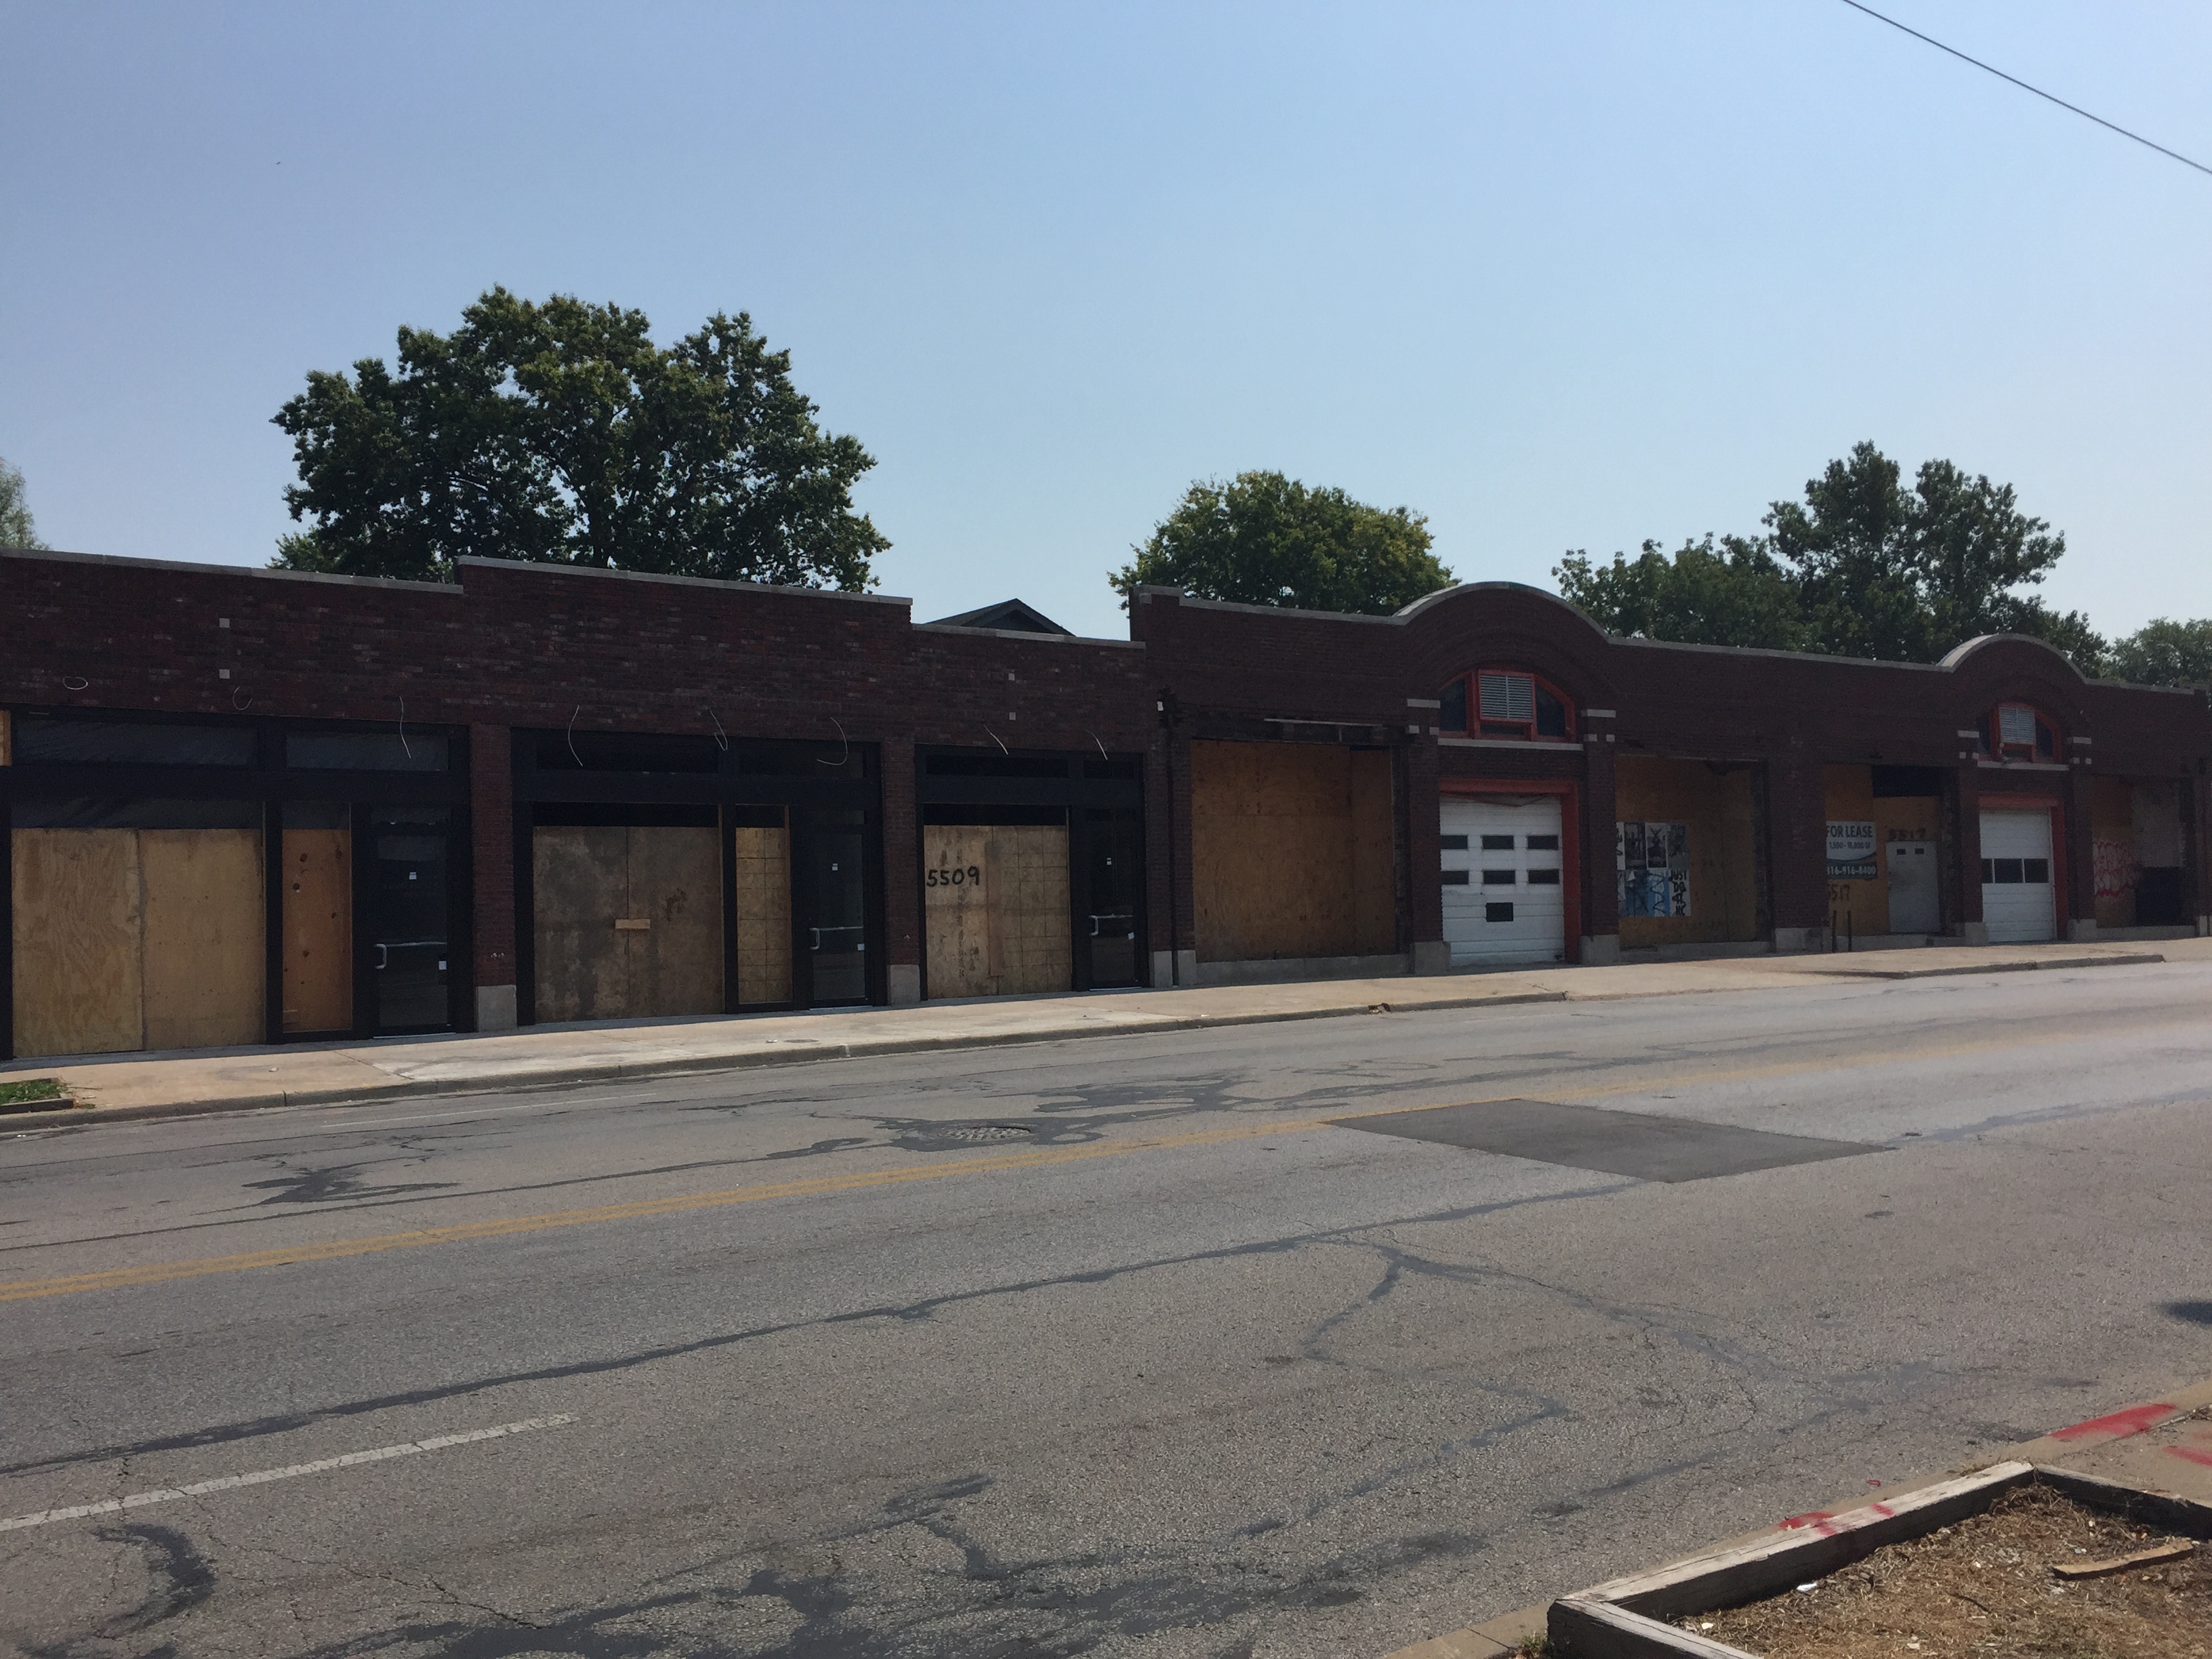
Armour Boulevard runs east from Broadway Boulevard lined by old, stately apartment hotels to eventually become 35th Street at The Paseo where it then continues to run east to the city limits lined by ever younger single family homes. My assignment was to study a couple of the blocks along 35th St. between Benton Boulevard to Indiana Avenue. These blocks have seen a rise from undeveloped farm land to a strong and stable neighborhood, yet they have also seen a decline into a dis-invested and high crime state; a common tale of many neighborhoods across this city. These particular blocks of 35th Street are characterized by the early 1900s single family homes that line its streets. It is also characterized by a skeleton of what used to be a thriving neighborhood retail center at the intersection of Indiana Ave. and 35th St. As this area stands seemingly locked at a low point of decline, only one and a half miles west along the same stretch of road neighborhoods ache with the pains of “gentrification” while their nearby neighbors to the east ache with the pains of houses being shot up. An interesting and stark contrast to close on between these nearby eastern and western neighbors.
Brooklyn and Olive
With an area that showed no promise and not so much activity with only the learning center being major thing on my block. Their was some really interesting changes that occurred in the past. One of the changes that I found interesting is that where the learning center use to be there was only one large complex through out the time. Right across the street where a small parking lot was use to be a bus station and a cosmetic/drug store. The north side of Brooklyn street where their was two houses in very poor condition half of that block use to be one big green house and the other half use to be covered in houses. Being able to go and check out my location and seeing how it went from not really having any activity to having a lot of activity happening in the past.
Wyandotte to Main
This block of Armour Boulevard was developed fairly early on. Many apartment buildings and single-family homes that lined the streets from the early 1900s are still there today, as Mac Properties has bought most of the lots and has been working to restore them. While most structures have stayed the same, the large mansion on the corner of Armour and Main was demolished some time between 1925 and 1950, and the lot is now home to a large US Bank, and the large Colonnade building that boasted a big front lawn was demolished in the 1970s to make way for the American Red Cross building on the corner of Wyandotte and Armour. I’m sure as time goes on and these historic buildings continue to age, Armour Boulevard will change once again. 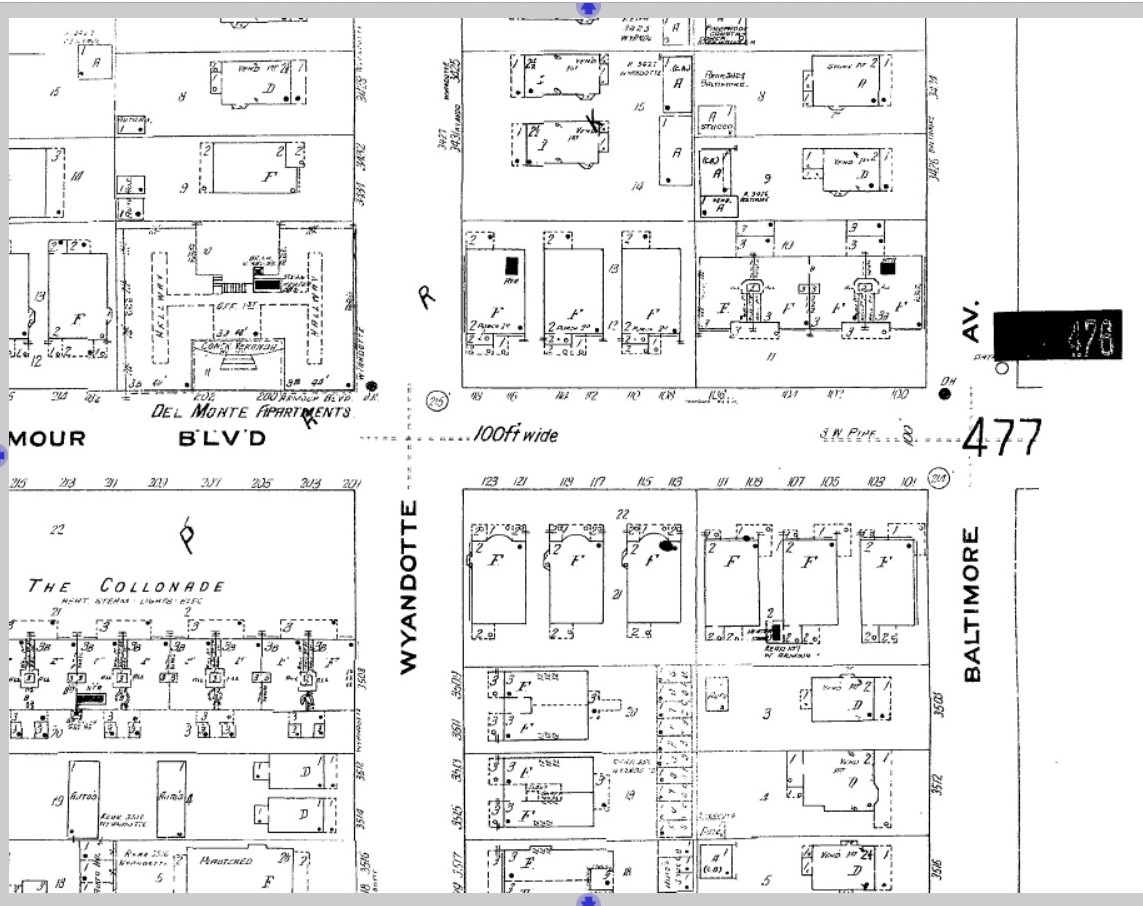
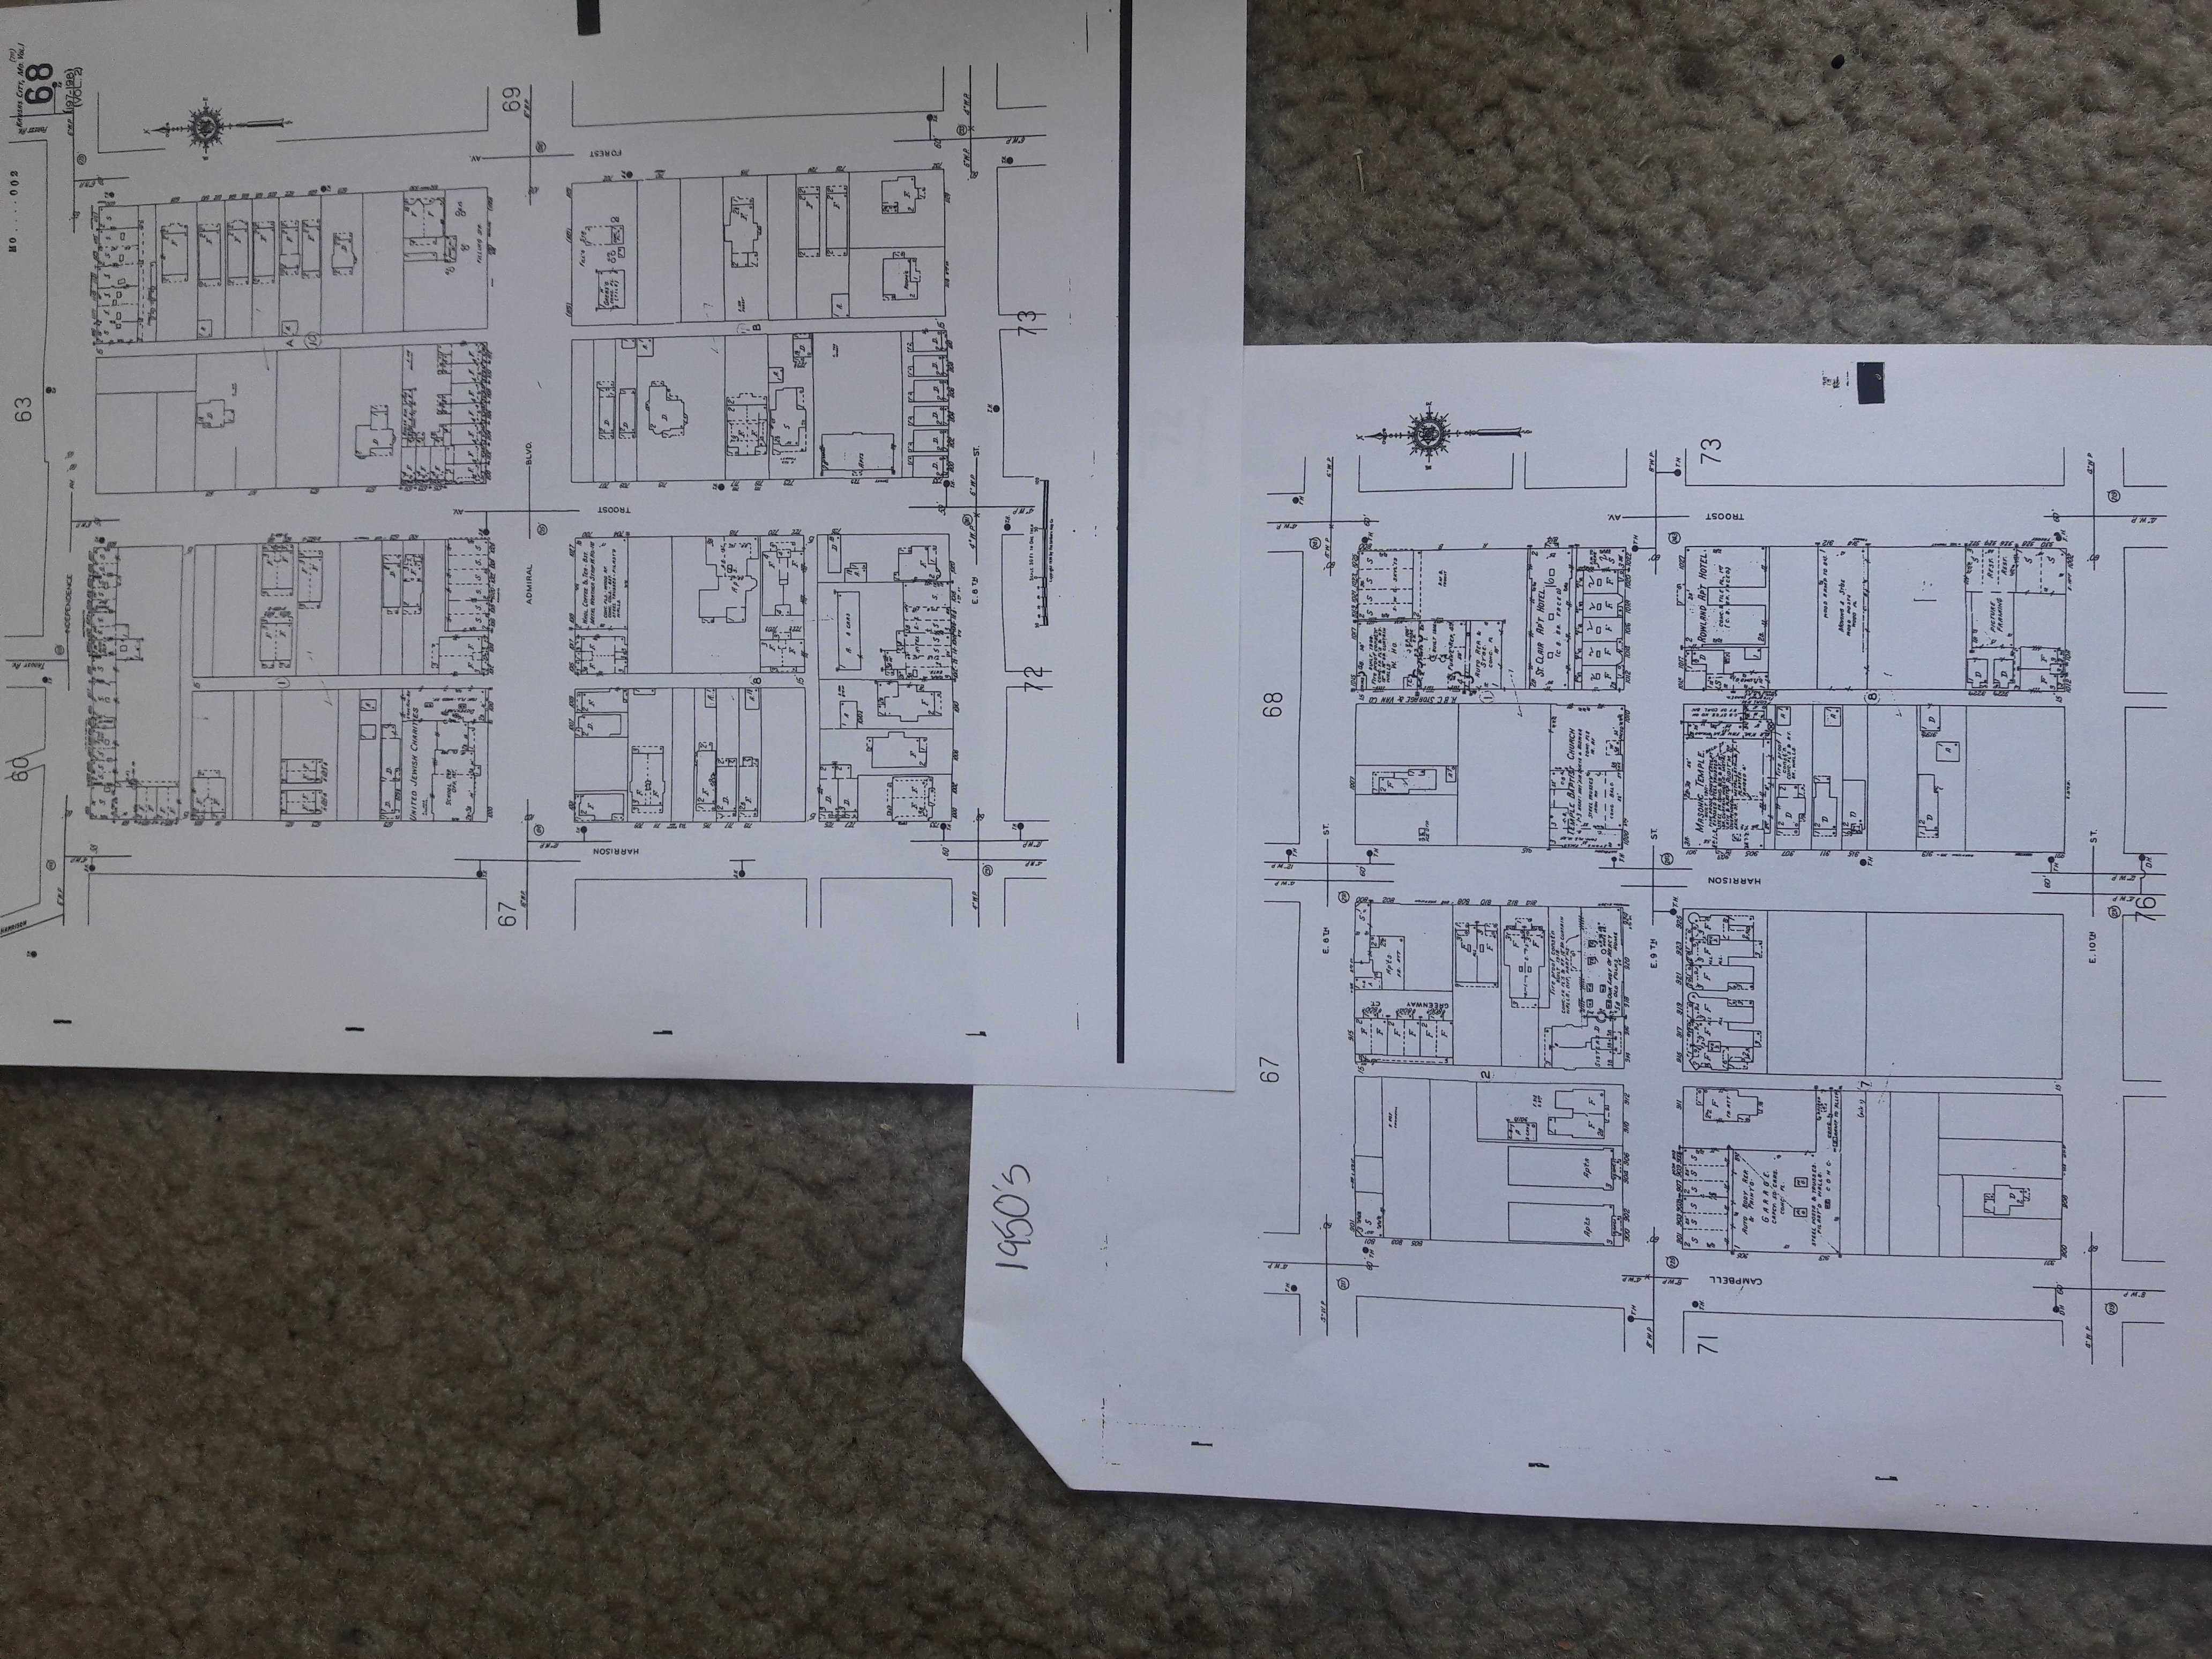
Forest to Harrison
This stretch of Armour Boulevard between Forest Avenue and Harrison Boulevard appears mostly empty, but still feels lively. Everywhere you turn, there is a building or a lot that once contained a building, that was a source of hustle and bustle from the 1920s through to the 1950s. During those years, the busy Troost Line streetcar was ridden every day, and many large brick and stone buildings stood as apartments or drugstores. Nearly all of them have been demolished and leave only their grassy footprint behind as a reminder. Mac Properties, The Planned Industrial Expansion Authority of Kansas City, or Armour and Troost LLC own most of the property in this two block stretch. Along the four corners facing inward toward Troost Avenue, plans have been made to erect large mixed use buildings in the future, which will contain about 300 apartment housing units and 25,000 square feet of retail space. Although this area looks empty, it is only sleeping for now! Stay tuned!

35th between Wayne and Woodland
This portion of 35th was quite modest. It began as a suburban real estate development in the late 1800s called Boston Heights, and steadily grew to house quite a few single family homes and a small amount of commercial sites by 1917. There was a large shift for higher density residential housing in the area as the size of the city grew. By 1925, six apartment buildings were built on an open parcel of land and several single family homes were replaced by two family flats.
The middle of the 20th century ushered in the rapid decline in density that is still seen in the area today. After spending some time on that street speaking with a resident of 35th, it seems that there’s progress being made in the area led by members of the community. I have a great deal of hope for them, and am interested in seeing what the future holds for the area. 
35th Street: Indiana Ave to Askew Ave
Between these two streets, there was not a lot of information left on them, even going so far as to not being on any Sanborn maps from 1909 or earlier, but from 1925 to 1957, Kansas City made developments in leaps and bounds. 35th Street was no exception as far as moving further along in the future goes. Based on the Sanborn maps from 1957, one can see that where there used to be the Gosnell Place, they put in a filling station, which was a major advancement for the neighborhood compared to the lack of resources and stores they had before. However, it doesn’t seem like the Sarah A. Bower place has changed at all, which is understandable in the era of 30-year mortgages and loans becoming normalized. Families were able to stay in one place for longer periods of time, thanks to having vehicles, public transportation, and higher paying jobs. These all led to an economy that could start regrowing and making these houses into homes for generations to come.
Between Campbell & Troost – Taylor C.
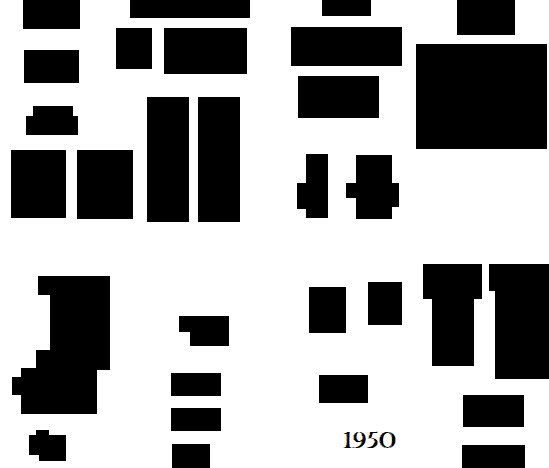
Below are three different figure ground diagrams I constructed based on maps from the years 1925, 1950, and today. One especially noteworthy thing that can be found in these is that of growth and decay.
In the early 1920s there was a swell of development, with the construction of the Bainbridge Apartments, Murray Apartments, and Central Presbyterian Church. Although the Murray Apartments were gone by 1950, the large silhouettes of the Bainbridge and Central Presbyterian are still found on the 2018 map.
Most commercial structures do not last to this day, and those that are still present at the intersection of Armour & Troost and due to make way for a $78 million investment from MAC Properties. The Chicago based Real-Estate firm wants to build up the corners of the intersection to house mixed-use space, which might provide a redemption for this area.
Optimistically, the area will have much more built space soon, but realistically, many of the gleaming buildings of the 1920s during this neighborhood’s height will never be rebuilt.


35th between Cyprus Ave and Chelsea Dr
The two blocks along 35th St. between Cypress Avenue and Chelsea Drive marked a fairly unremarkable and extremely underdeveloped portion of Kansas City, MO. The majority of the structures built along this stretch were mainly residential in nature excluding the one small Baptist Church and the parking lot for the VA hospital. The most interesting find that helped me to better understand how, why, and when this area developed was discovering that 35th St. between Cypress Avenue and Chelsea Drive was not officially annexed into the Kansas City, MO city limits until 1909. Built structures weren’t substantial enough to document until well after these new city limits were drawn.

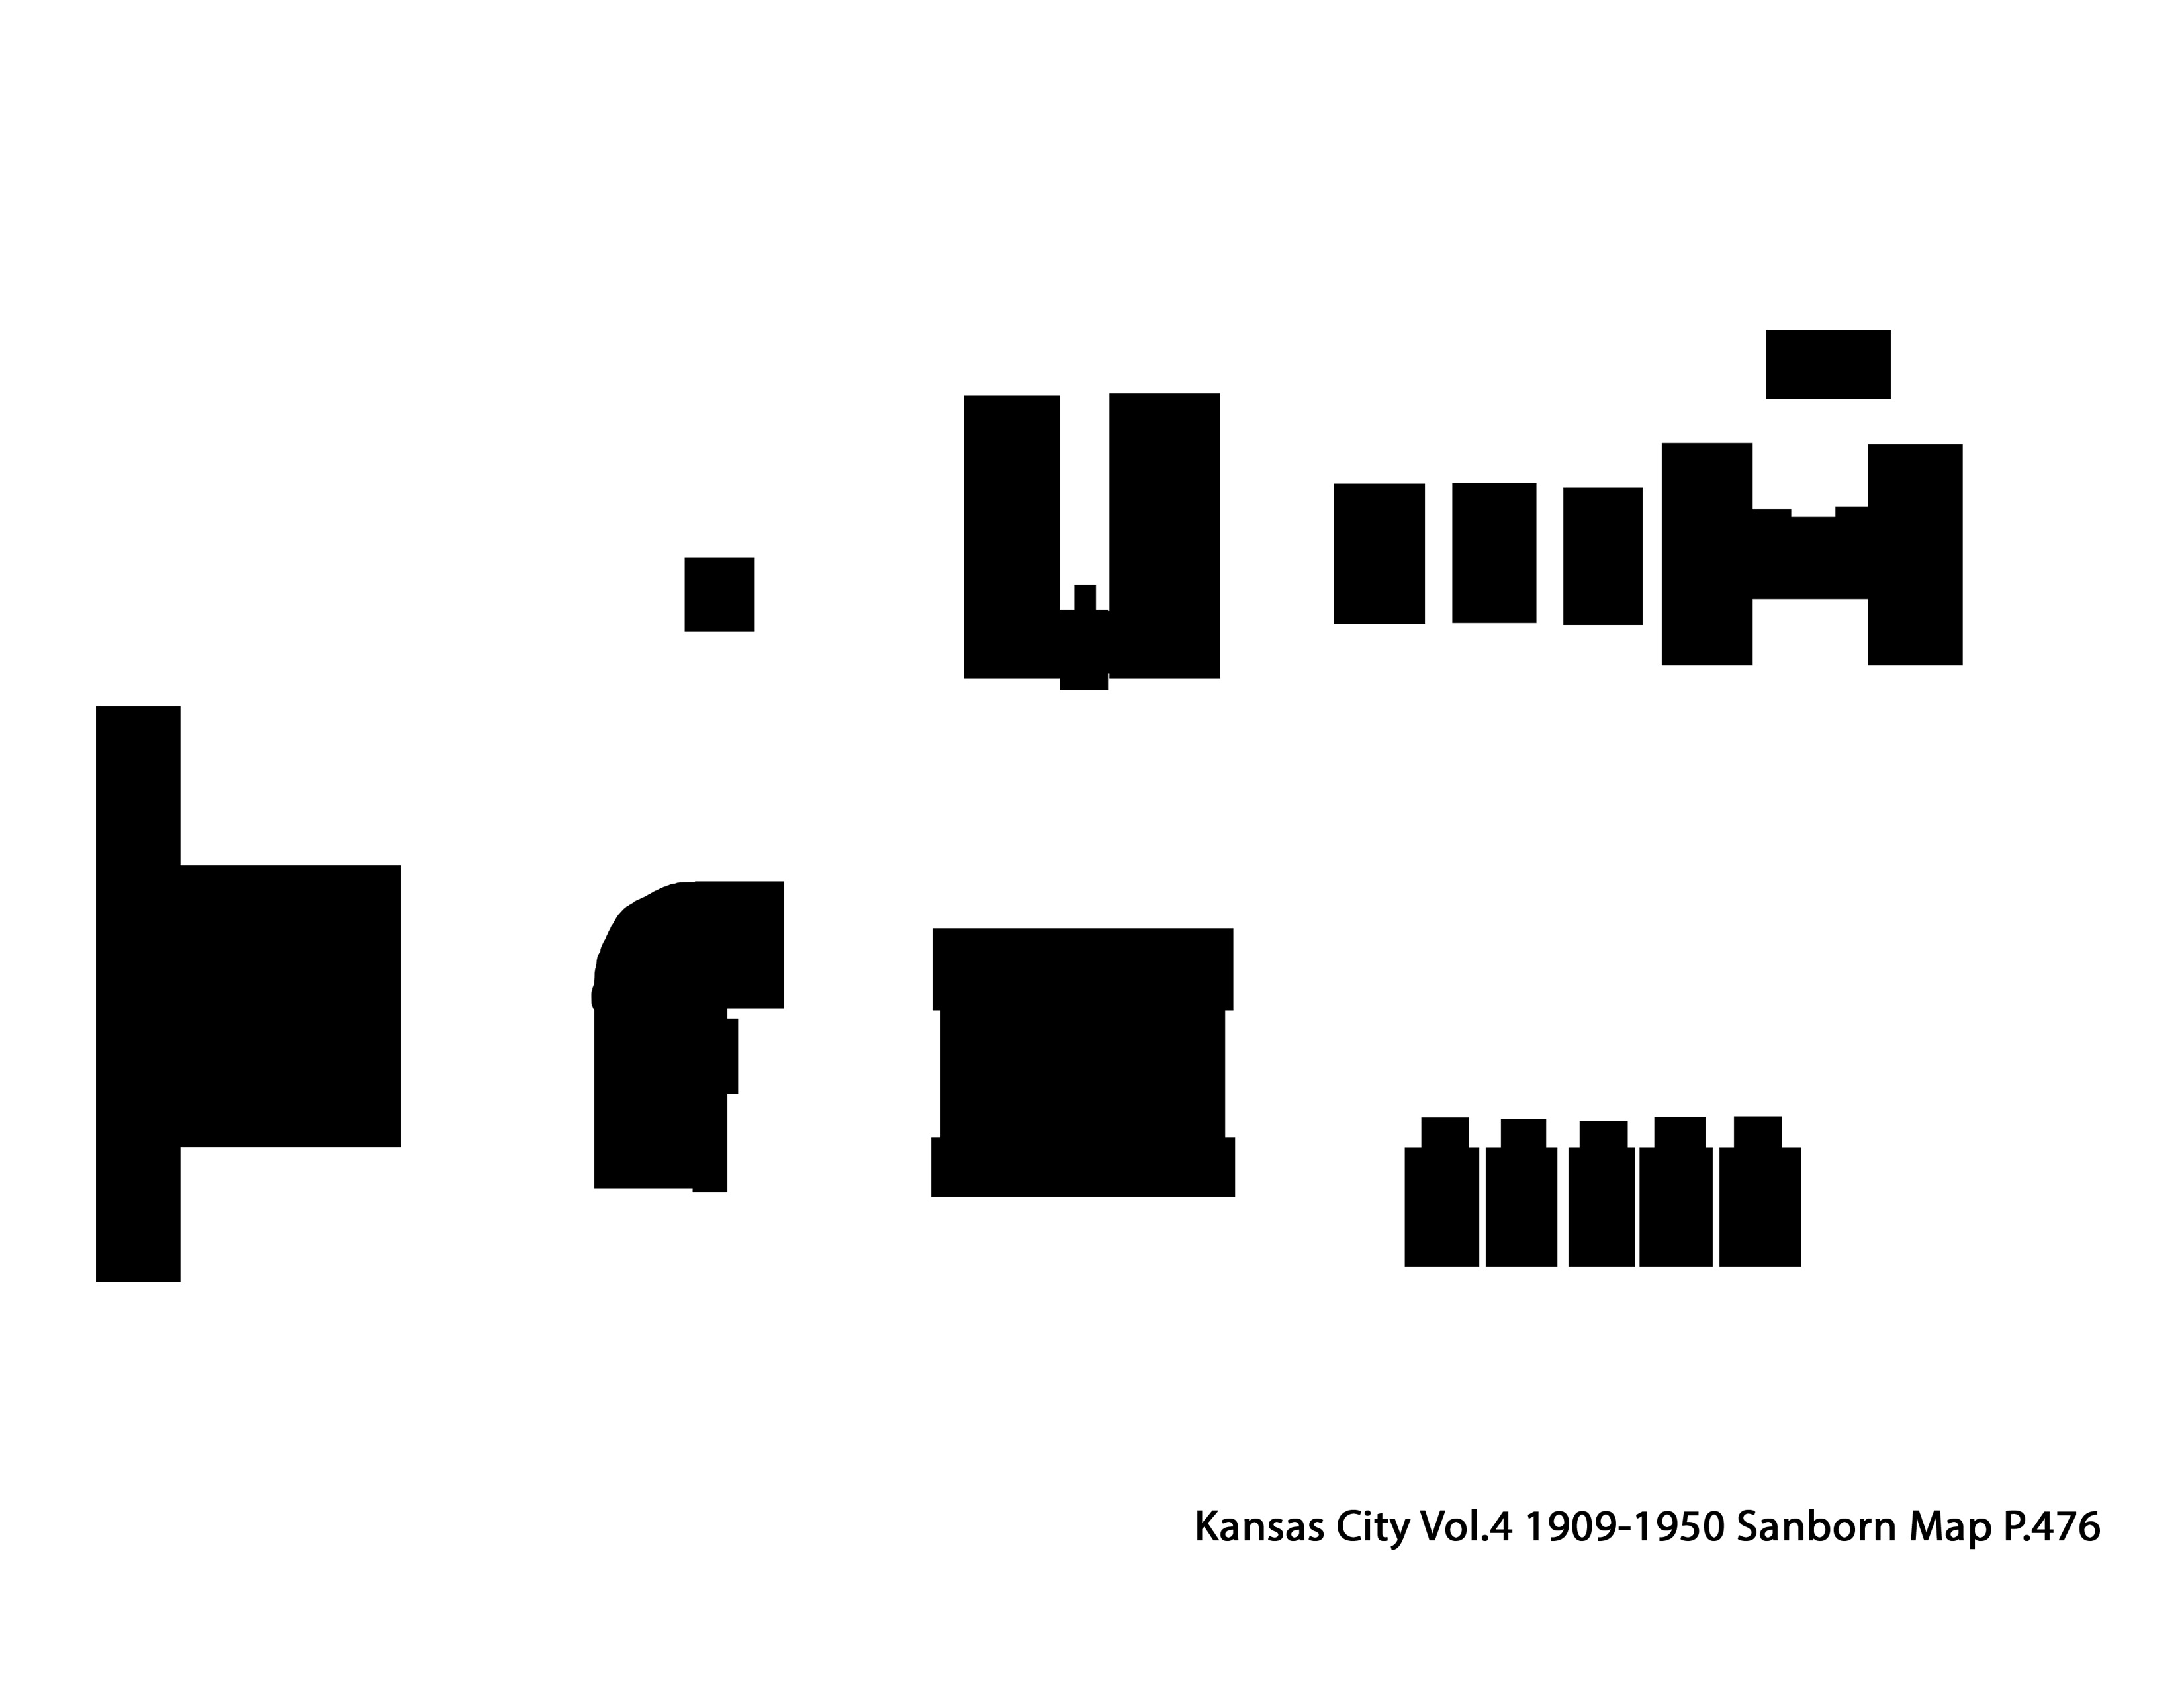
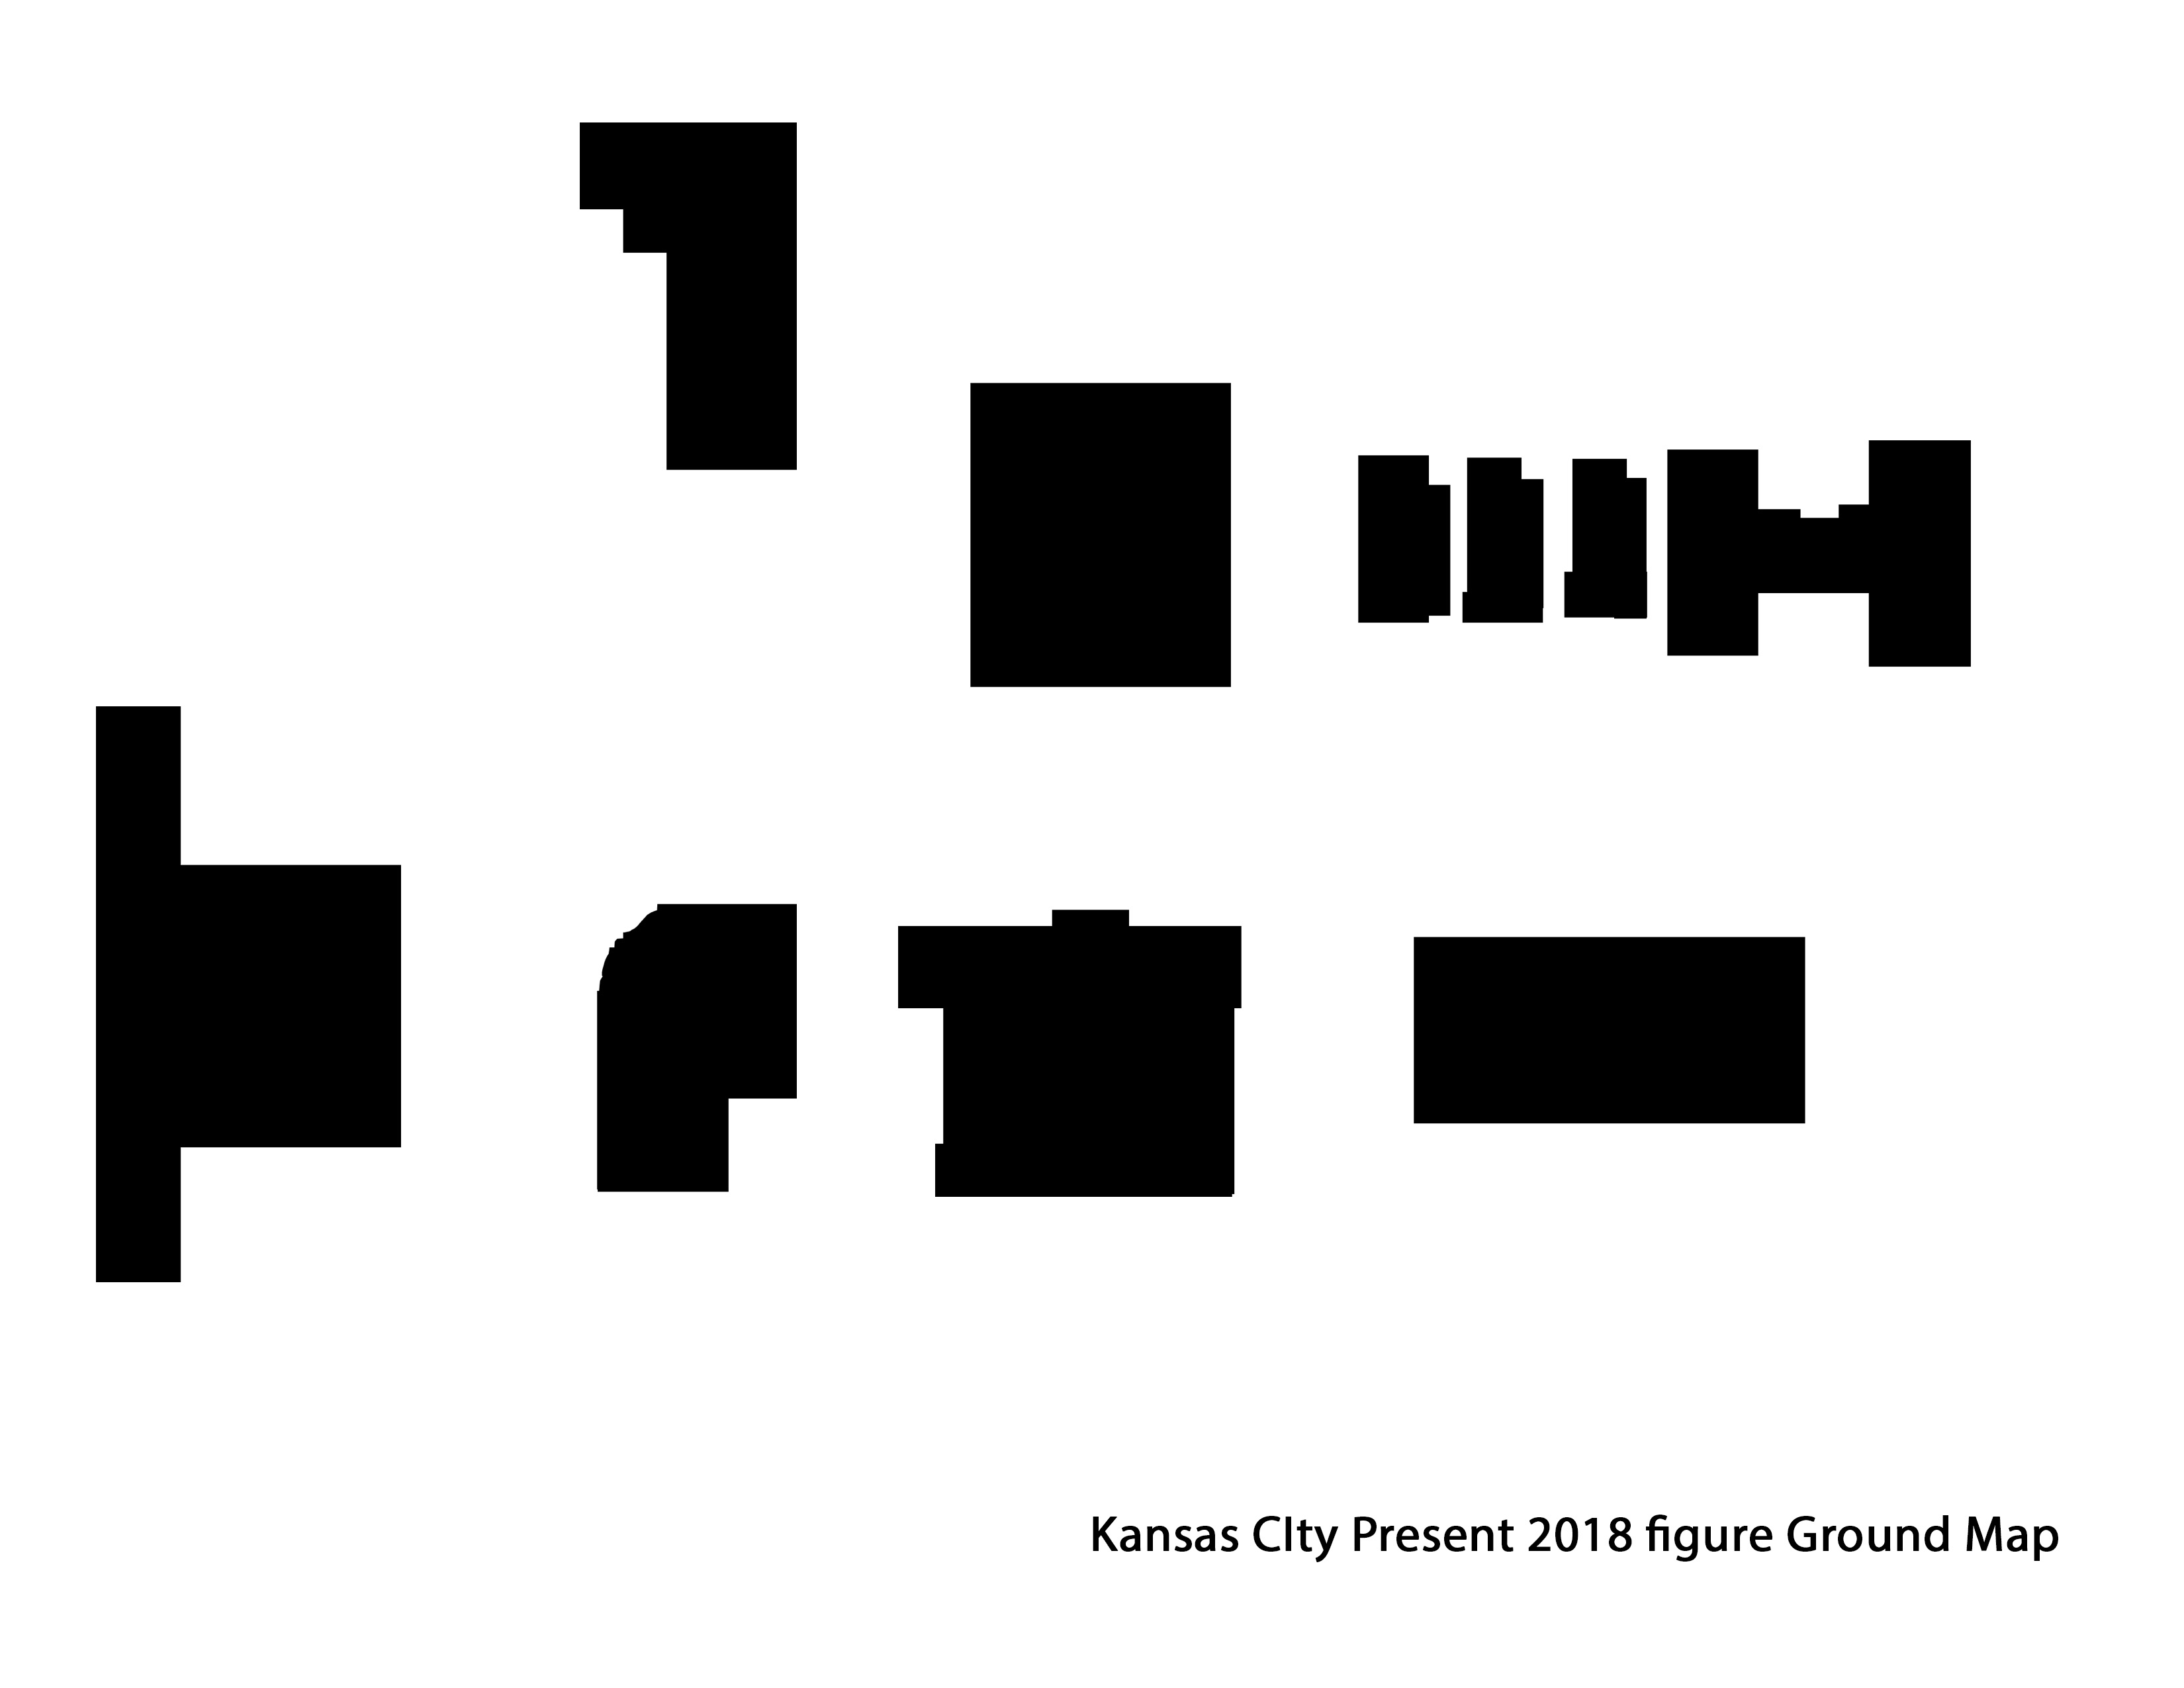
From Holmes Street to Campbell Street
At first when the location was visited the buildings seemed to be old and thought to have been there for a long standing time. The traffic was swift, but steady, even the bike lanes were being put to use. It was a quaint area that was mainly surrounded by large building complexes. But after some research of the maps below, many of the building weren’t there the entire time such as the building complex know as the Amour Flats was not built in 1909, but sometime between 1909 and 1925. And the other building was the biggest building that on the maps is an “H” it was just an empty lot until sometime after 1925. Even one of the older buildings was demolished and is now just an empty lot. After researching these maps, seeing the change of density of buildings is an amazing thing.

Broadway to Wyandotte
Over a course of a time Armour Boulevard has become a favorite road for me to travel. Bicycle lanes have been put in on the inside of the streets closer to the curb to ensure safer passage for cyclist and perhaps the new bird scooters that have infested the streets of Kansas City. The fact that a majority of properties have been preserved and saved from destruction is clear that there are is care for the streets. The figure Ground illustrates below the changes that have taken place from the years 1950 to the present day of 2018. Many of the buildings still exist with the charm and characteristics of when they were first built.
Hardesty and Oakley Ave
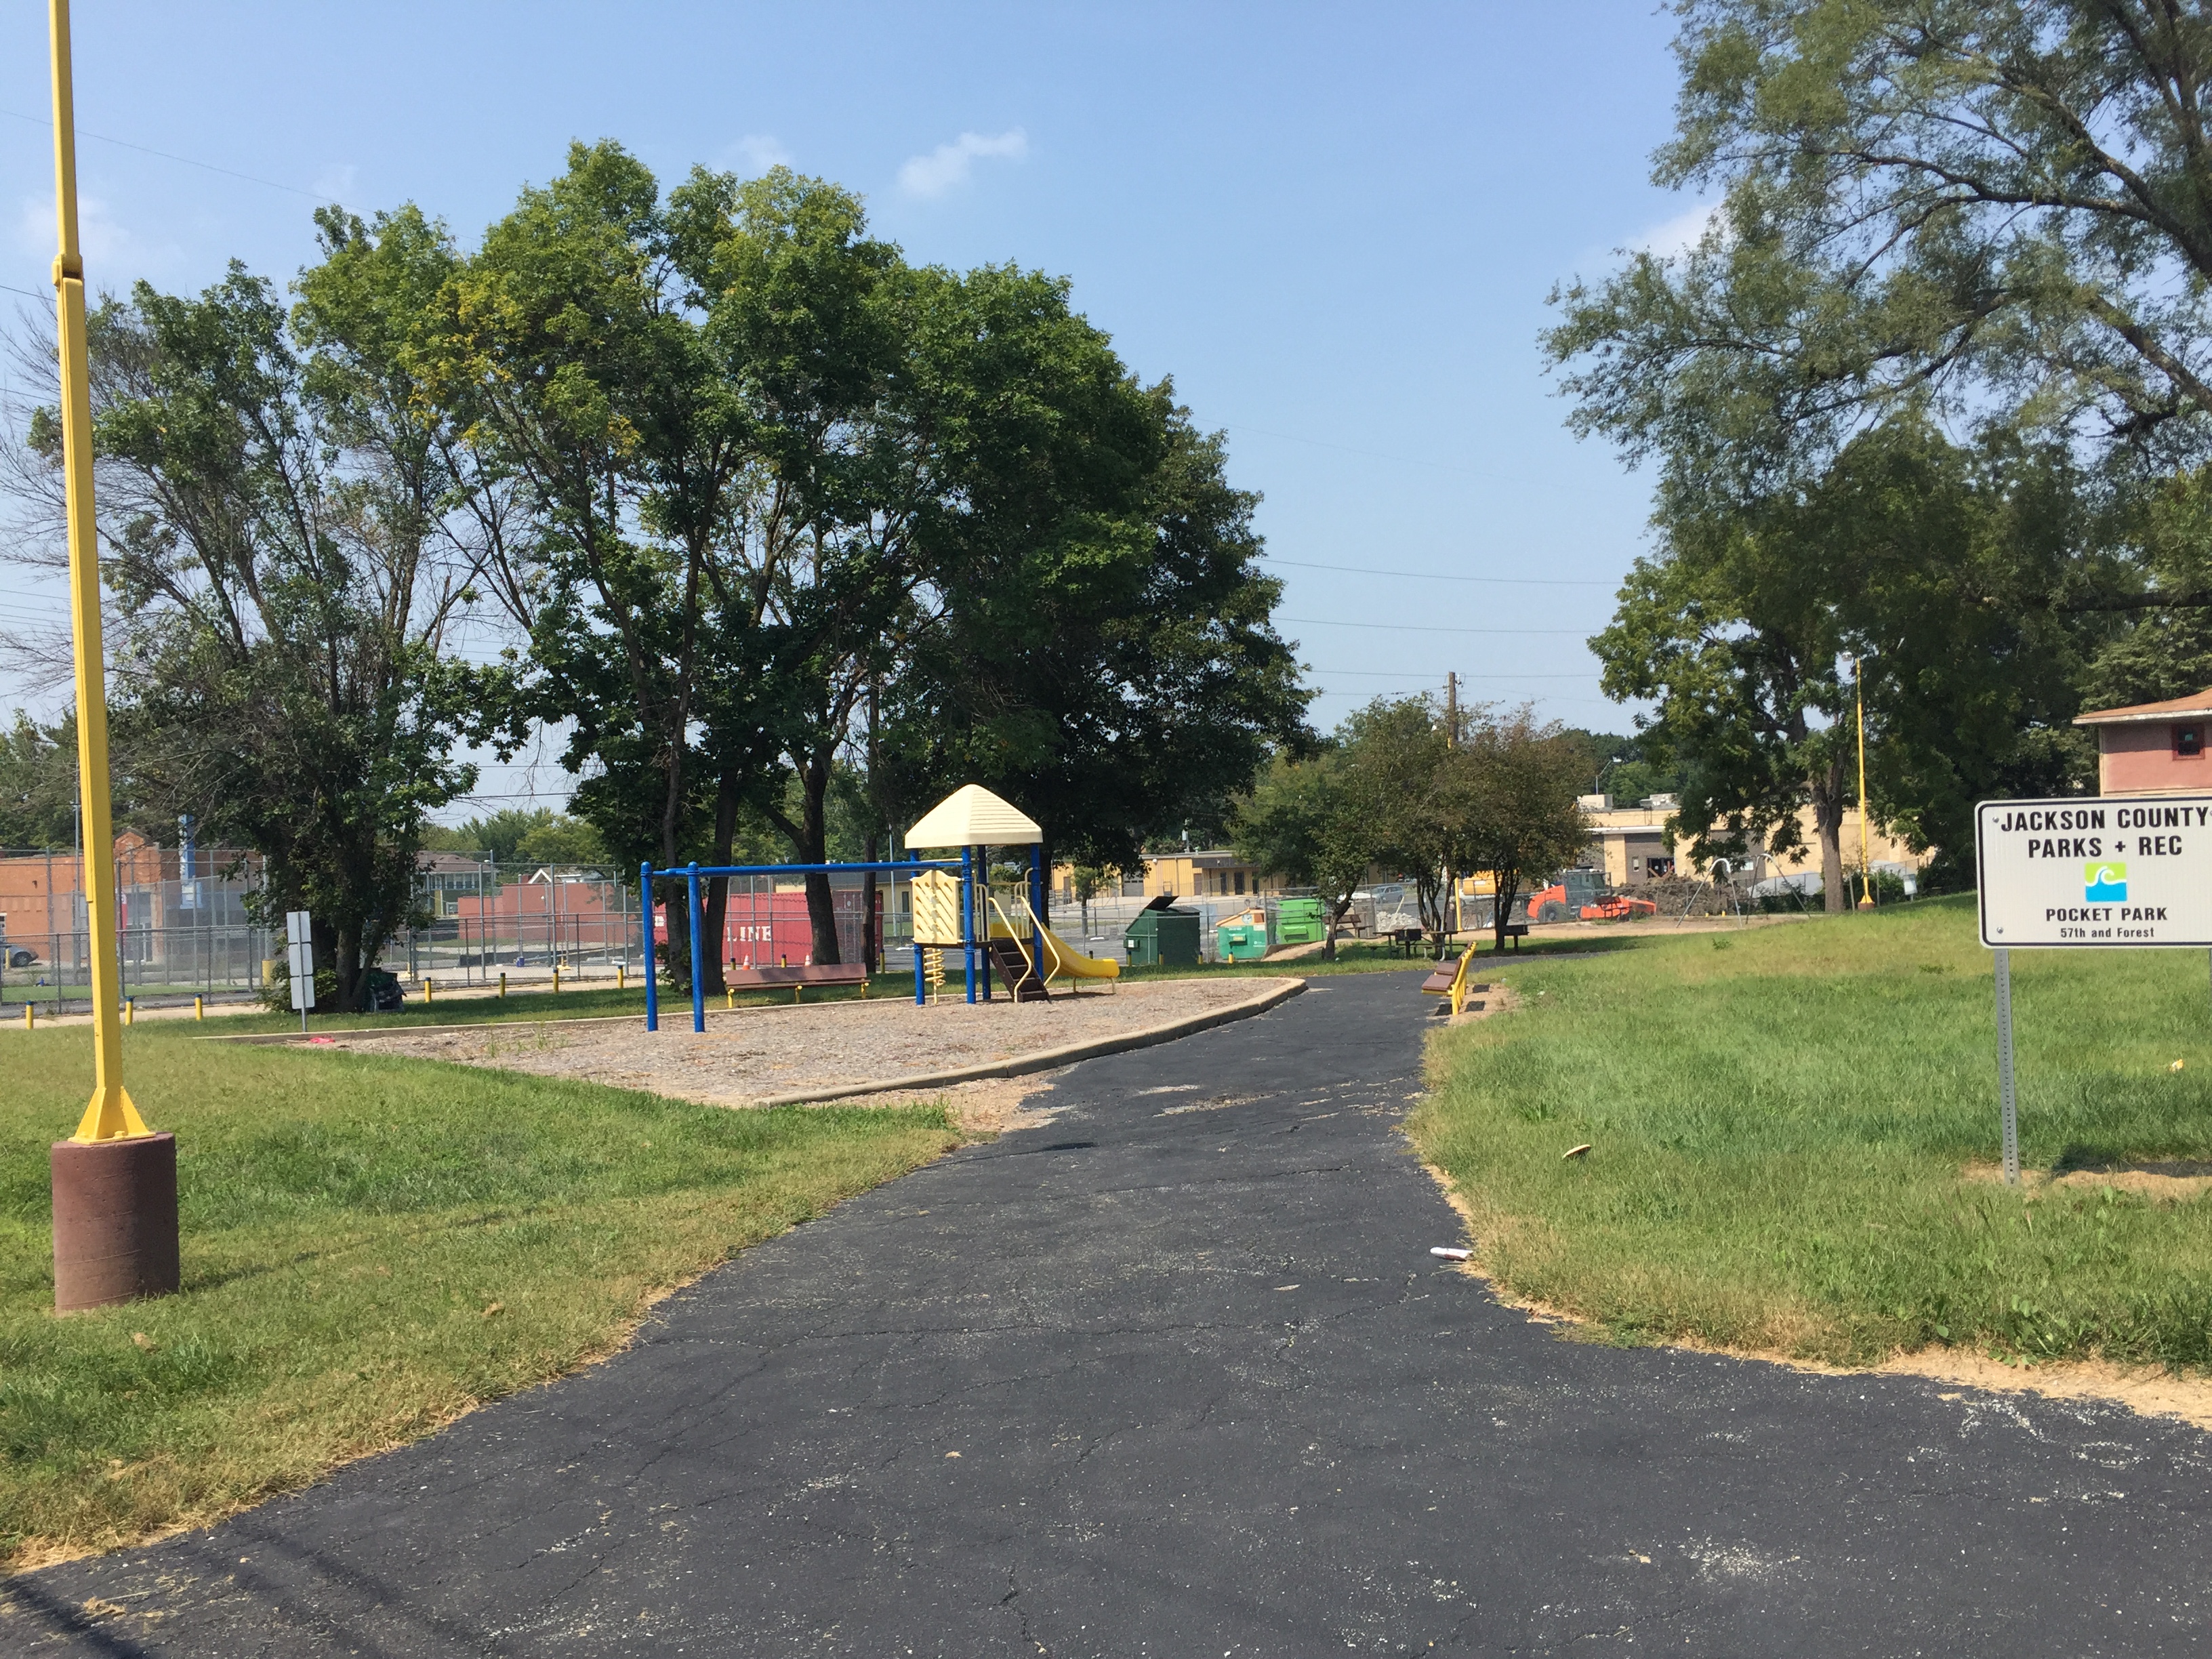
In the past he area between Oakley and Hardesty was very normal. Houses existed side by side. A small church existed and everything seemed fine for this little niche on Kansas City’s east side. However, as years passed by most houses were demolished and very few replaced them. However they are bigger in size now. The church ” Thirty Fifth Street Baptist” was expanded to the west. This all happened as the population surrounding the church downsized. Thirty Fifth Street was also cut off after Oakley to create a park off of Stadium Drive.
35th Street (Chestnut and Prospect Avenues)
The block I was assigned was between Chestnut and Prospect Avenues on 35th Street. This turned out to be a very interesting area to study because it was a combination of residential, commercial, and public real estate. After my visit I was surprised by how peaceful and serene this neighborhood was. There were people out shopping and just having a good time. It seemed like a nice place to live as there is a grocery store, small convenience stores, gas stations, and contemporary-style homes. I enjoyed being in a neighborhood with older homes and buildings because it gave me an appreciation for early 20th century American design.
35th and Euclid-Brooklyn Avenues Allison Harris
35th street 1909 map 35th Street in the Ivanhoe Northeast neighborhood bridges over a bustling highway before turning into a quiet community roadway, a street serving as the backdrop for my historical map and photo analysis research project. The blocks of Euclid Avenue, Garfield Avenue, and Brooklyn Avenue, on 35th St, underwent much change over about a century of development in Kansas City-beginning in the early 1900s as blocks with a house on every lot, and even a few commercial ventures on the corner of Brooklyn and 35th. Over time, a streetcar line was put up on Brooklyn Avenue in the early 1920s, connected to what was once a vast system of streetcars across the metro area. Soon enough though, the mainstream use and ownership of the automobile set in, and the streetcar down Brooklyn Avenue was swapped for a highway down what was once Michigan Avenue. Now, these blocks look much different and less picturesque than they once did on Sanborn Maps and the 1925 Atlas- nearly half the lots on these particular blocks sit empty, and the homes originally built in 1905 now are worn and old. The roadways and sidewalks of the neighborhood are in disarray and in need of repair. This section of 35th street has changed much over the years and growth of Kansas City.
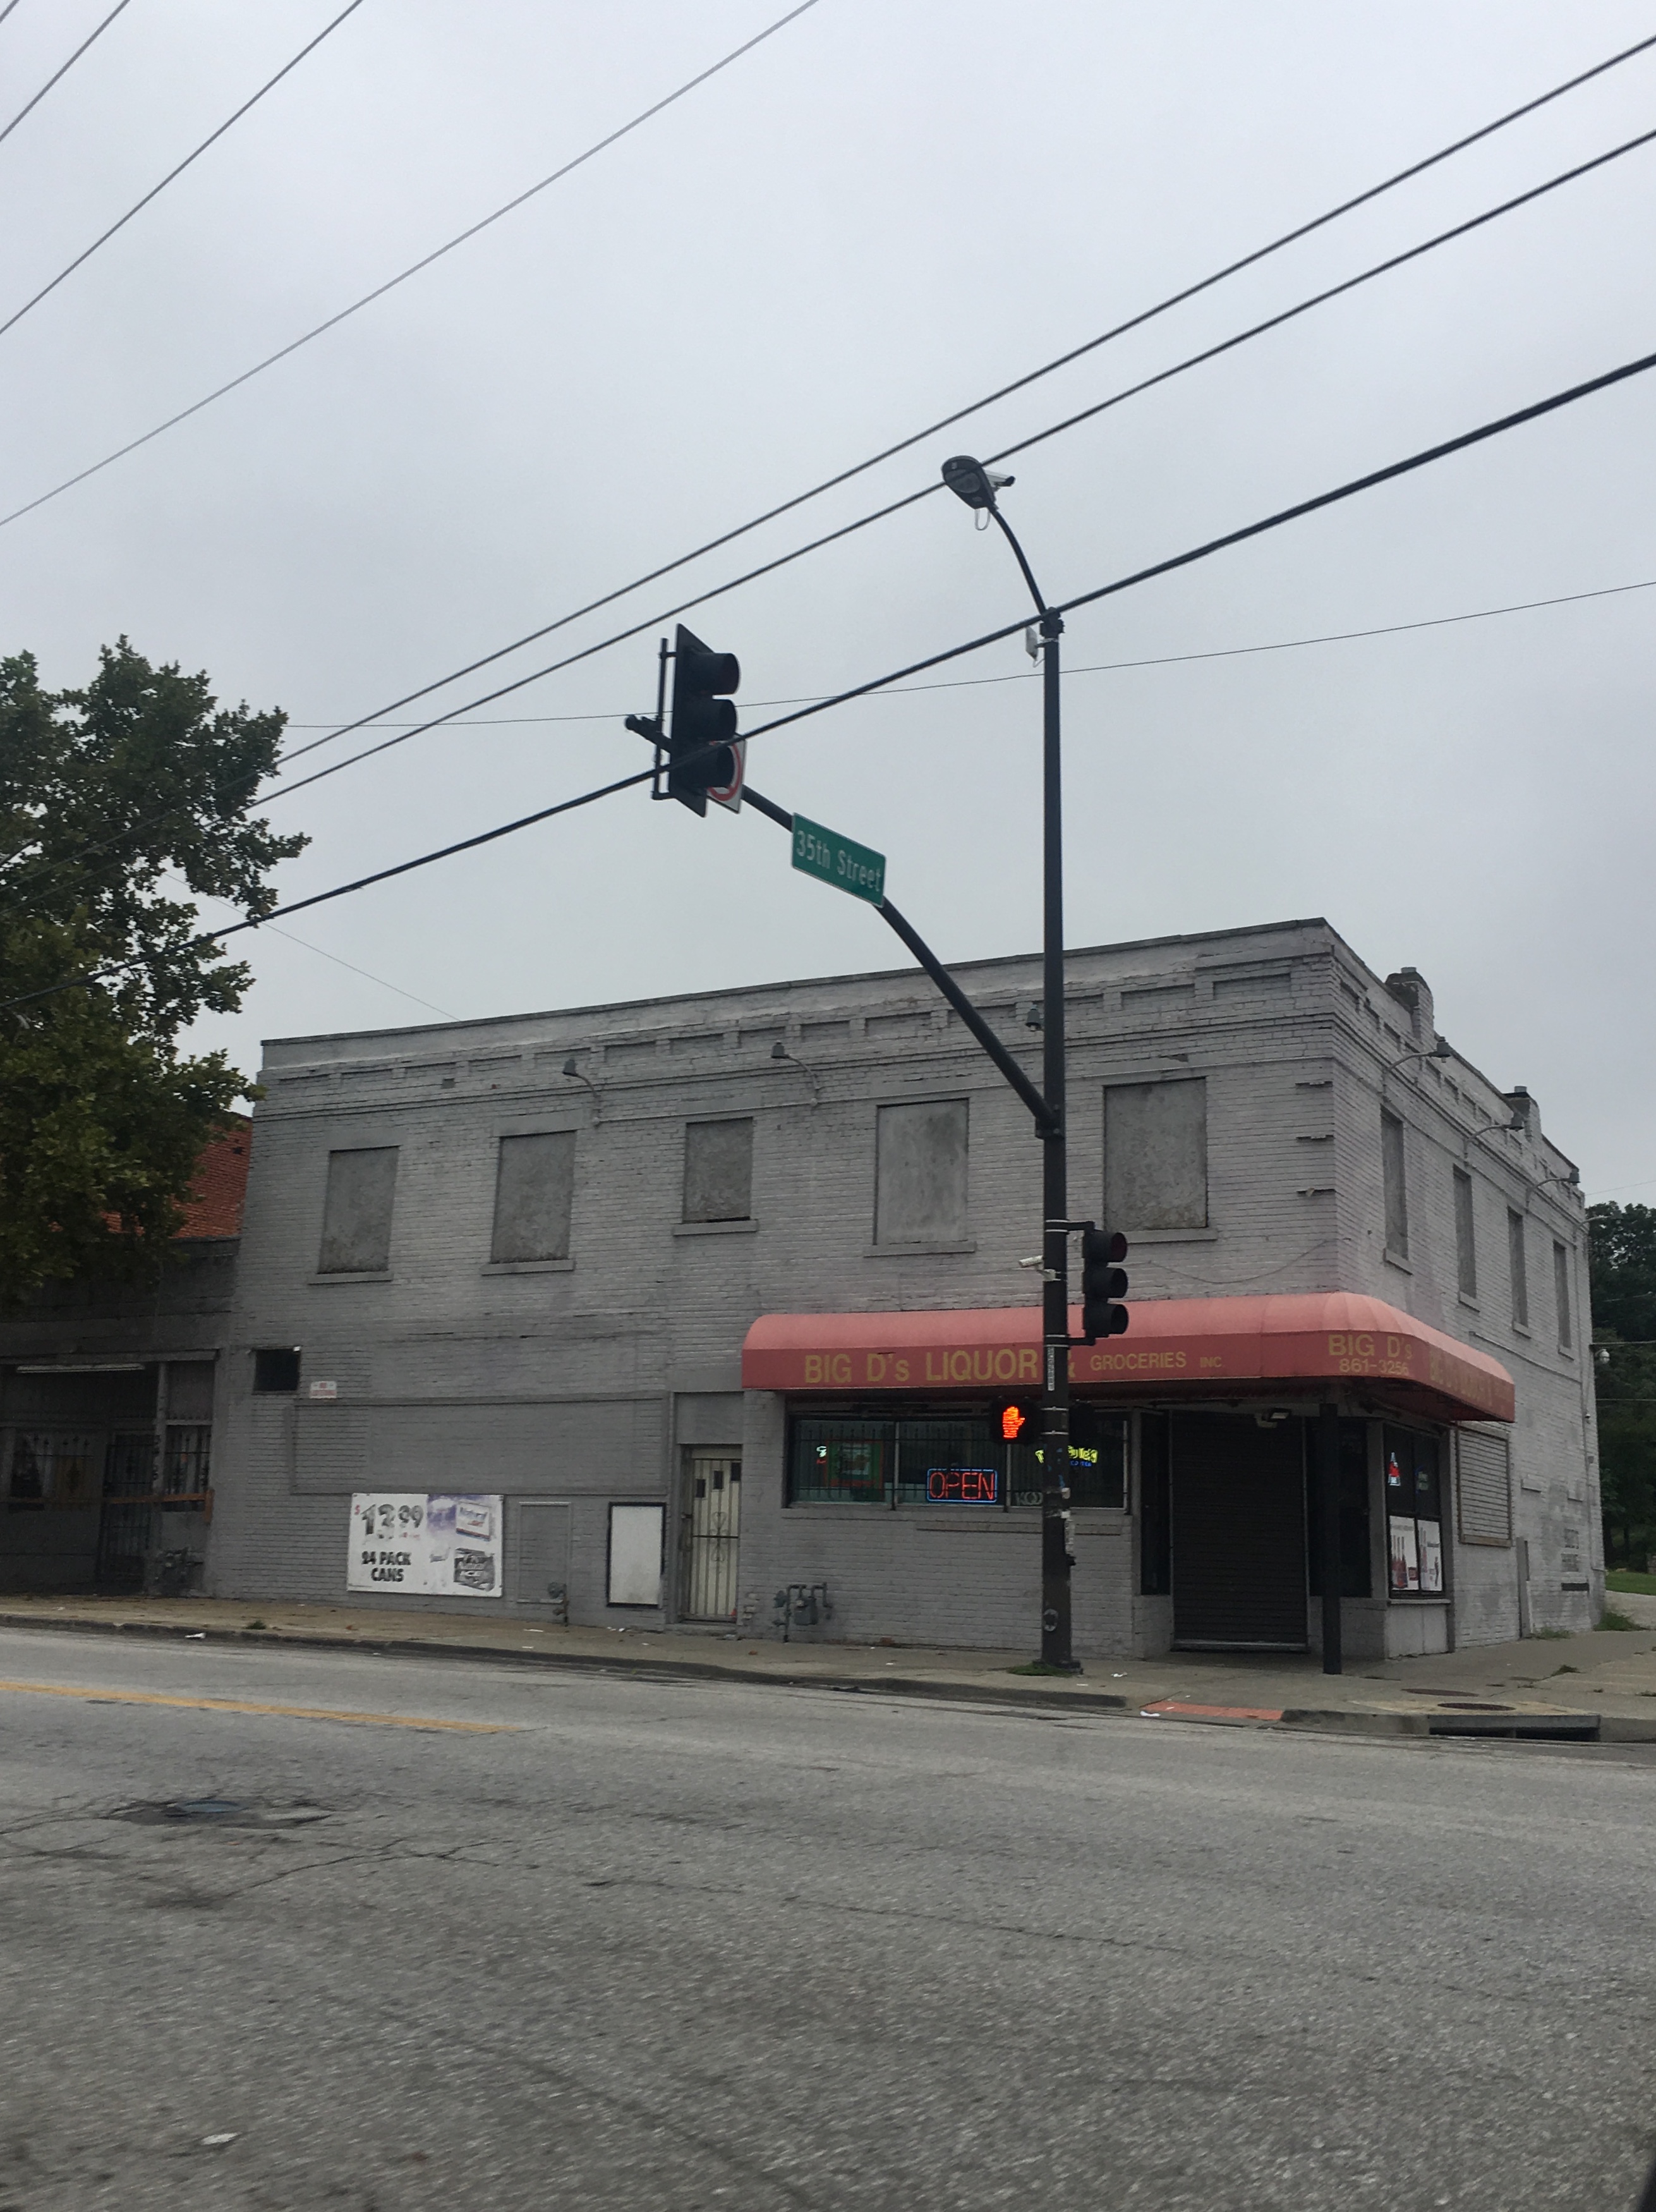
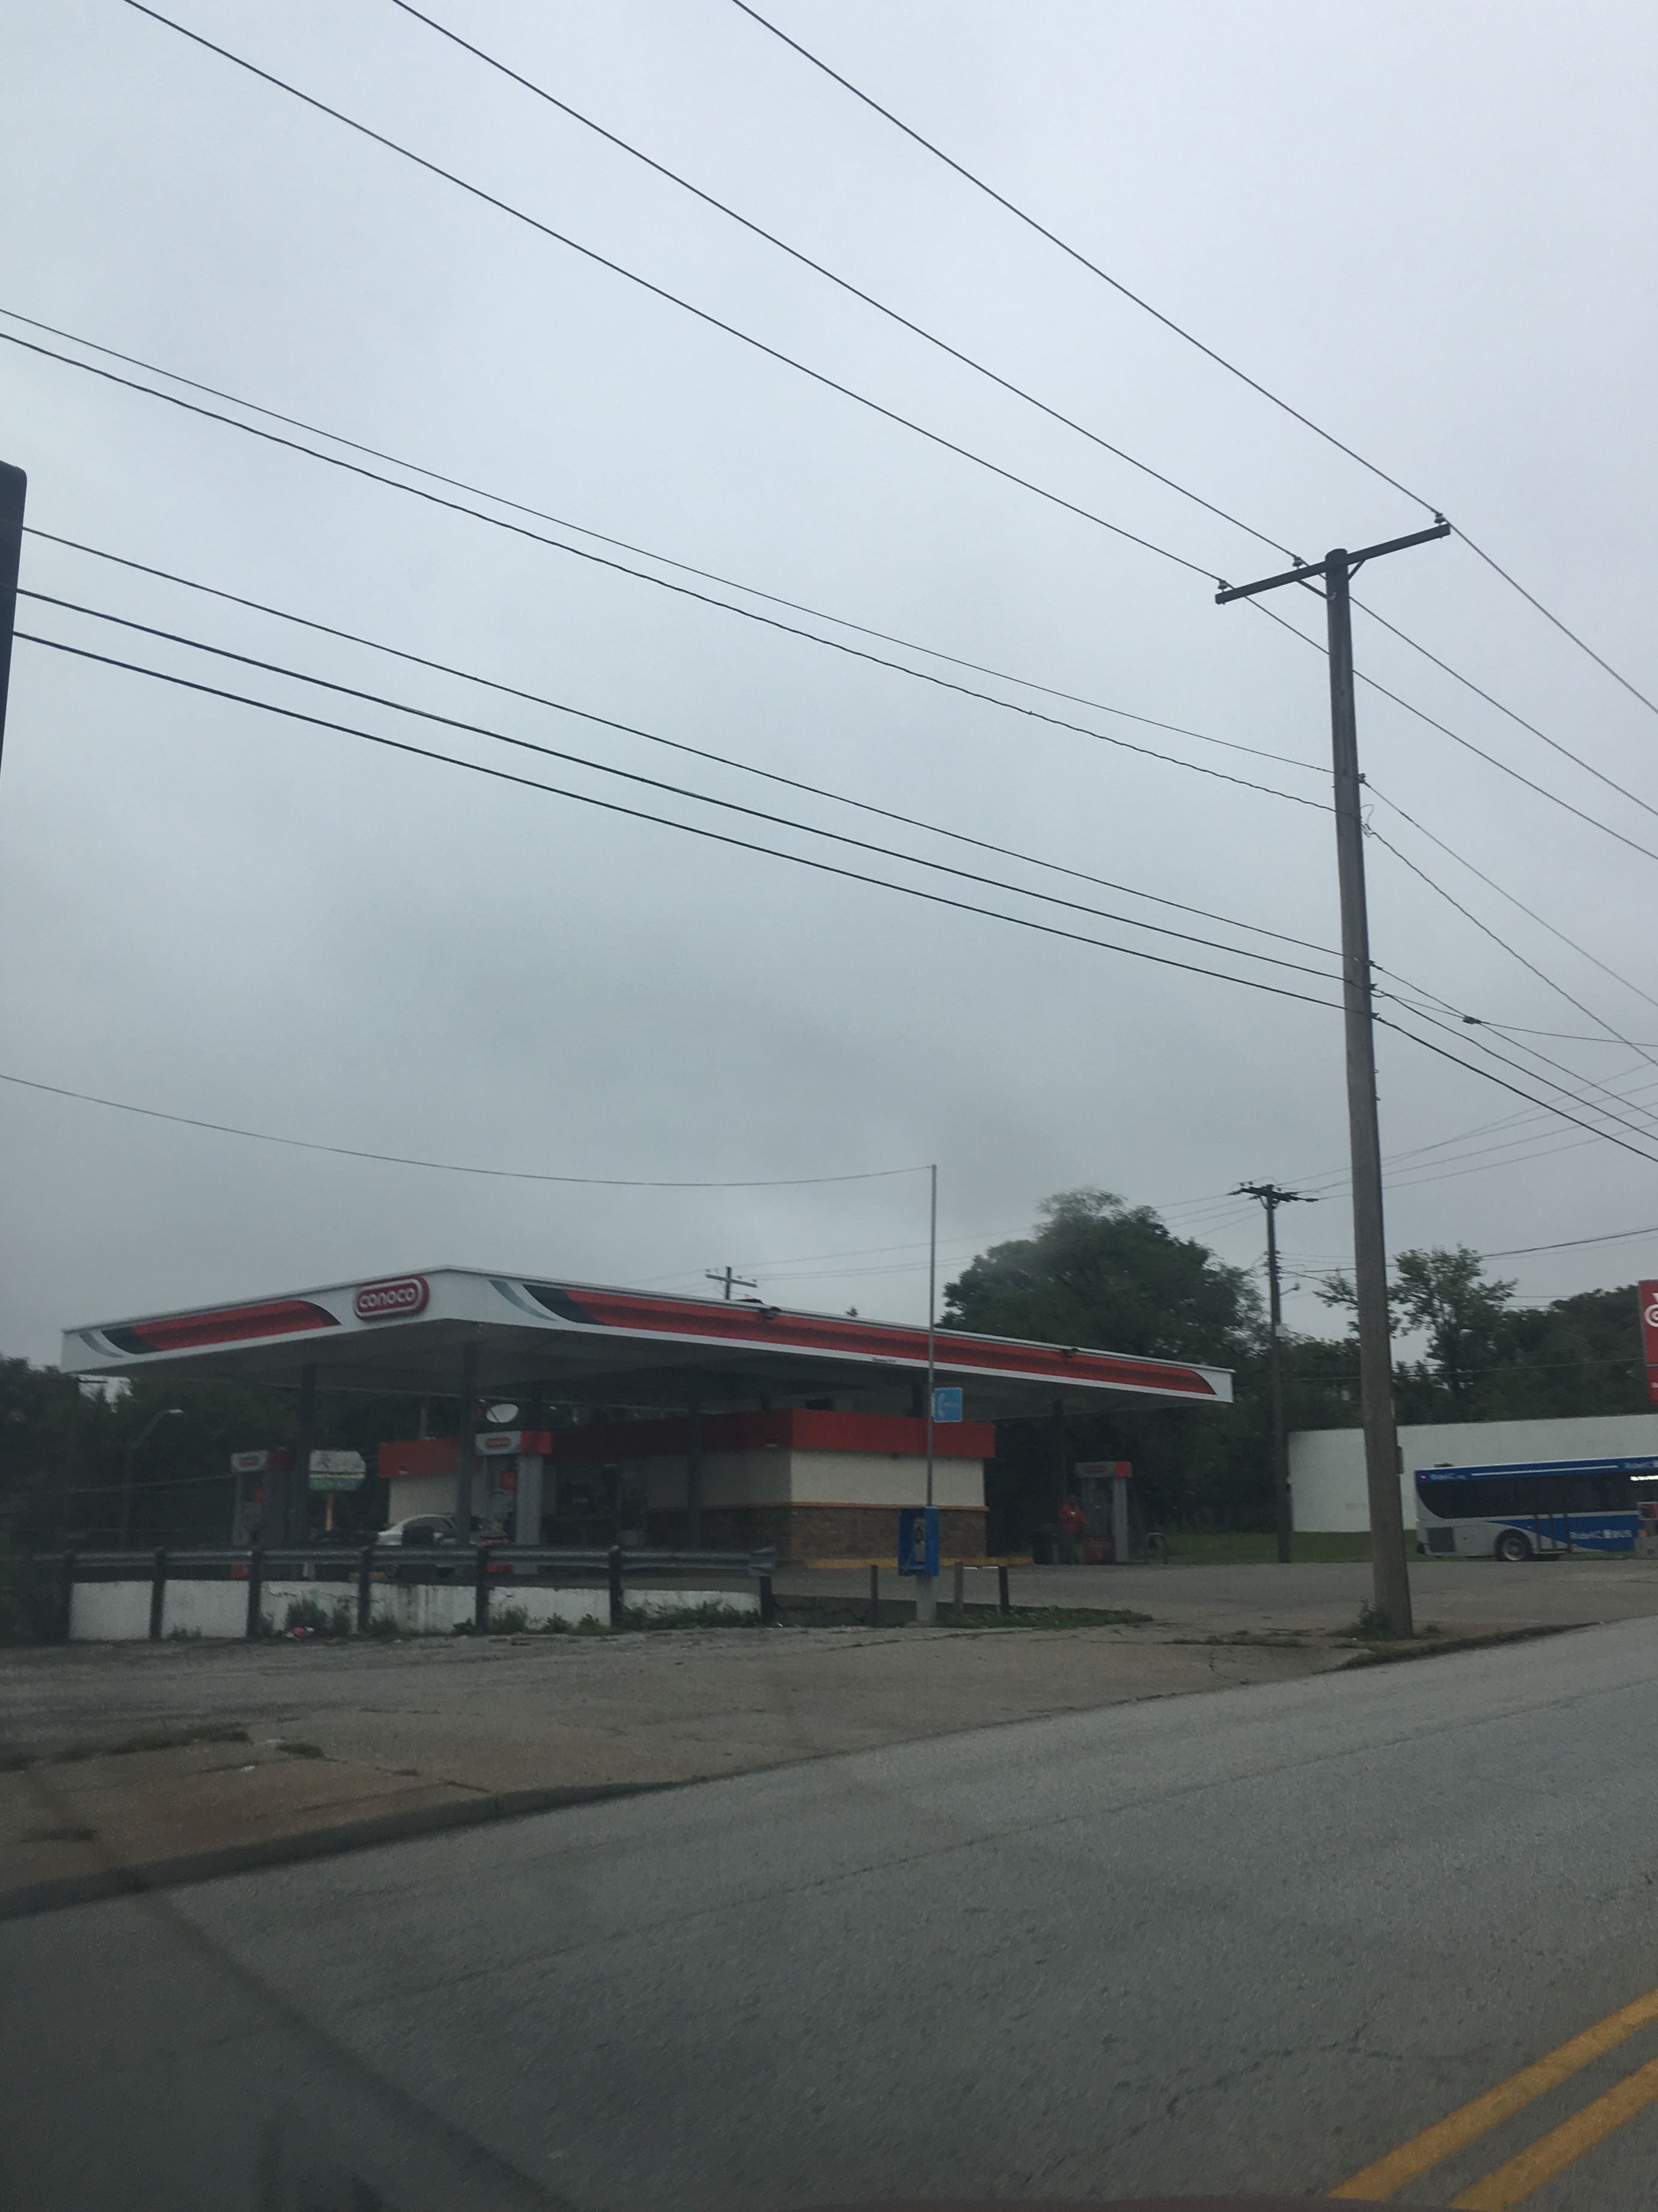
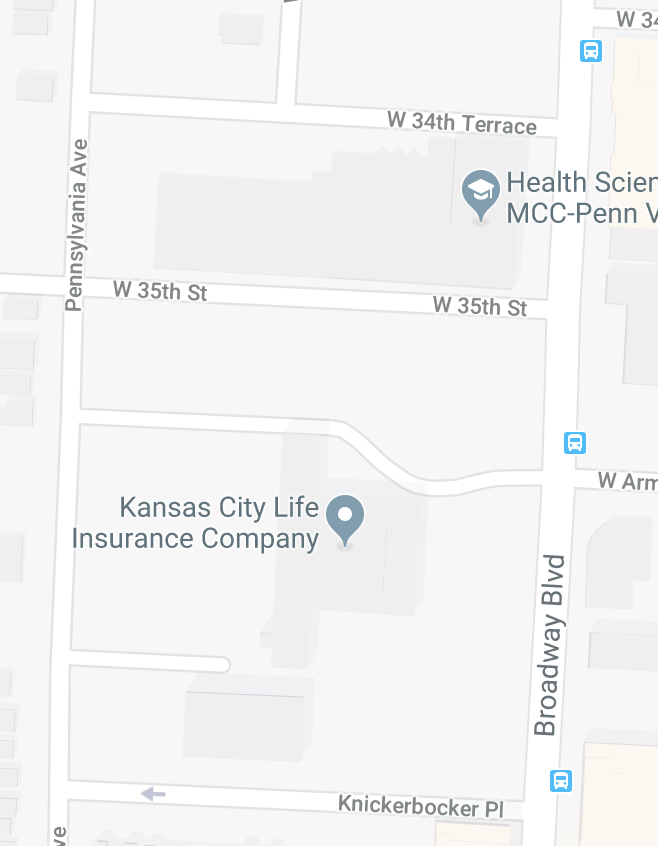
35th St. between Pennsylvania Ave. and Broadway Blvd. -Joe Allen
My block was 35th St. between Broadway Blvd. and Pennsylvania Ave. The block has changed over time. In 1909 the block had houses and the block was not fully developed. there were open lots where houses would go in the next couple years so I’m assuming during the time of the Sanborn map the area was being developed and built. Later on, in 1925, the block was fully developed with houses. Today, the block has no houses on it and is mostly parking lots for the life insurance building and the health science institute. The surrounding area has become more business than residential. 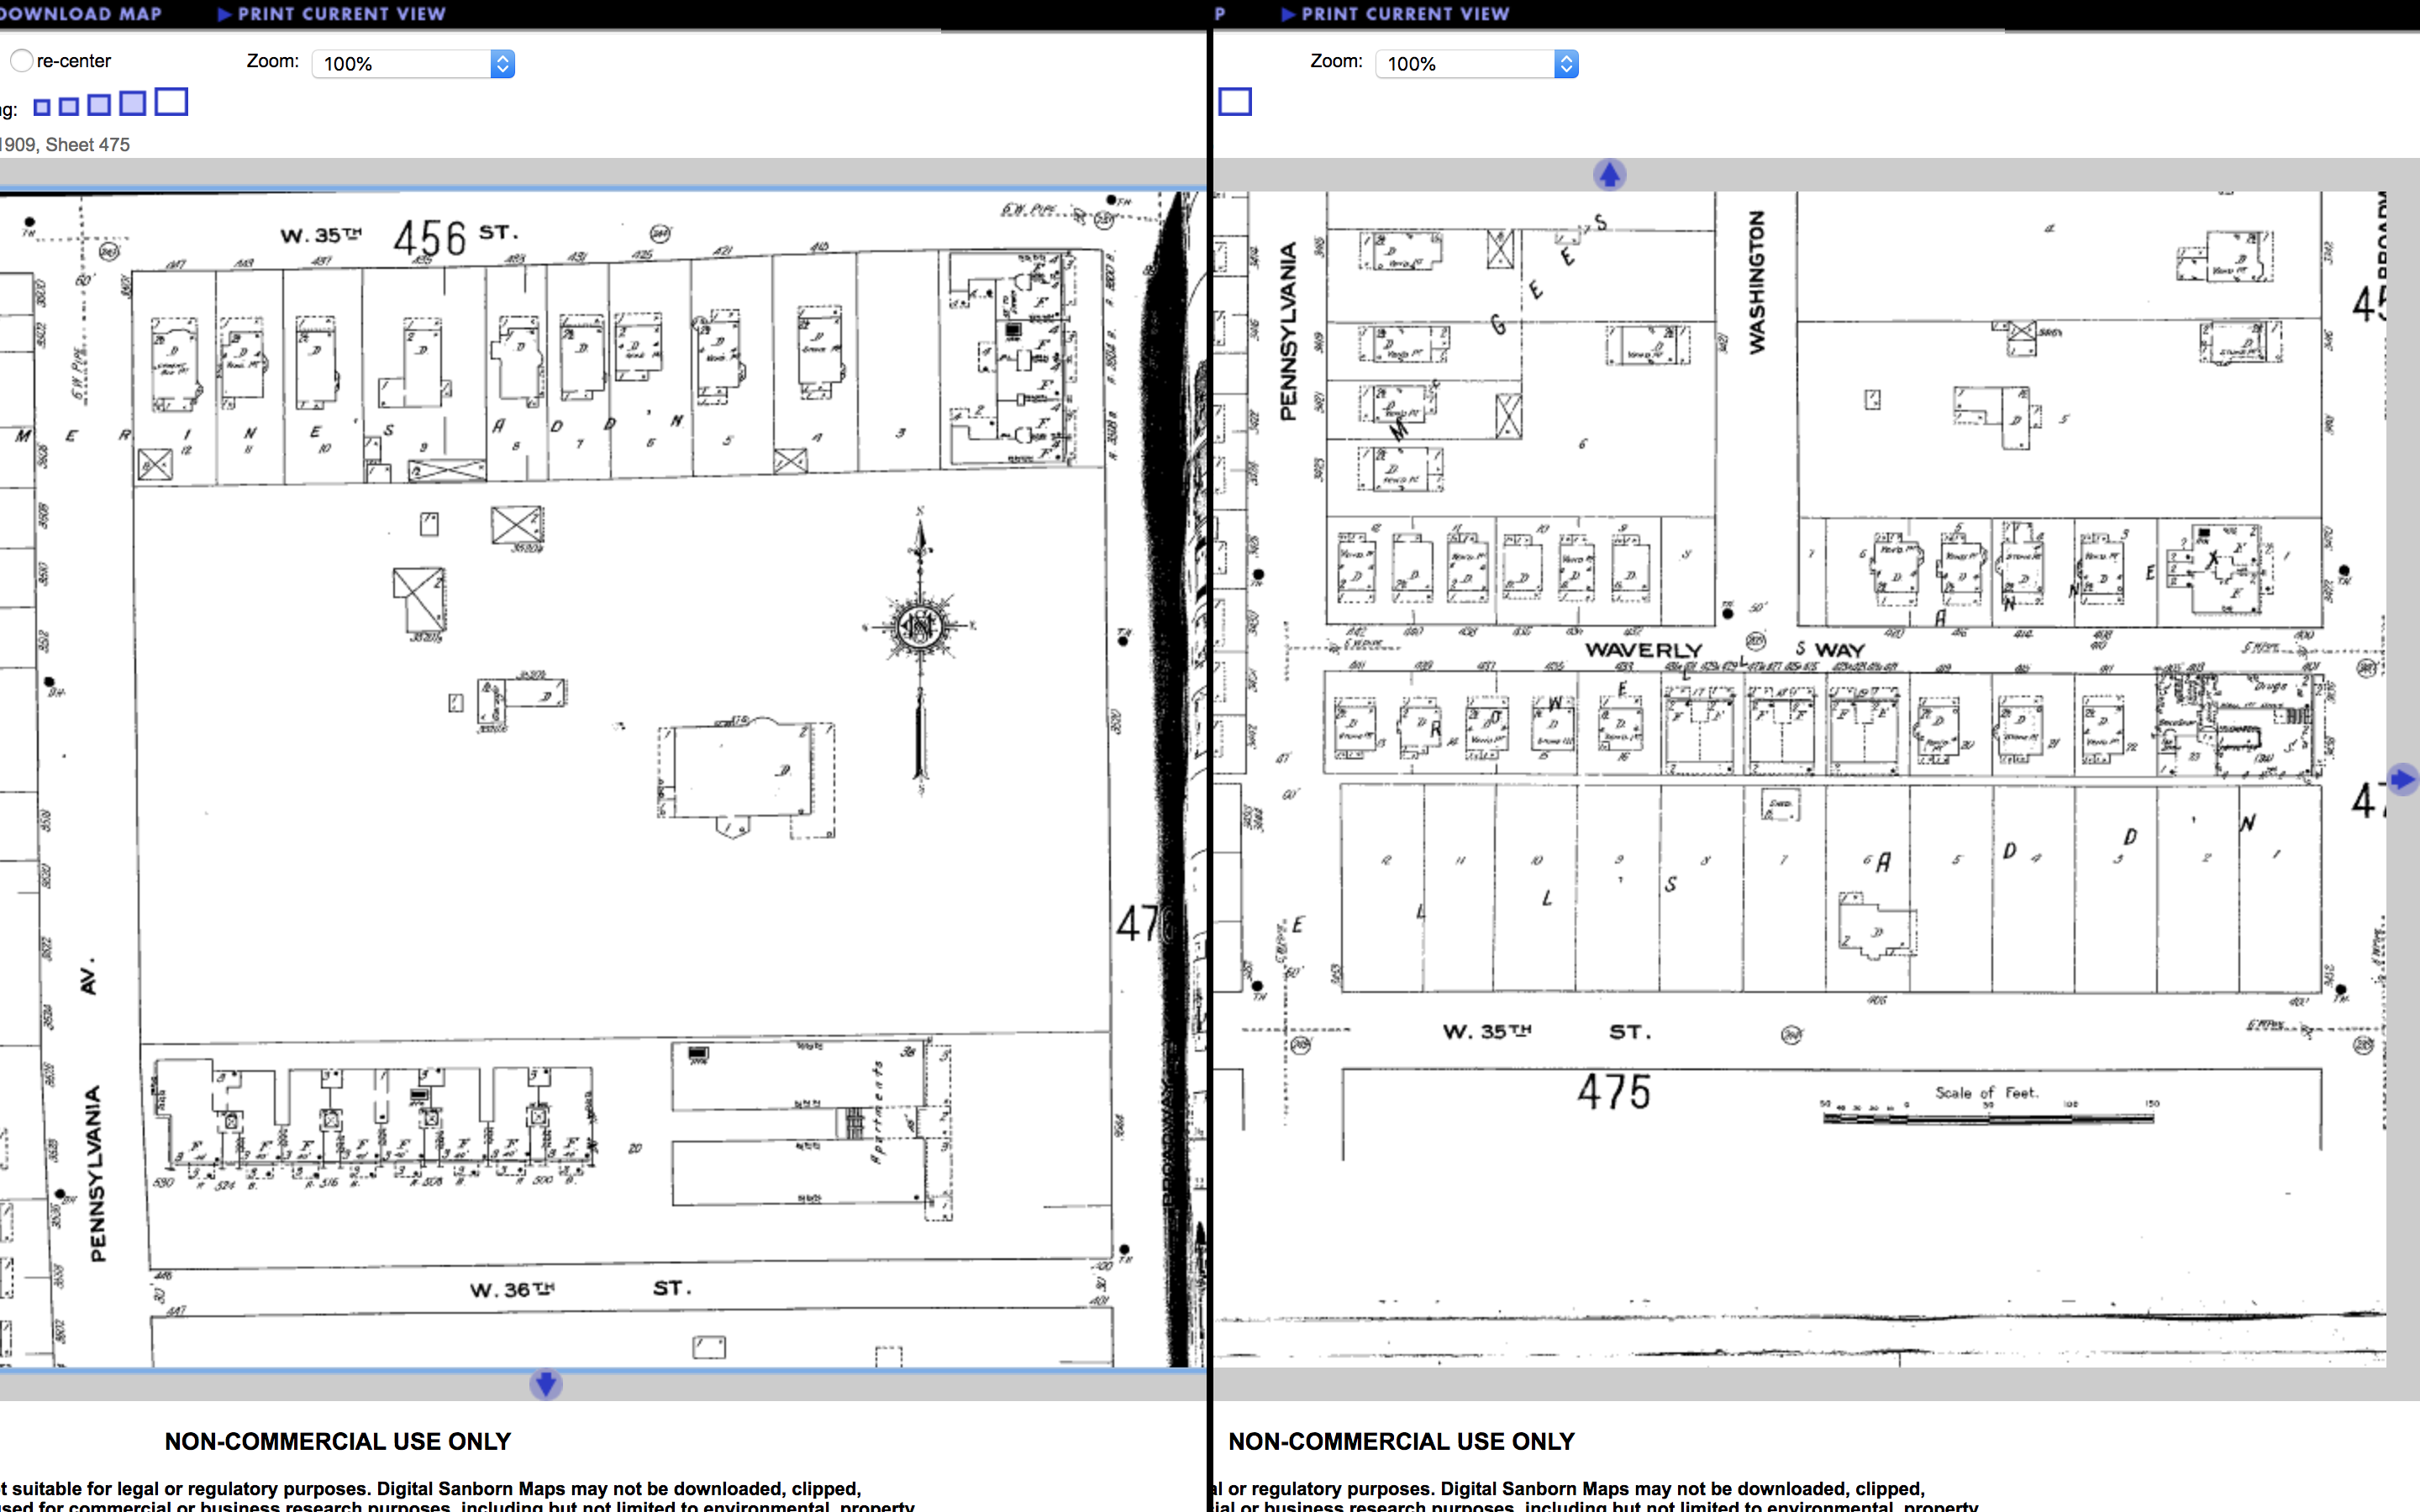
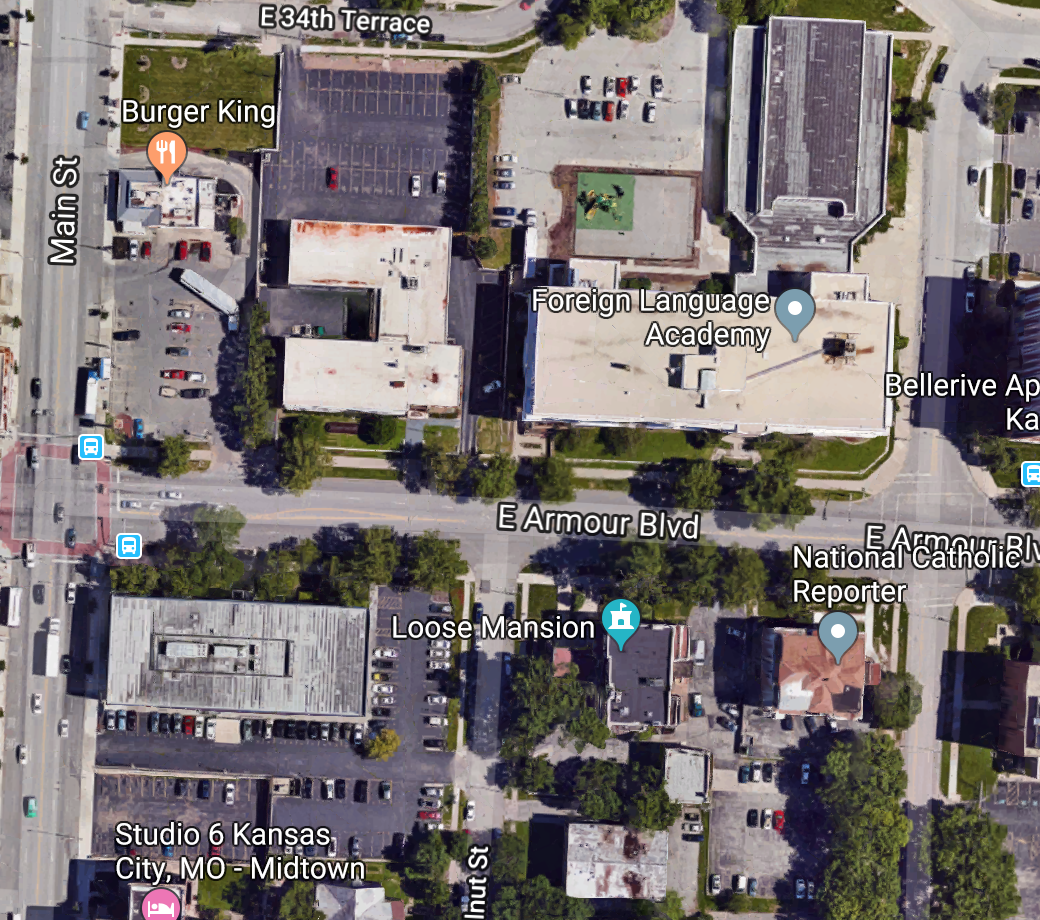
Main St and Warwick
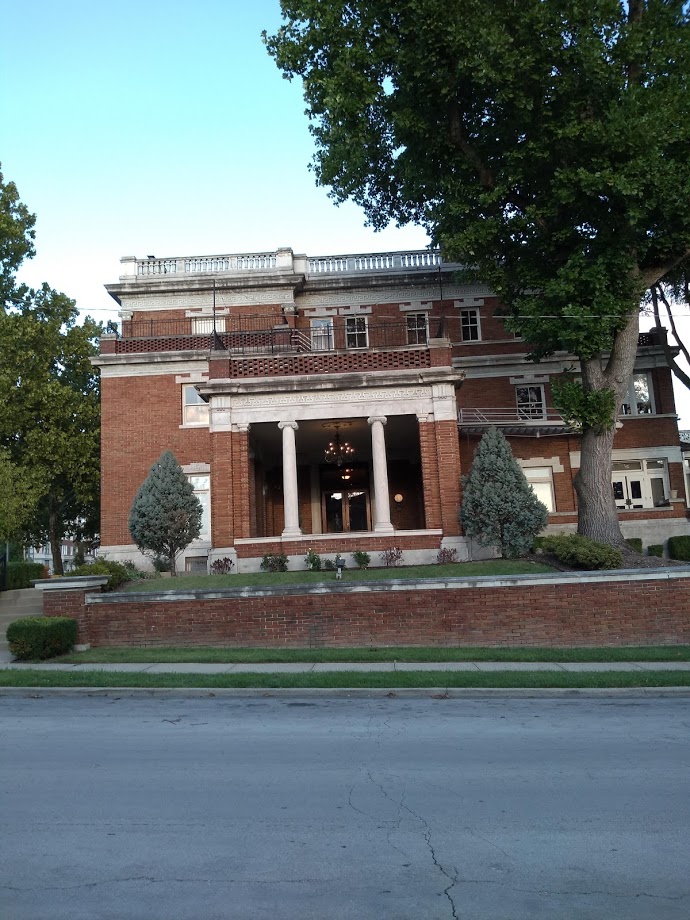
From 1895 to 2018 Kansas City at Main St and Warwick off of Armour Blvd has changed quite a bit. From vacant land plots to mansions for the wealthy in the early years to new structures and corporate buildings in 2018. Only two buildings from the past exist, Loose Mansion and The National Catholic Reporter building. Soon enough even those buildings will change as they continue to age. Change is inevitable…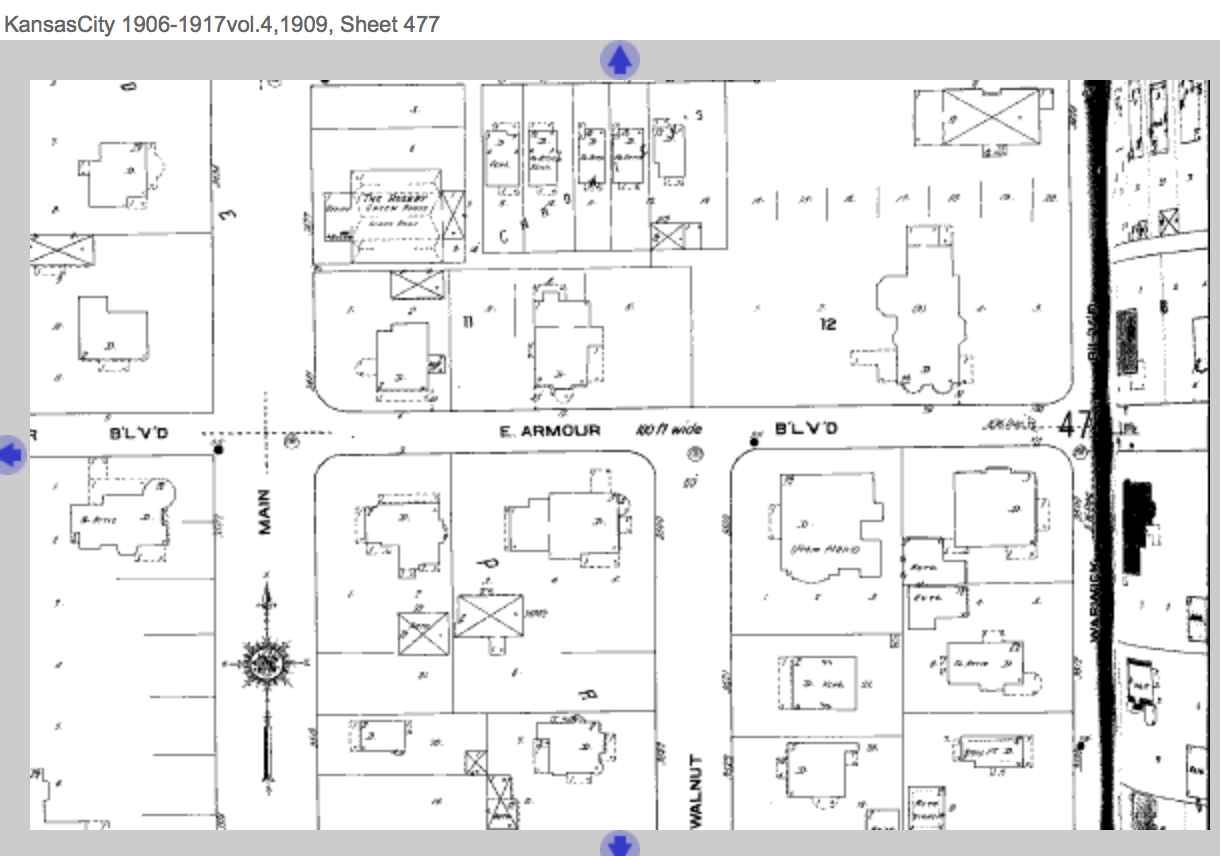
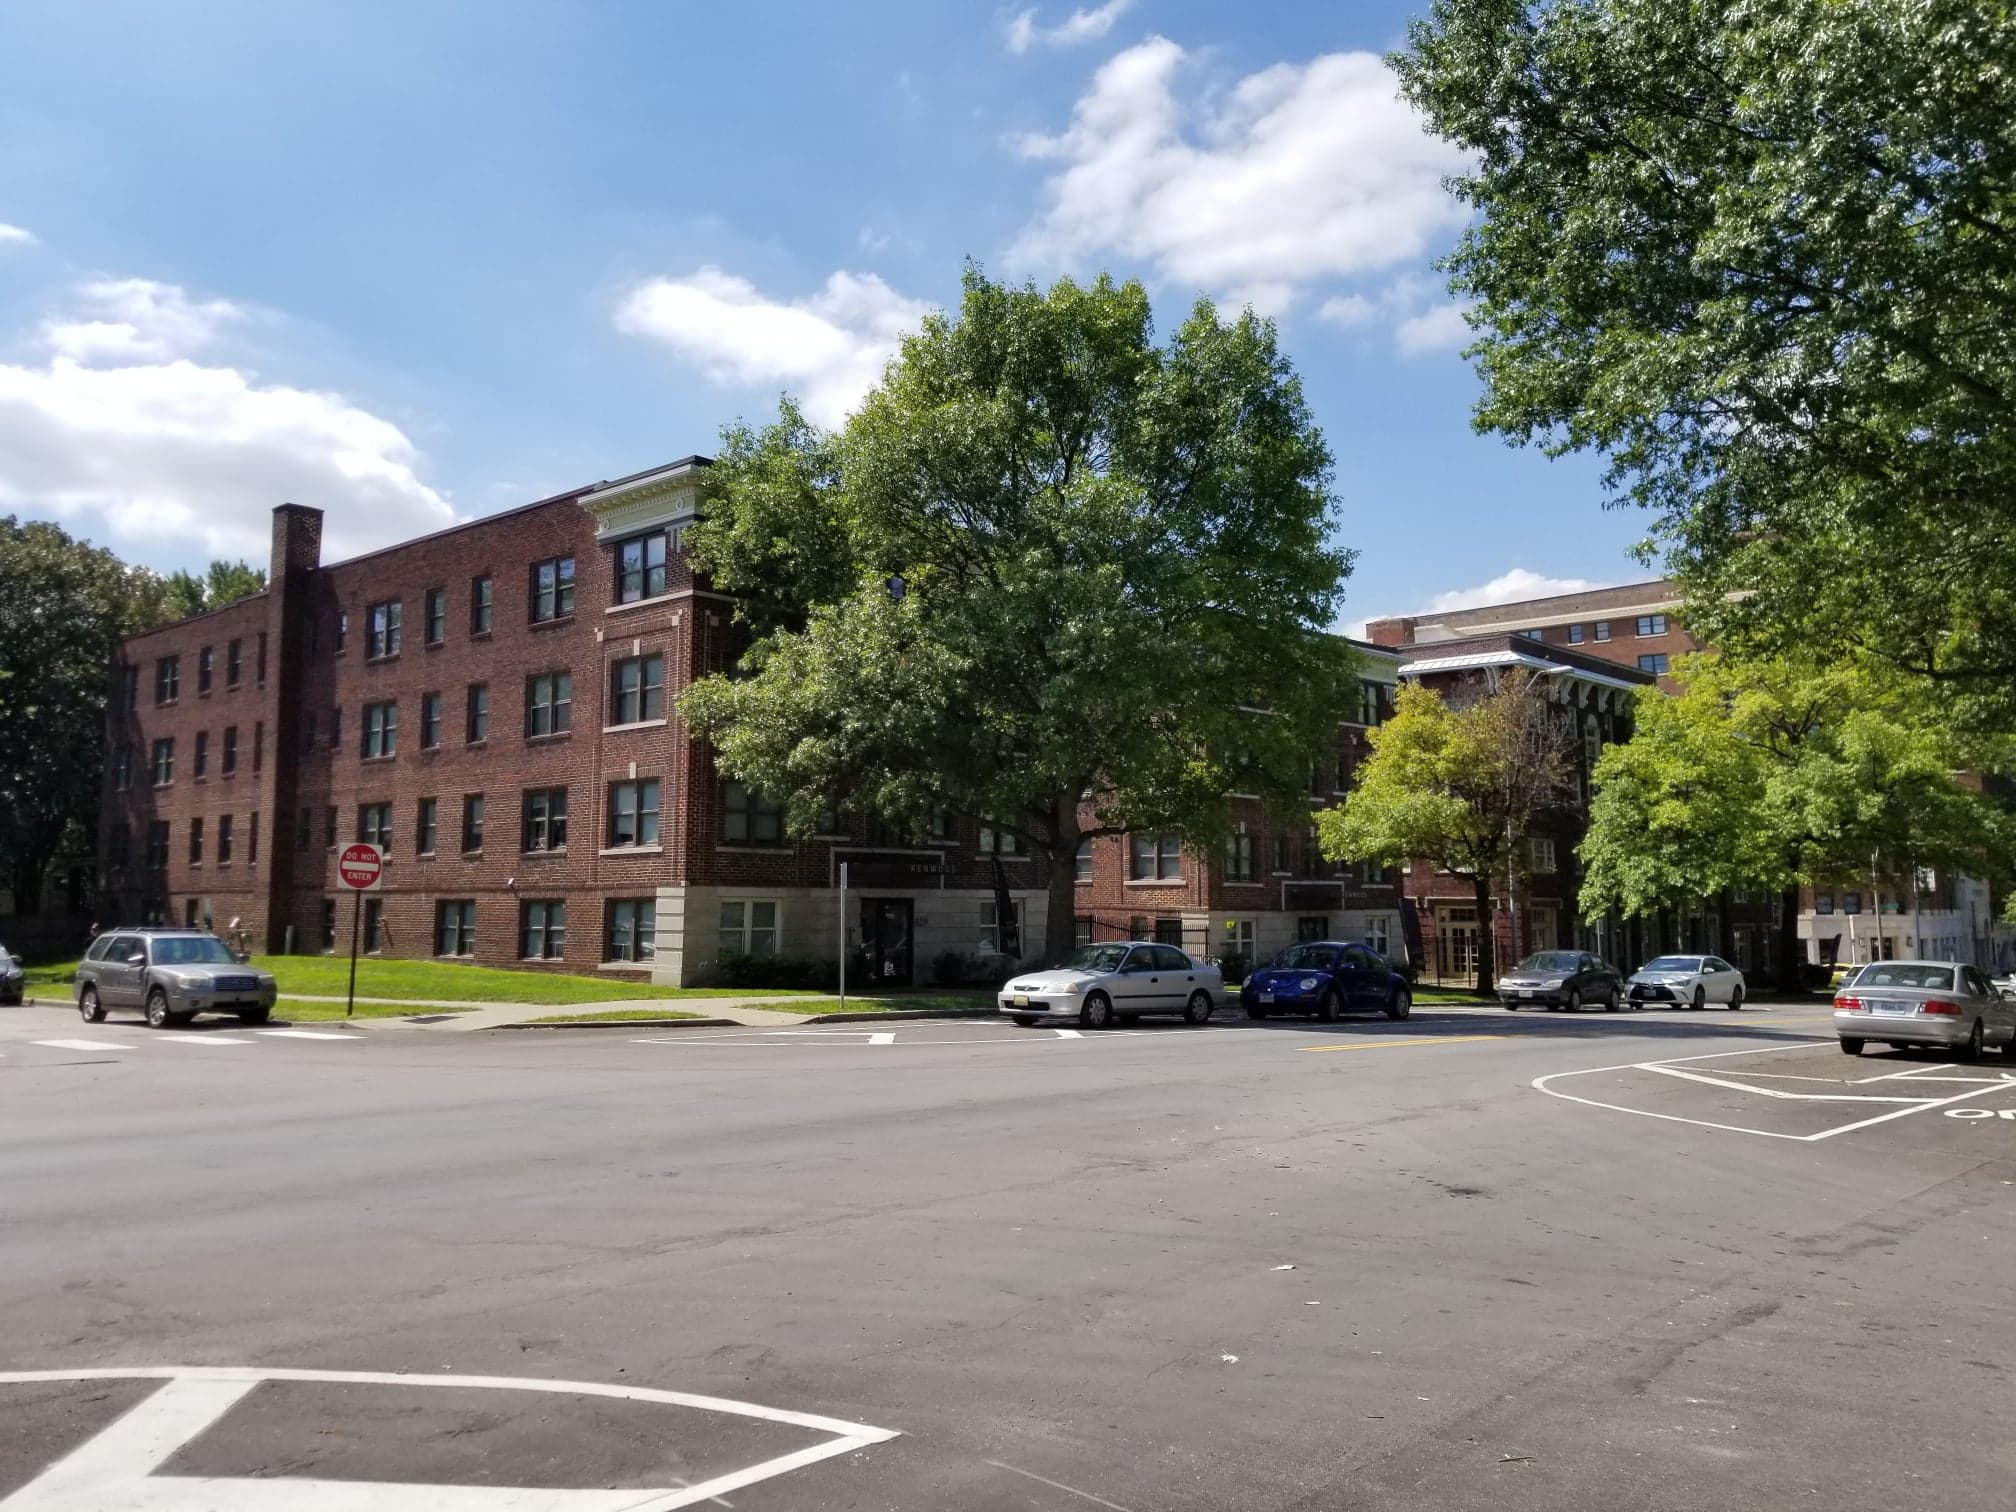
Jose Cantu- Cherry to Holmes
My portion of Armour Blvd between Cherry and Holmes developed very early on. Originally there were 3 large mansion homes that stood out very clearly from the surrounding small homes. In 1914 one of the mansions was mentioned in a Kansas City Star article called, “Beautiful Homes of Kansas City”. In the early 1920’s the entire area was leveled to make room for what is now called the Kenwood apartments, but the Kenwood apartments we see today were rebuilt to hold more people in 1966.
Sarah Davis Tracy Ave and The Paseo
My block was always residential. At one point, there was a church on the southern side of the block, but other than that it has always been single and multi-family homes. For the first time period, 1895, my block was not yet developed but as time went on the north side was completely built and the south side soon followed. 1925 is when the apartment complexes first appeared. My block was originally just meant for the rich and white of the city, but things likely changed in 1925 because multi-family homes were more accessible for lower income residents. The block has been picturesque throughout history. Lawns, landscapes and trees are very prevalent in this area. Although the individual buildings may have changed throughout the years, the overall plan of the block and it’s residential style withstands the test of time.
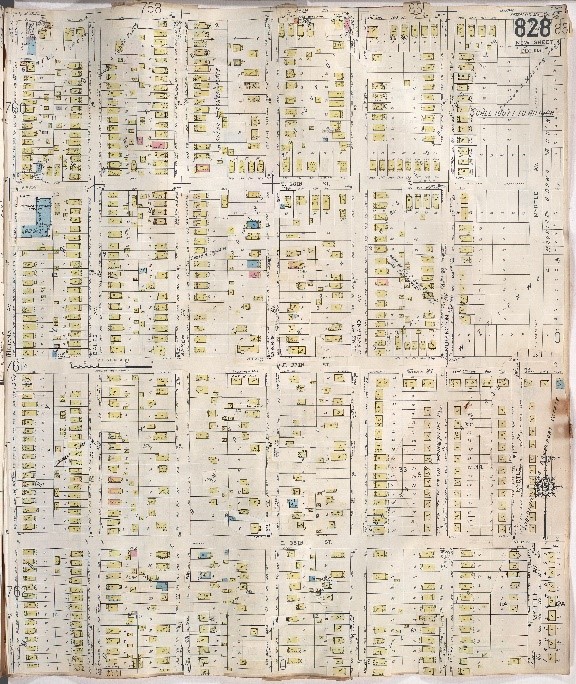
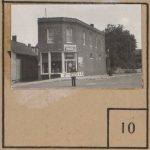
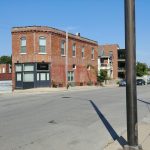
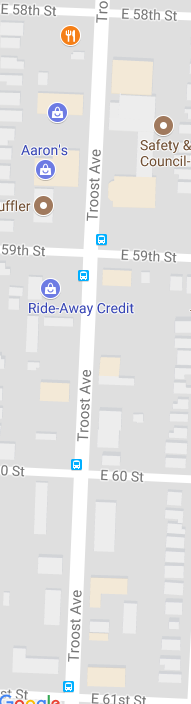
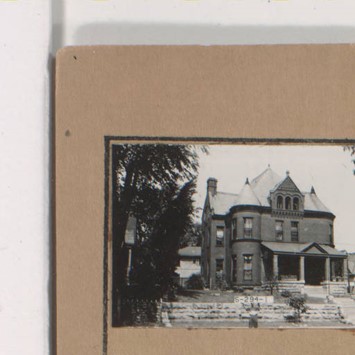
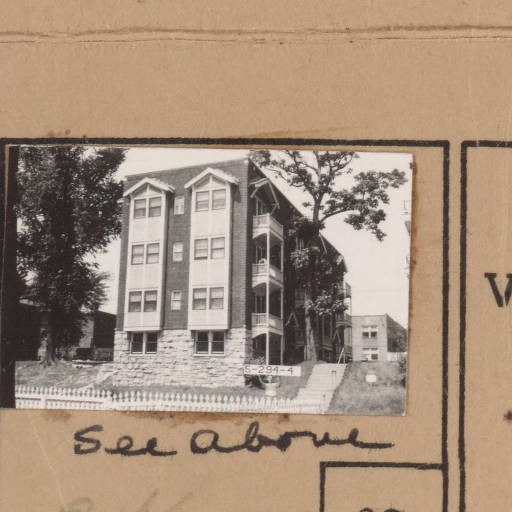
Gilham Road and Cherry Street
The history between Gilham Road and Cherry Street hasn’t changed much at all. Unfortunately, I wasn’t able to find a sanborn map for the period 1895 because my area hadn’t quite been developed yet. Approaching the 1909 period, my area is beginning to develop and buildings are being built. Over time, this area had several apartment buildings, auto stores, churches, schools, you name it! As time went on, some of those buildings began to fade away. Fortunate enough, when observing the area today, a couple of those buildings still exist and are in fairly good shape. Here’s a couple photos of the sanborn maps and pictures that I’ve taken.
35th Street & Chestnut – Agnes
This area has always been a single-family residential community since its annexation in 1897. Since the blocks were filled with housing units around 1925, there has not been too many massive changes to the area. It remains a charming neighborhood in the urban center of the Kansas City Metro Region. Perhaps the biggest change for the community over the past 100 years has not been the development within the neighborhood, but the development outside of it.
It has made a transition from being a quiet suburb on the outskirts of Kansas City, to being part of the urban community due to the expansion of the surrounding suburban sprawl. There are indications of the neighborhood’s age from the large trees and the historical houses which are accompanied by the modern day luxuries we all know today, like power lines, clean sewer systems, and tall street lights. It is interesting to see how a community can transform from suburban to urban and how old can meet new.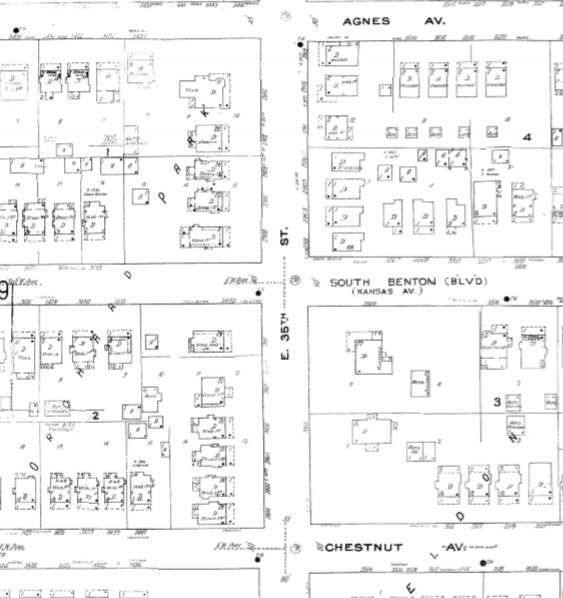
35th and Chelsea Ave
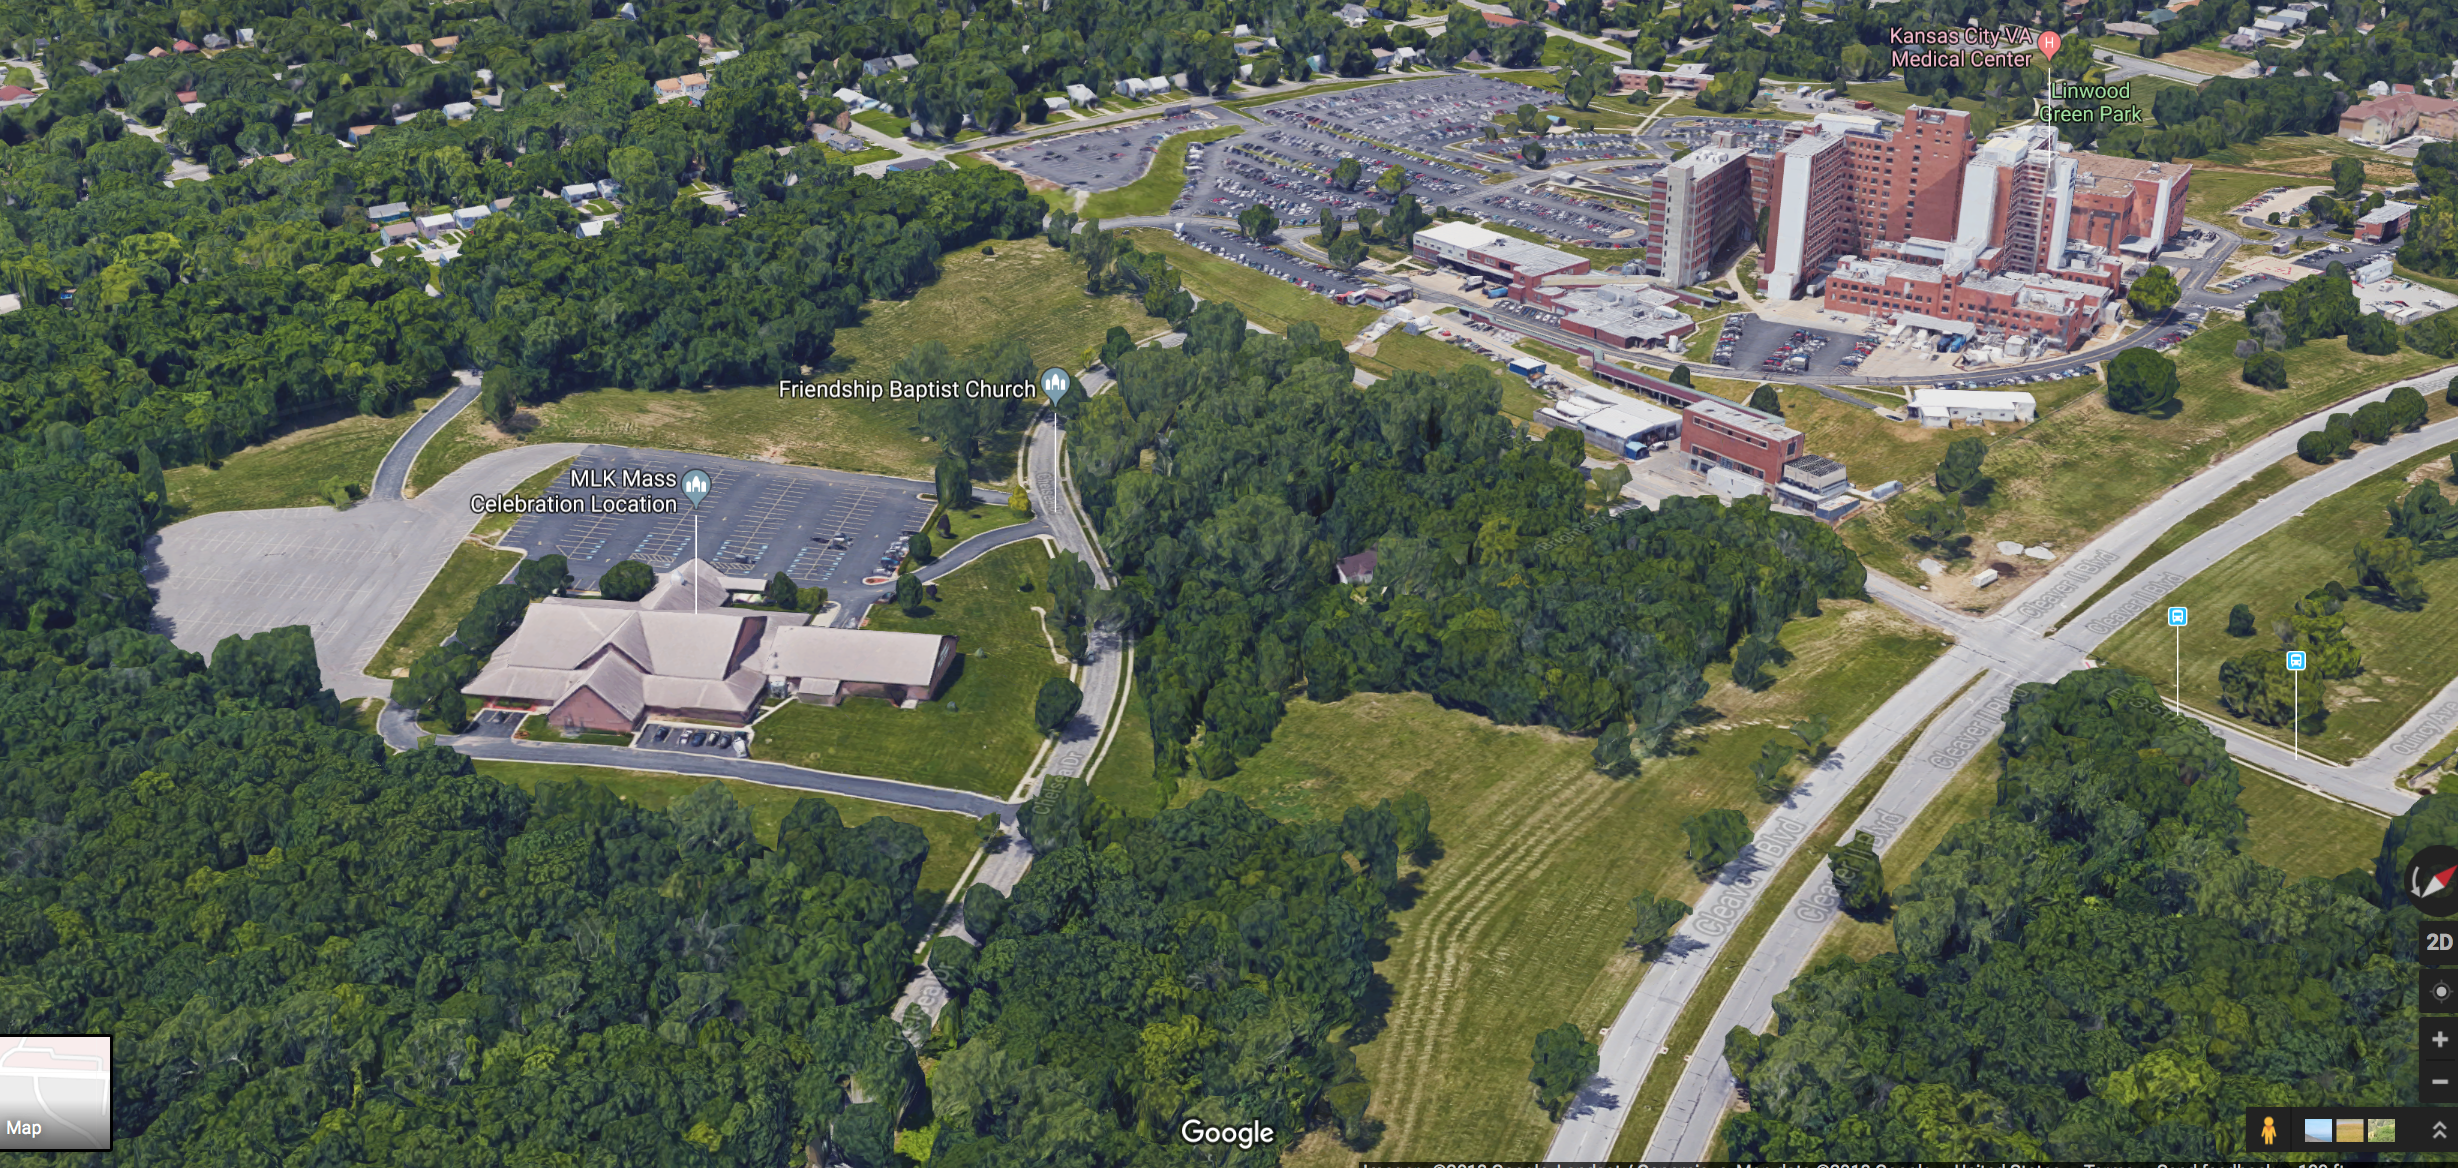
 The block that I was assigned looks at 35th Street between Chelsea Avenue and Emanuel Cleaver II Boulevard. This particular area is east of Troost Avenue, and approximately six miles southeast of downtown Kansas City. Much of it remains residentially undeveloped; only one house exists on the entire block which was built shortly before the hospital in 1948. The Veteran’s Affairs Hospital, which was built in 1952, resides on the northside of 35th street, and across the street on the southside is the location of Friendship Baptist Church built in 1989.
Historic Sites along Walnut and Baltimore
On Armour and Walnut there are numerous large residential properties, some of them registered with the National Register of Historical Places. The reason behind this was that many of them were built by the Armour family in the early 1900’s. However, by the 1940’s most of the residents moved further south as the city expanded. By the wealthy elite moving out of the neighborhood, public entities moved in. For instance, the university’s Conservatory of Music moved into the C.W. Armour Mansion in 1944.
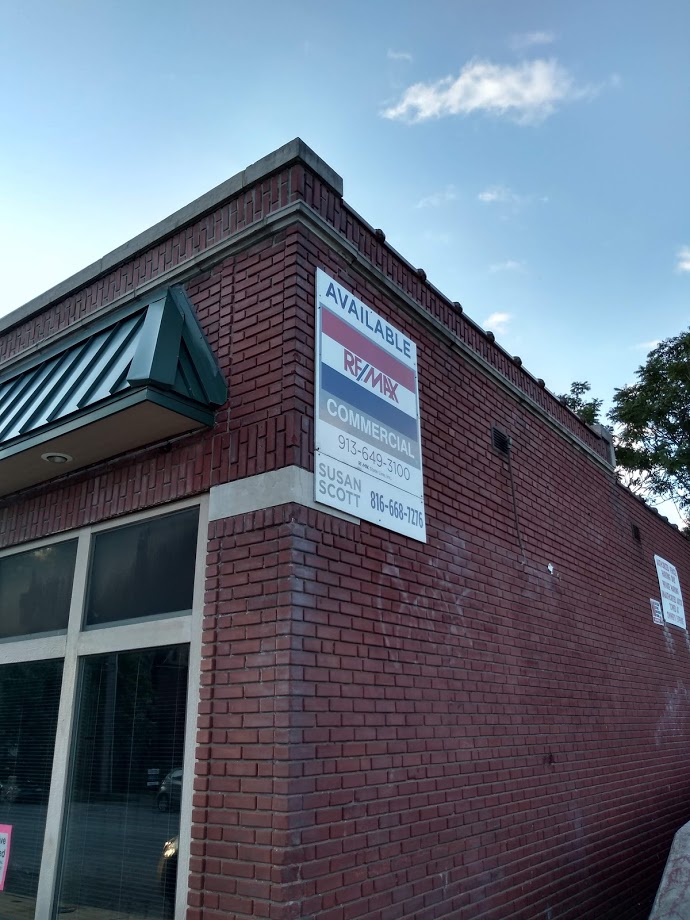
Due to the fact that that side of Main St. was developed, the other side was left vastly empty. Baltimore and Armour didn’t see much growth until the 1950’s, and the area is relatively less dense today. Today you can see old, large scale apartment complexes and empty commercial spaces with “For Rent” signs hanging in the windows.
During the research process, I found loads of information about the Walnut block, while the Baltimore side was lacking. A conclusion can be drawn to suggest that in Kansas City, we favor the history of the white, rich, and powerful, and leave the history of others forgotten.

Agnes Avenue to Benton Boulevard and E. 35th Street
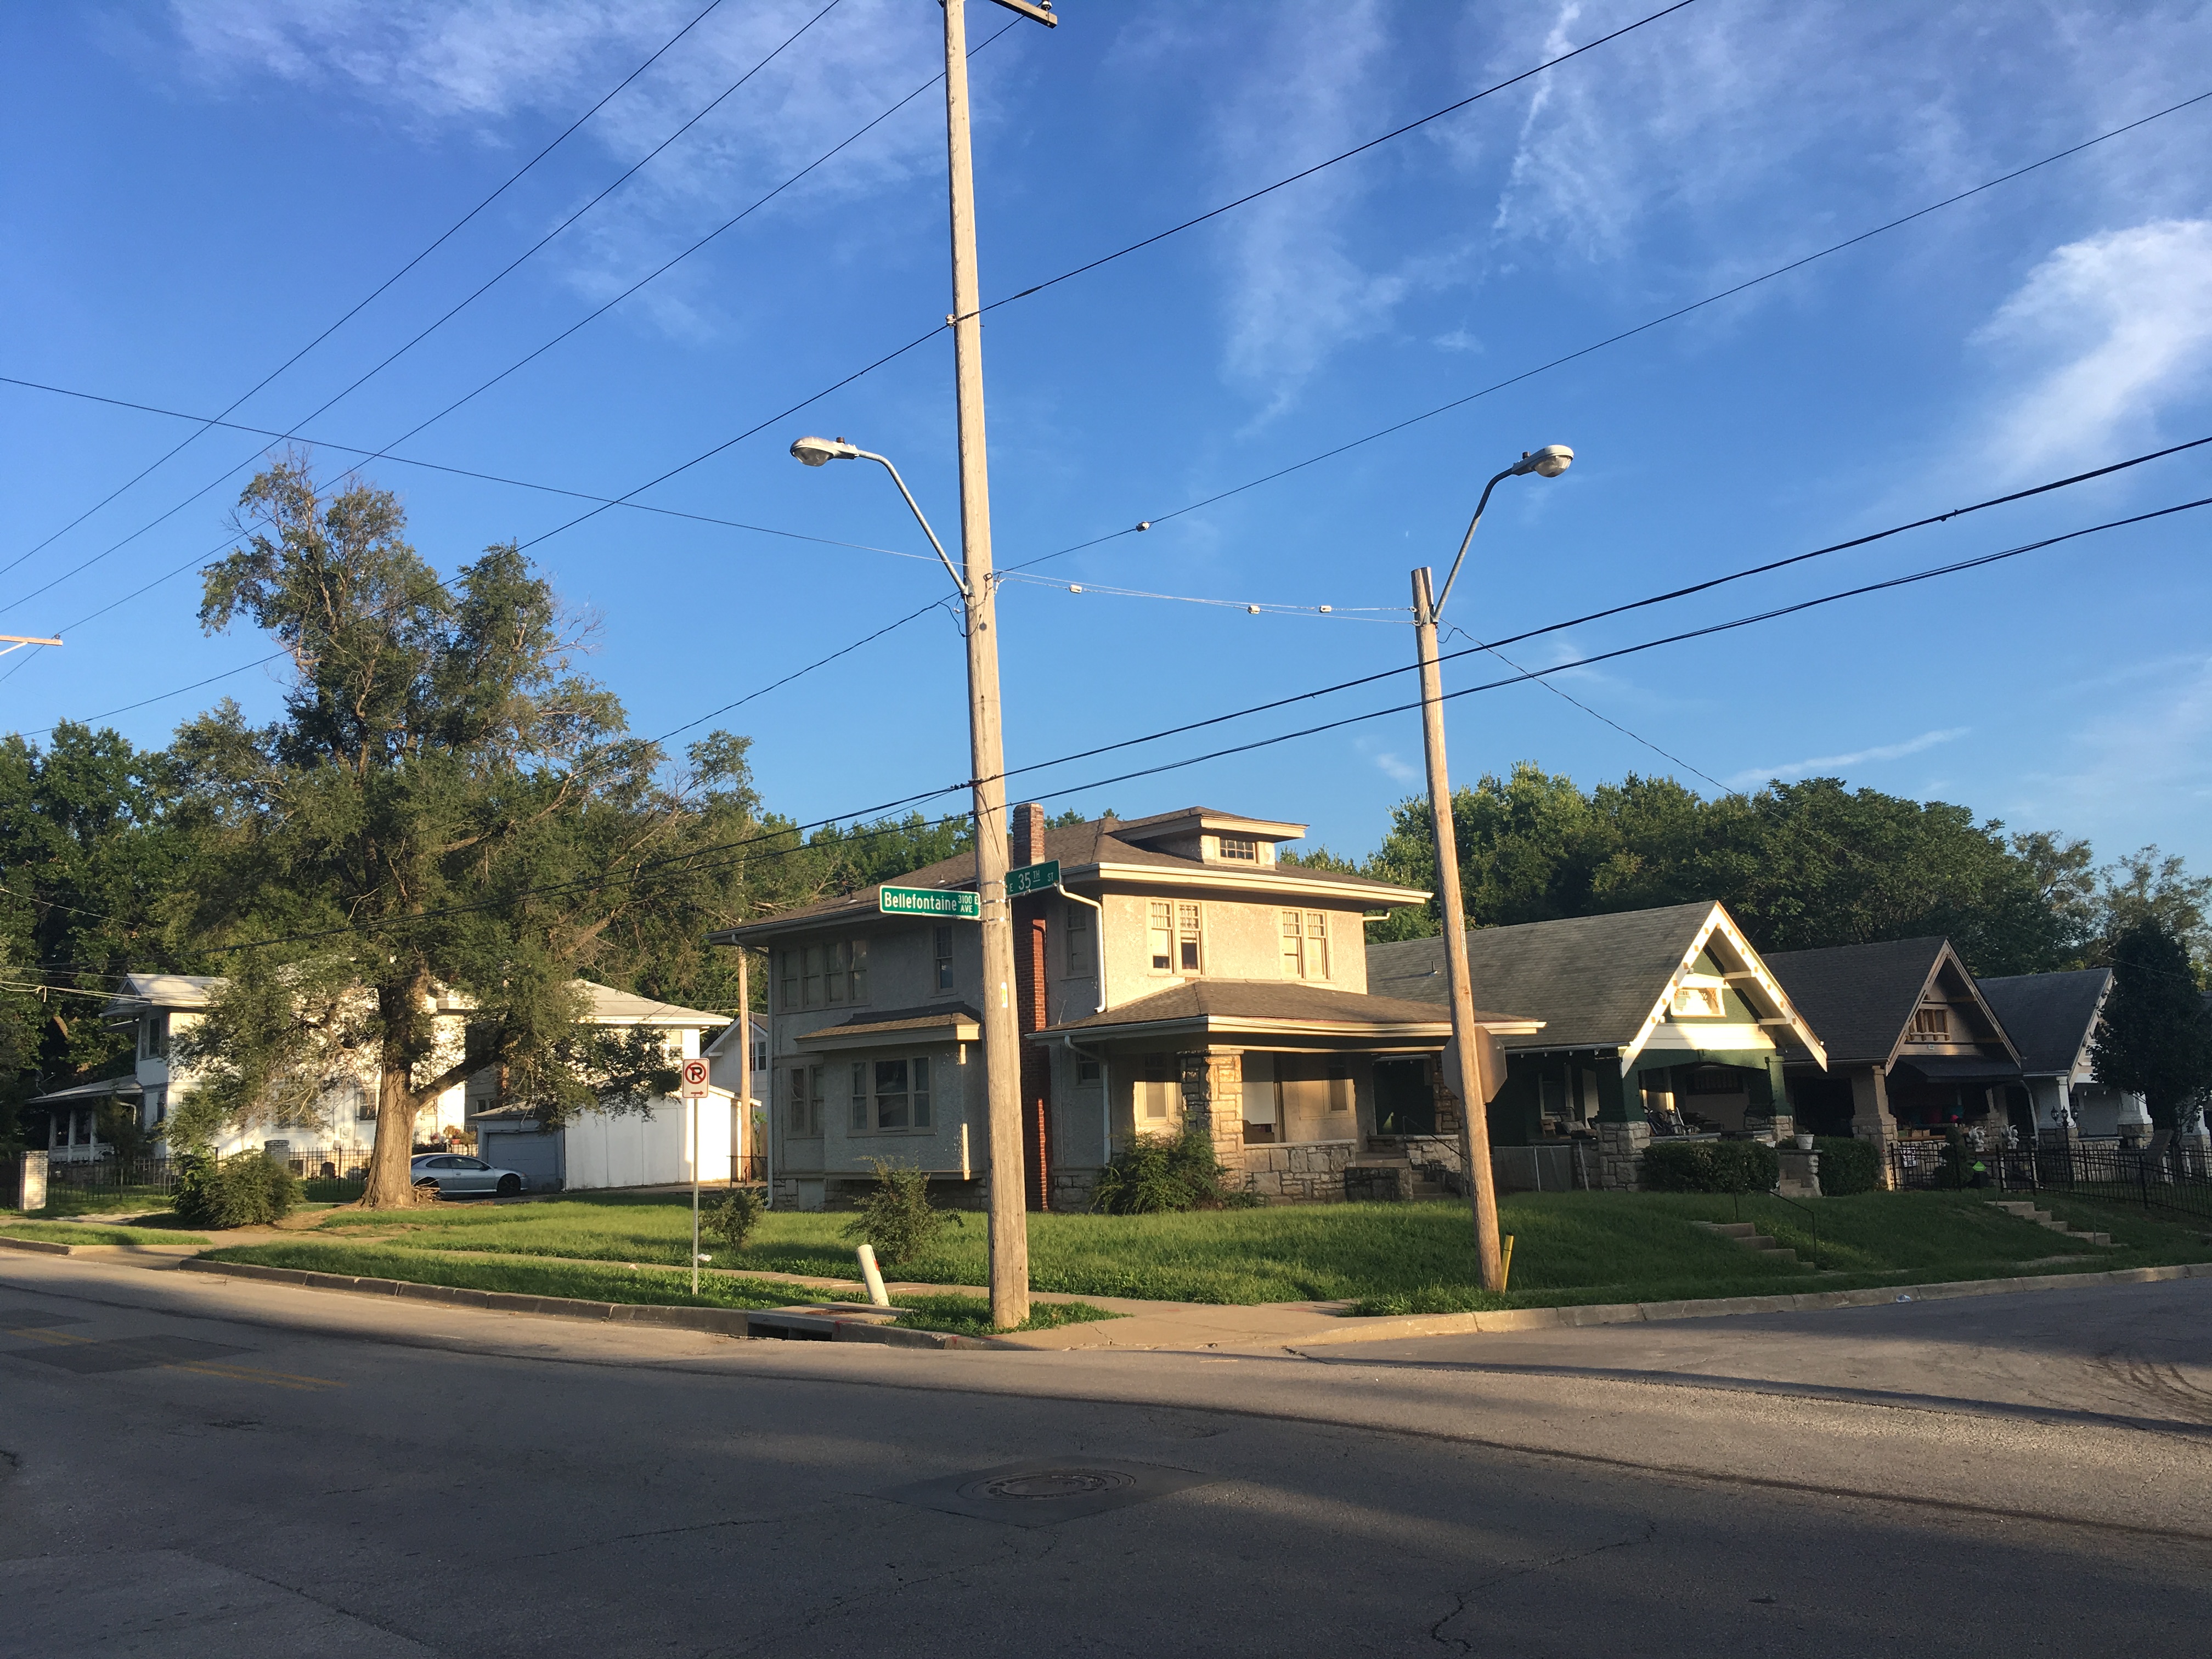
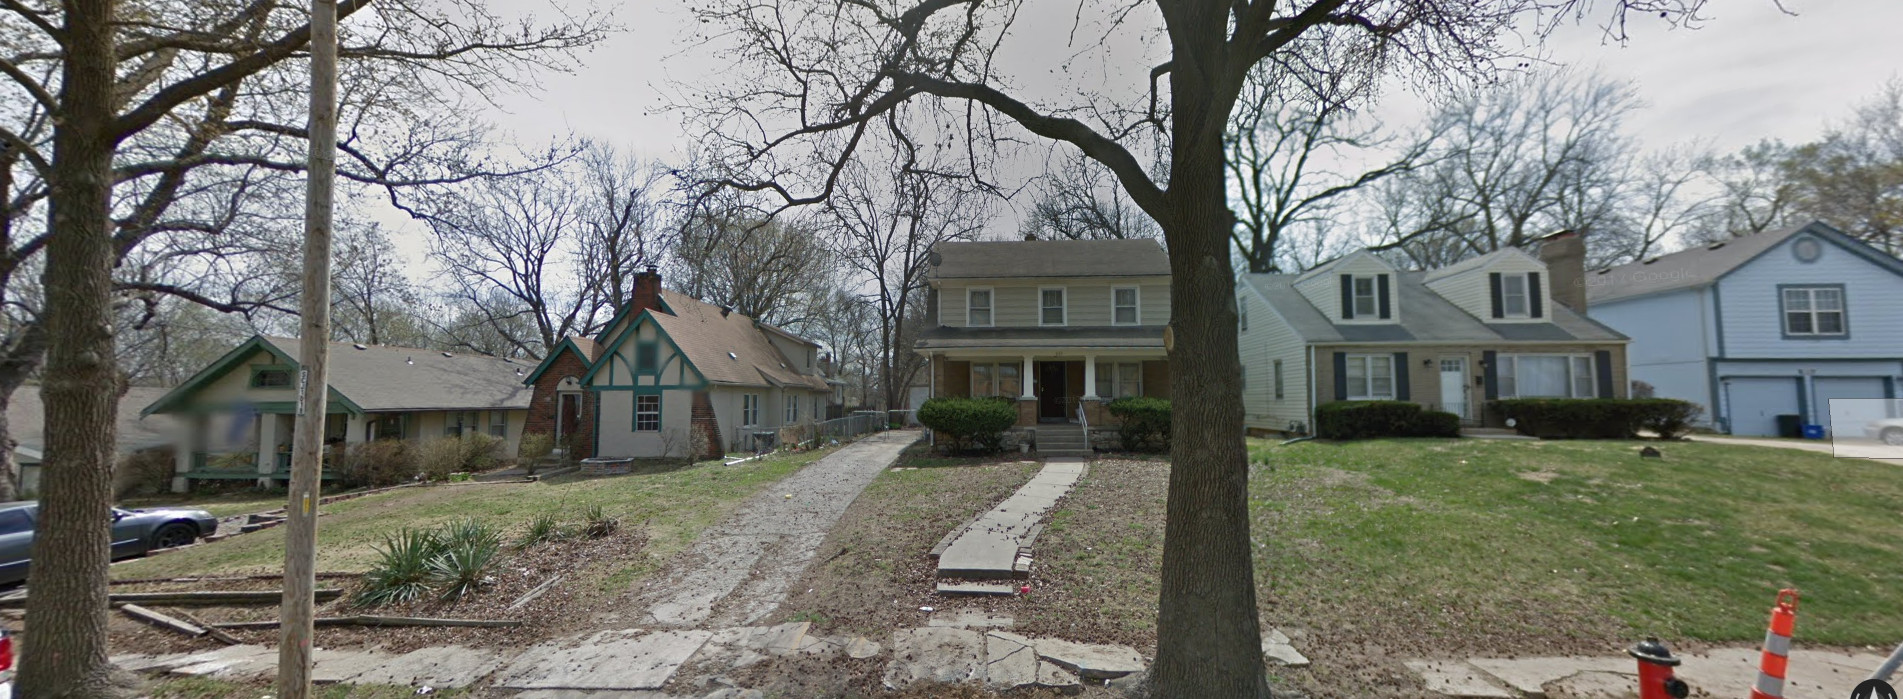
Looking out over the charming streets of Oak Park Northwest, the homes all look very old and very charming. Beautiful blue mansions crown the street corners. While doing my research on these particular area of E. 35th Street, I became aware that these primary observations were valid. Although at the turn of the century this portion of E. 35th St was undeveloped, by 1925 the area was completely filled with residential housing that remains much the same as it is today. The majority of the homes lining Agnes Avenue, Bellefontaine Avenue, and Benton Boulevard have been there since before the 1925 Cencus. Only one home along the block dates to a newer time than the 1910s and 20s. This gives the streets an untouched, historical flair.
New Semester, New Researchers
Posts below date from Fall 2017’s UPD 260 class that researched Troost Avenue. Posts above will document Fall 2018’s UPD 260 class’s research along Armour Boulevard/35th Street.
25th and 28th Street
Between 1950 and present day many demographic changes occurred due to urban developments in the Kansas City area. Adjustments made to the city are directly reflected in the changes that appear in the annual census reports. Crowded cities were extremely common in the 1950s and the earliest census tracts records held very high population density levels. Due to laws held in certain neighborhoods people other than whites were restricted from residing there which heavily swayed the demographics. Due to suburban developments the number of houses in urban areas took a major decrease and it was evident in the census reports.
Troost Avenue and 34th through 37th street
Kansas City is the heart of America. Troost Avenue runs north-south, cutting the city in half while also serving as a racial dividing line. I am analyzing the development over time of Troost avenue, focused specifically on 34th through 37th street. The time periods examined for this project are three years in specific, 1950, 2000, and 2010. The 3 levels that these dates were each examined by were the Census Tract, Kansas City level, and for 2010 only, the Metropolitan Statistical Area. For each year at each level, the general population info, demographics, and housing info were examined. The census tracts that corresponded to my designated area, were tracts 50 through 53. From 1950 to 2000, and from 2000 to 2010, the total population in each of the tracts decreased tremendously. The total population for the year 1950 had the largest total population out of all three years that were examined. In terms of the number of housing units, as a whole we see a decrease of units from 1950 to 2000, and 2000 to 2010. The only exception to this would be tract #51 from the year 1950 to 2000, for the number of housing units in this tract actually increased from 964 to 1,123 units.
https://docs.google.com/spreadsheets/d/1HG6fS-u_X5ltYrMlVpOjR2JzlGKARBcON2qNlL0GYw4/edit#gid=0
Troost Avenue
The area east and west of Troost Avenue between 78th St. and 82nd Terrace has changed drastically from 1950-2010. This part of the land is divided into three census tracts, 90, 94, and 95. In 1950, all three census tract areas were predominately white, wealthy, homeowners. In 2000 and 2010, that had changed drastically to predominately black, lower-income, renters. The most noticeable change was the census tract north of 79th St. It had the sharpest drop in white population, while the area south of 79th St. was much less significant, retaining most of the white population.
Demographics of Troost Avenue 55th St to 58th St
The two census tracts (81 and 82) illustrates well the shift from what was previously a wealthier, homogenous outer section of the city into a more divided and generally poorer area. In 1950 the two tracts were each more than 99% white, but now west of Troost is just barely 80% white, and east of Troost is almost 88% black. High school graduate rates have gone up in both tracts, but west of Troost has a much higher rate of higher education.
A nasty correlation to the demographic shift is that the west side has twice the median house value and almost twice the median income. This trend illustrates the great power of Troost as a dividing line and the implications of living just a block over.
Census Data of Troost Ave. 10th-13th Street
The 1950’s was the prime time for Troost Avenue, but it has only seemed to decline over time. Data was collected from the Social Explorer website and was pulled from census tracts on Troost Avenue, between 10th and 13th street, Kansas City, Missouri, and the Metropolitan Statistical Area (MSA). Since the 1950s, majority of the population in Kansas City, the metro area, and the west side of Troost has remained white, but the east side of Troost Avenue has steadily continued to grow in its black population. In 2000, over 92% of the population on the east side of Troost Avenue was documented as black. On the other hand, only 12.5% of the population of the metro area appears to be of the black population. The data collected express that majority of the metro area population is of the white population and the small amount that is of the black population is settled to the east side of town. Over the last 60 years, Kansas City appears to have become more diverse. Kansas City, Missouri has gone from over 87% of a white population down to 59.2% and has over 10% of a population that defines themselves as other.
Columbus Park Education vs. Income
The area I researched was 4th through Independence Ave. It involved only one Census Tract (lucky I know). It seemingly followed most of the same trends the other areas had. I adjusted the Median income for inflation and compared the Tract level to the KCMO median income. Further, I compared the education rate from the Tract level to the KCMO.
In summary, as time went on the education rate of Tract 3 ROSE higher and closer to match that of the city level, while the income rate compared to the city DROPPED significantly. Wow. What’s wrong with this picture?

Census Data Analysis – 18th Street to 22nd Street
The Kansas City Metro area has had periods of growth and decline like any other city. These changes are apparent in the city census data and in census tracts. This paper will analyze those changes in the Greater Kansas City area, Kansas City, MO, and an emphasis on Troost Avenue from 18th Street to 22nd Street. The main focus will be between the census tracts, one on the West side of Troost and the other on the East side. The race, median income, and median age are all very important categories that help shape our understanding of what has happened on Troost over time.
Volker to Brush Creek
Exploring this part of the city and its physical environment over time through maps and on foot left me wondering about the citizens and their living conditions. Through census analysis this picture became slightly clearer. However, the optimism I felt after the previous historical analysis quickly came to an end while I poured over the numbers that shined a light on how truly divisive this street has always been. During the 50’s the prosperity and education were equal on both sides only to a population that was nearly 100% white. By 2000 the line was drawn and while the West side continued to flourish the East continued to decline.
After finishing the project my feelings on investing in public education became even more strong
Census Analysis Report : 1950, 2000, 2010 (Troost Ave. Brush Creek to 43rd St.)
My research was over census analysis in 1950, 2000 and 2010. During the time of 1950 from Brush Creek to 43rd St were dominantly occupied by white alone only about one percent occupied by African-American. But the educational attainment were very surprising for example the most population were people with high school education level. But after 50 years everything were changing. The race distribution in the year 2000 were somehow very diverse. The African-American population increased dramatically and many other race emerged. Educational Attainment in 2000 were better and many people had some college level and also high school graduates. Renter in the Housing unit also increased. In 2010 the environment even became diverse and the percentage kept on increasing. The educational Attainment gradually increased such as people with bachelor, master, doctorate and professional degree, Renter in that area increased rapidly but not owner occupiers.

Census Report: Troost Ave. 25th Street- 27th Street
Troost Avenue is a main artery that runs north to south through Kansas City, Missouri and though it appears to only be a road it is also representing a defined dividing line of people in the city. Through the use of census data from the years 1950, 2000, and 2010 a comparison of the census tracts 41, 42, 43, and 162 will show the differences and similarities of people on both sides of Troost Ave. from 25th street to 27th street and why a new tract arose after 2000.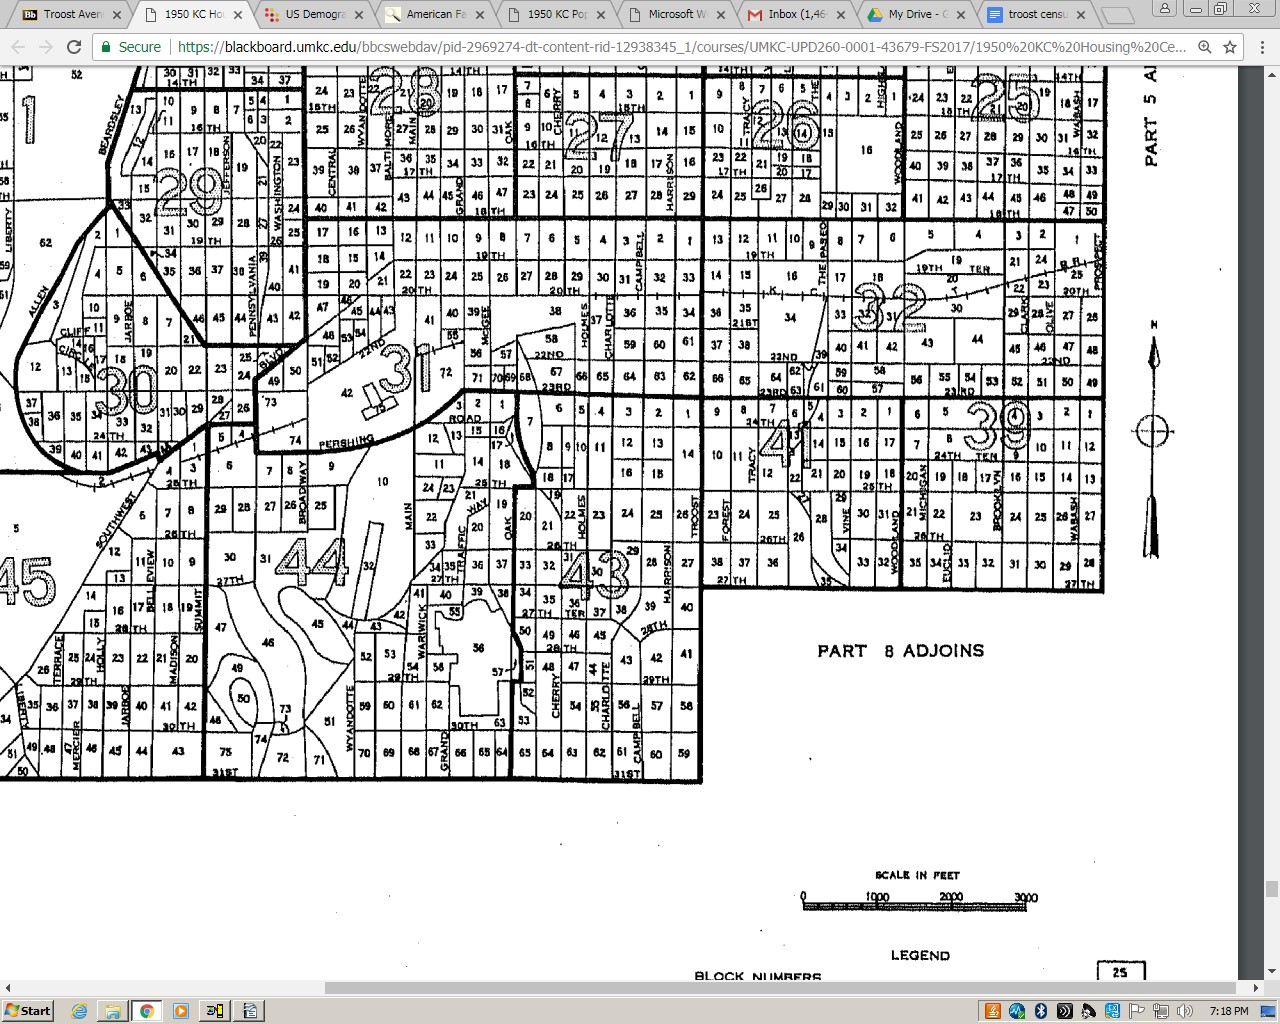
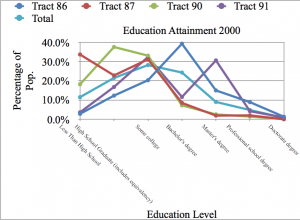
Education Among Predominately Black Community Lags Behind
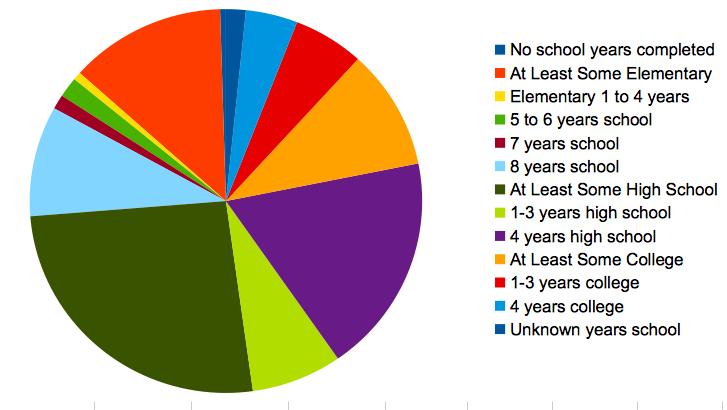
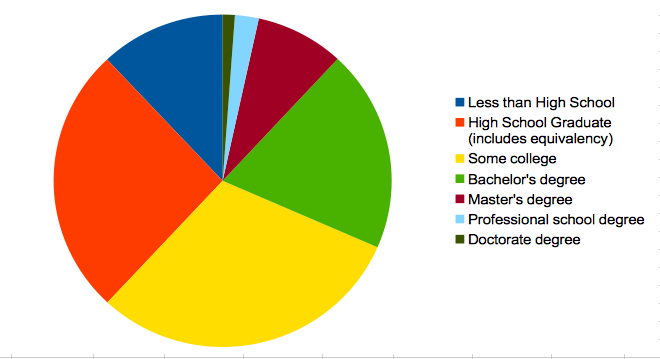
Poverty and education are incredibly linked to one and other. One can directly determine the other in most cases. In the Graph, it shows the educational attainment for 4 blocks along Troost, tracts 86 and 91 on one side and 87 and 90 on the other. From this figure, we see that on the side with 86 and 91 have a high educational attainment, with the majority having at least a bachelors degree or masters. The other two show a very different story, with the majority having a high school diploma, if that. It is not surprising that the less educated side is the side that almost half the population is impoverished. It is also not surprising that this side is 88% African American. This is yet another ripple in a long history of social injustice and is a huge indicator of the negative feedback loop which is this community.
Census Data Analysis: 31st to 34th and Troost
My report examined the four blocks on Troost that included 31st to 34th street, there is Linwood Boulevard as well. Up until 1953, the area was along a major streetcar line. One conclusion I made in the report had to do with the difference between the census tract on the west side of troost and the census tract on the east side of troost, in regard to number of housing units. In 2010, the western tract had 2,402 total housing units in comparison to the eastern tract’s 677 total housing units. I concluded that this was due to a distinction of blight and high rates of vacancy. So most of the housing units that the east side did have, have been demolished, instead of renovation or any other alternative in an attempt to save already low housing values in the area.
77th and Troost
My Troost
Chainy J. Folsom
For my post I selected several geographic images of the 77th and Troost area.
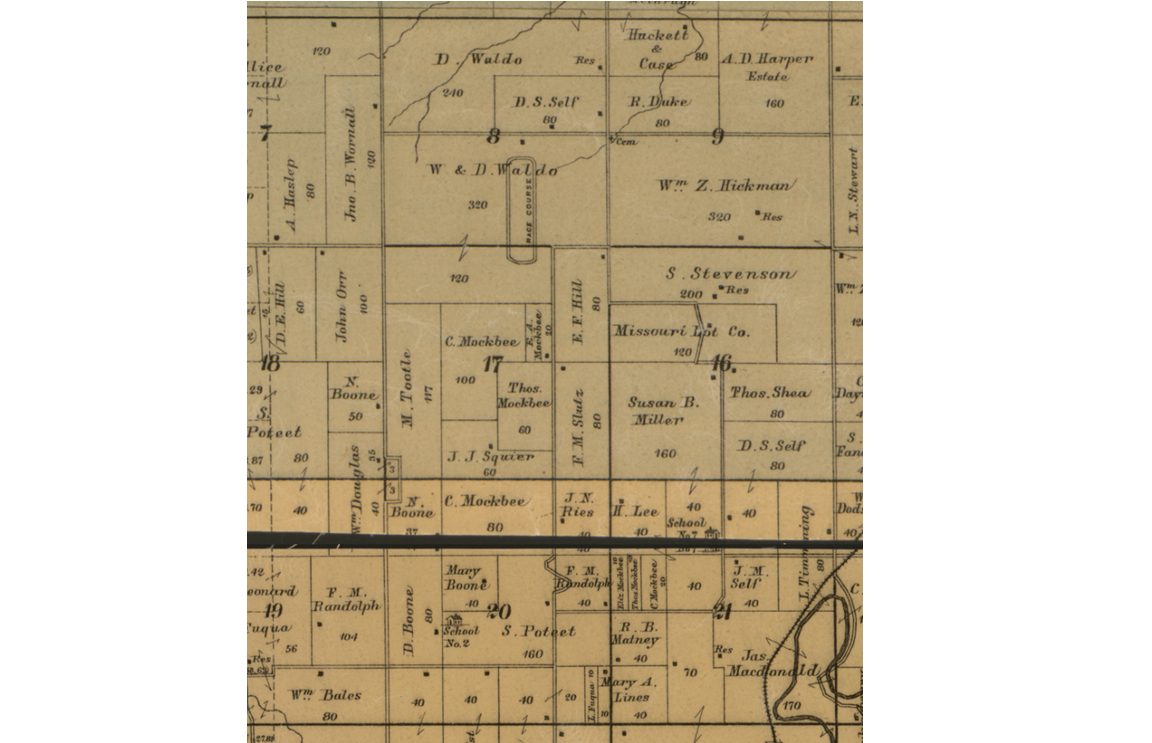
Edward’s Map for Jackson County Missouri, 1887.
It is possible to make out the owners’ names within the lots. Note several names prominent in the Kansas City development history; Waldo, Wornall, Boone, and Hickman. Find the Thos. Mockbee 60 acre lot at the lower center.
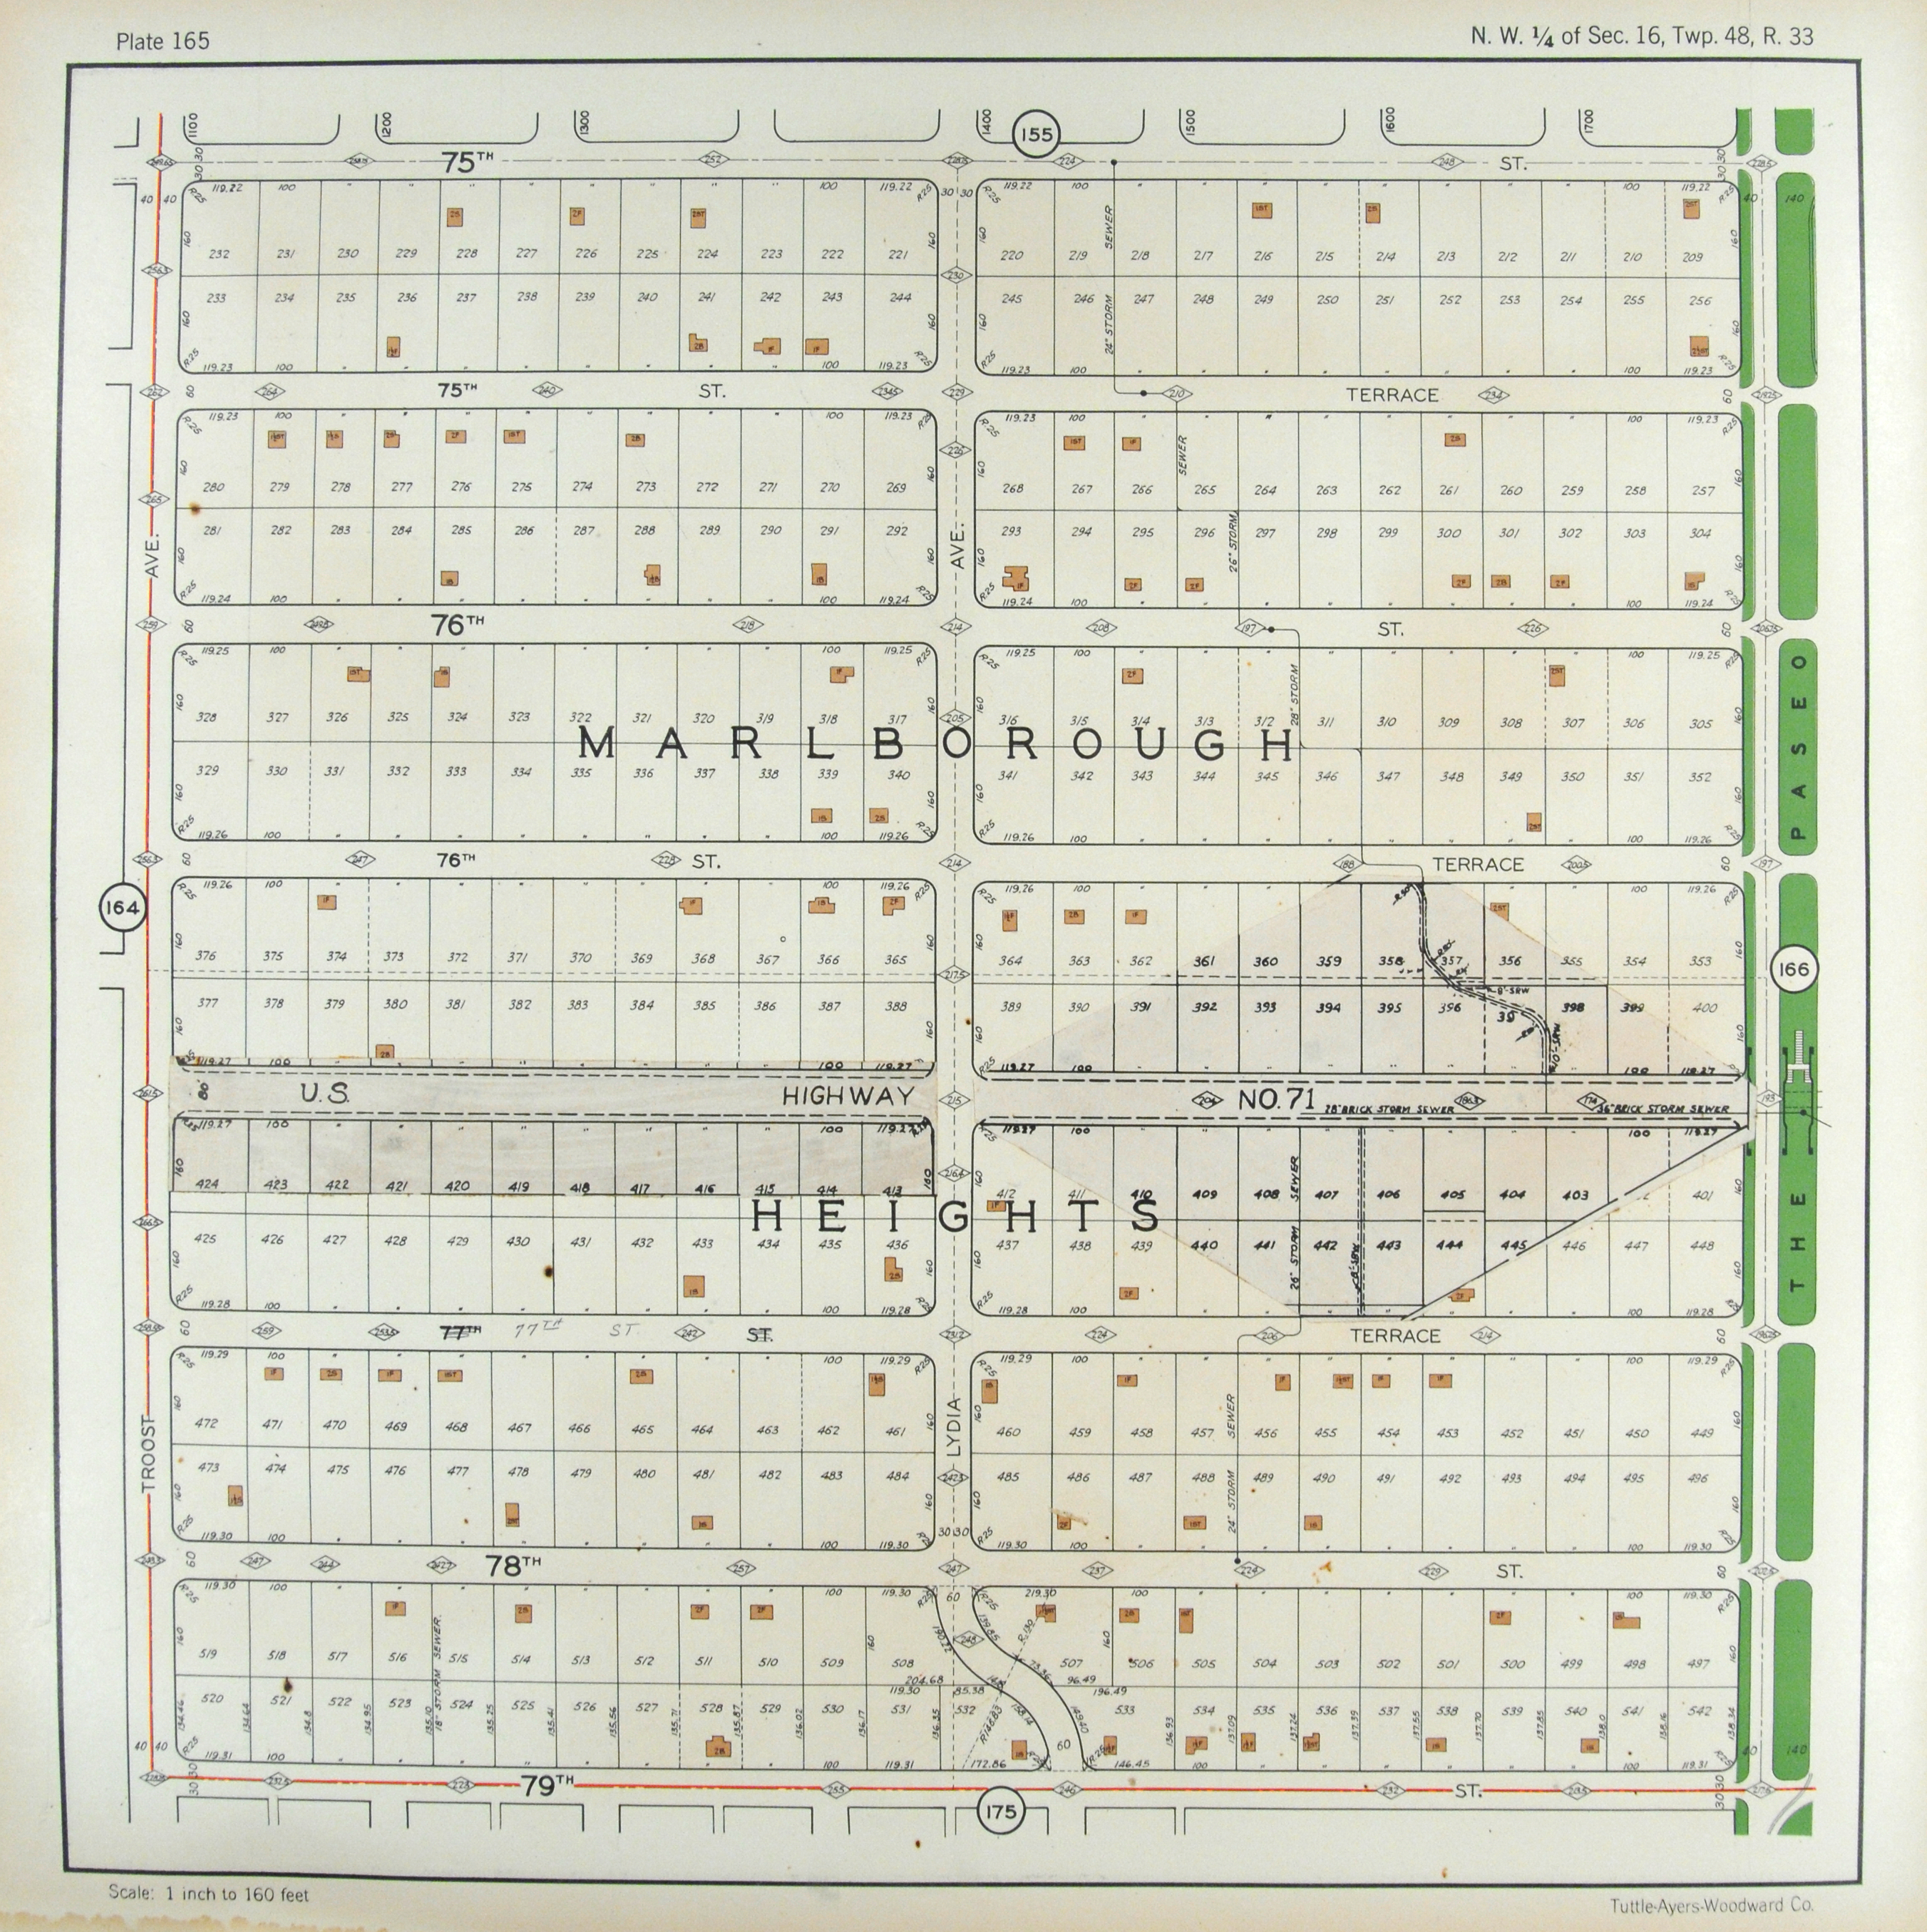

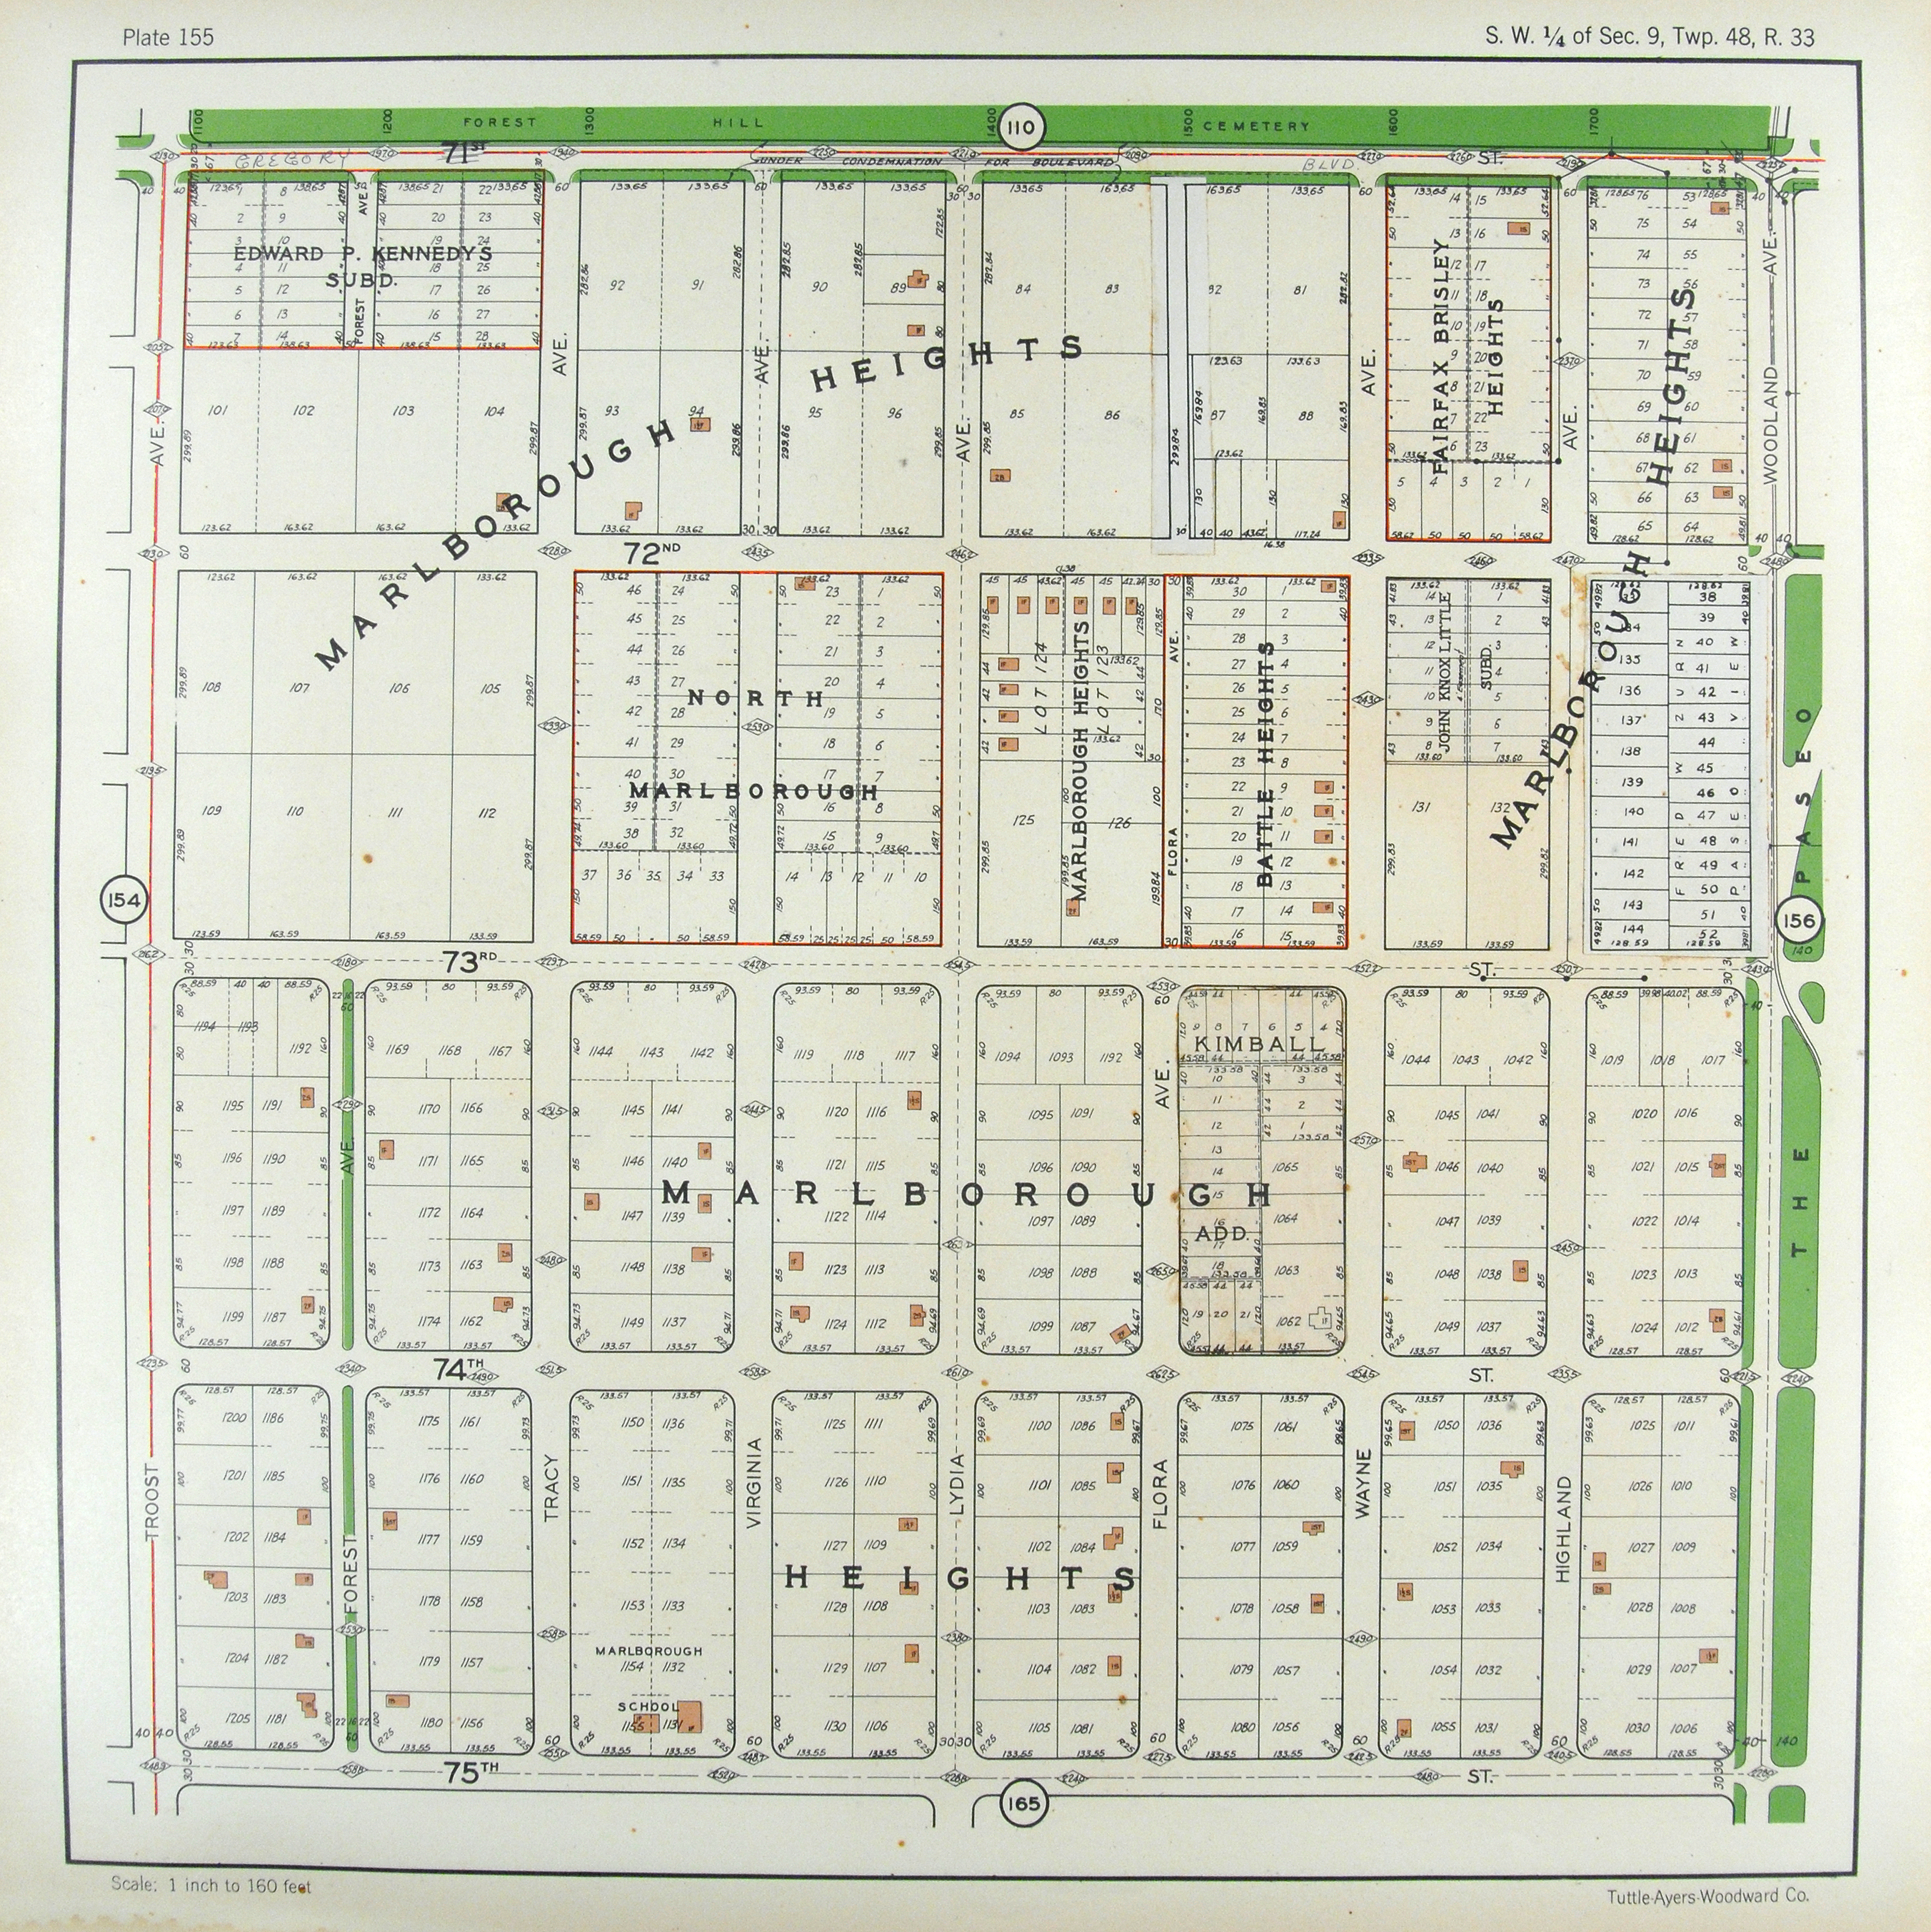
The area as represented in the 1925 Atlas of Kansas City. Thos. Mockbee’s lot is in the lower left map. The lot has been subdivided into 40 acre and 20 acre lots.
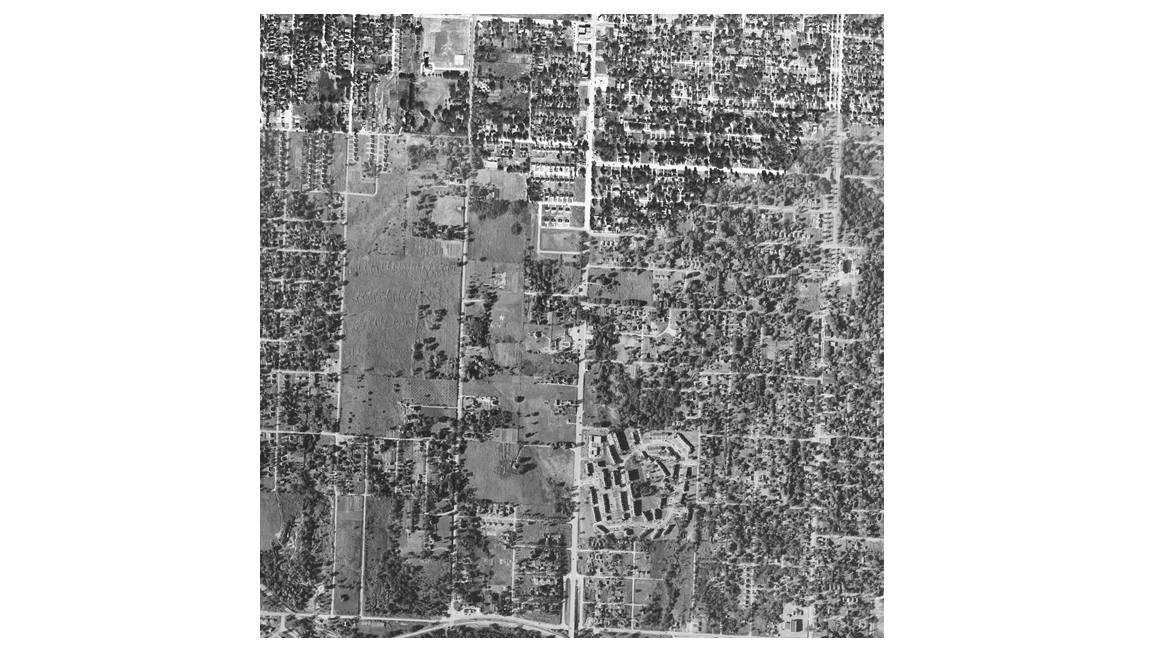
1948 USGS (1948-08-24 – 1948-10-19)
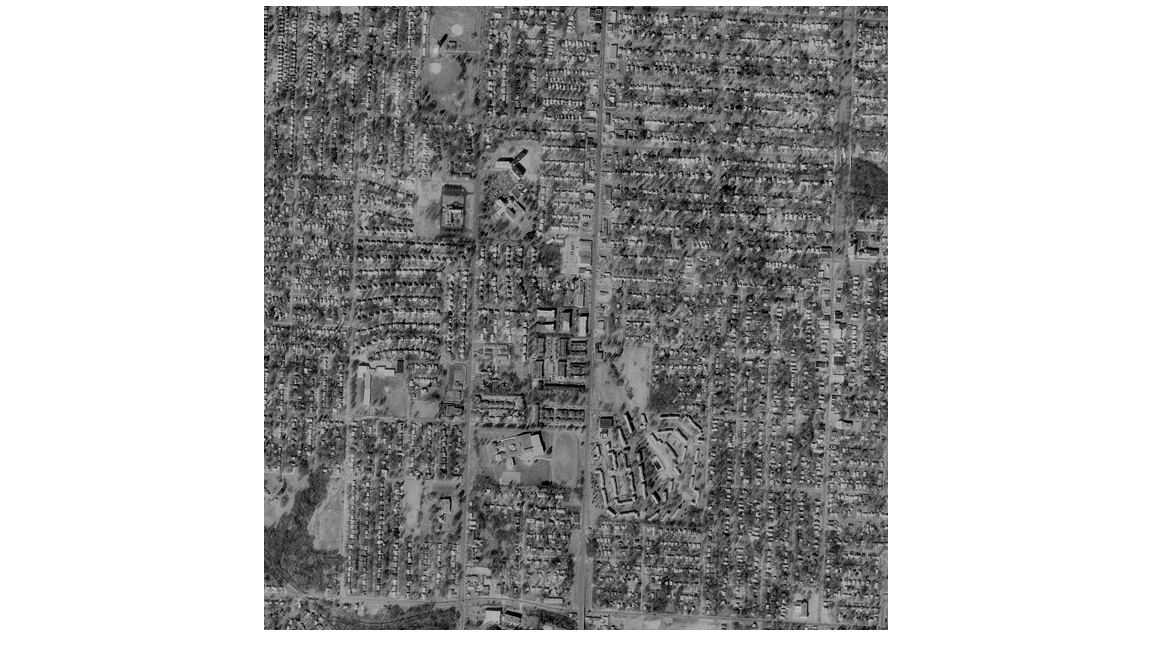
1996 USGS DOQQ (1996-02-10 – 1996-07-18)
 2012 USDA (2012-06-05 – 2012-06-29)
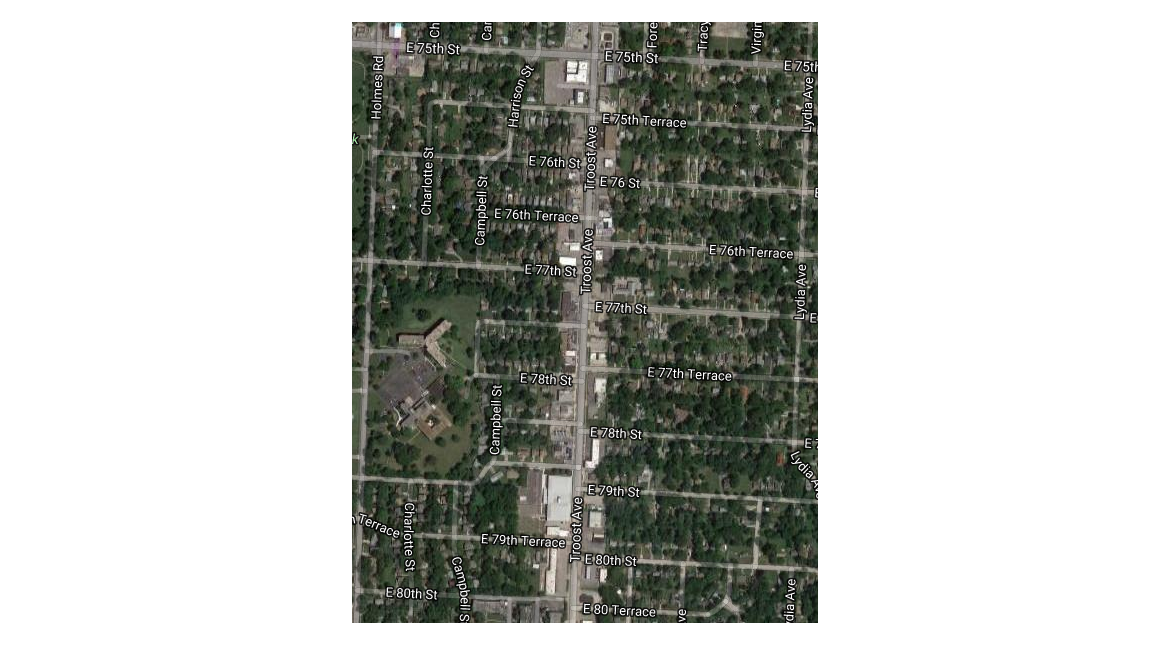
Close up from the 2012 aerial photo. 75th and Troost is at the center top.
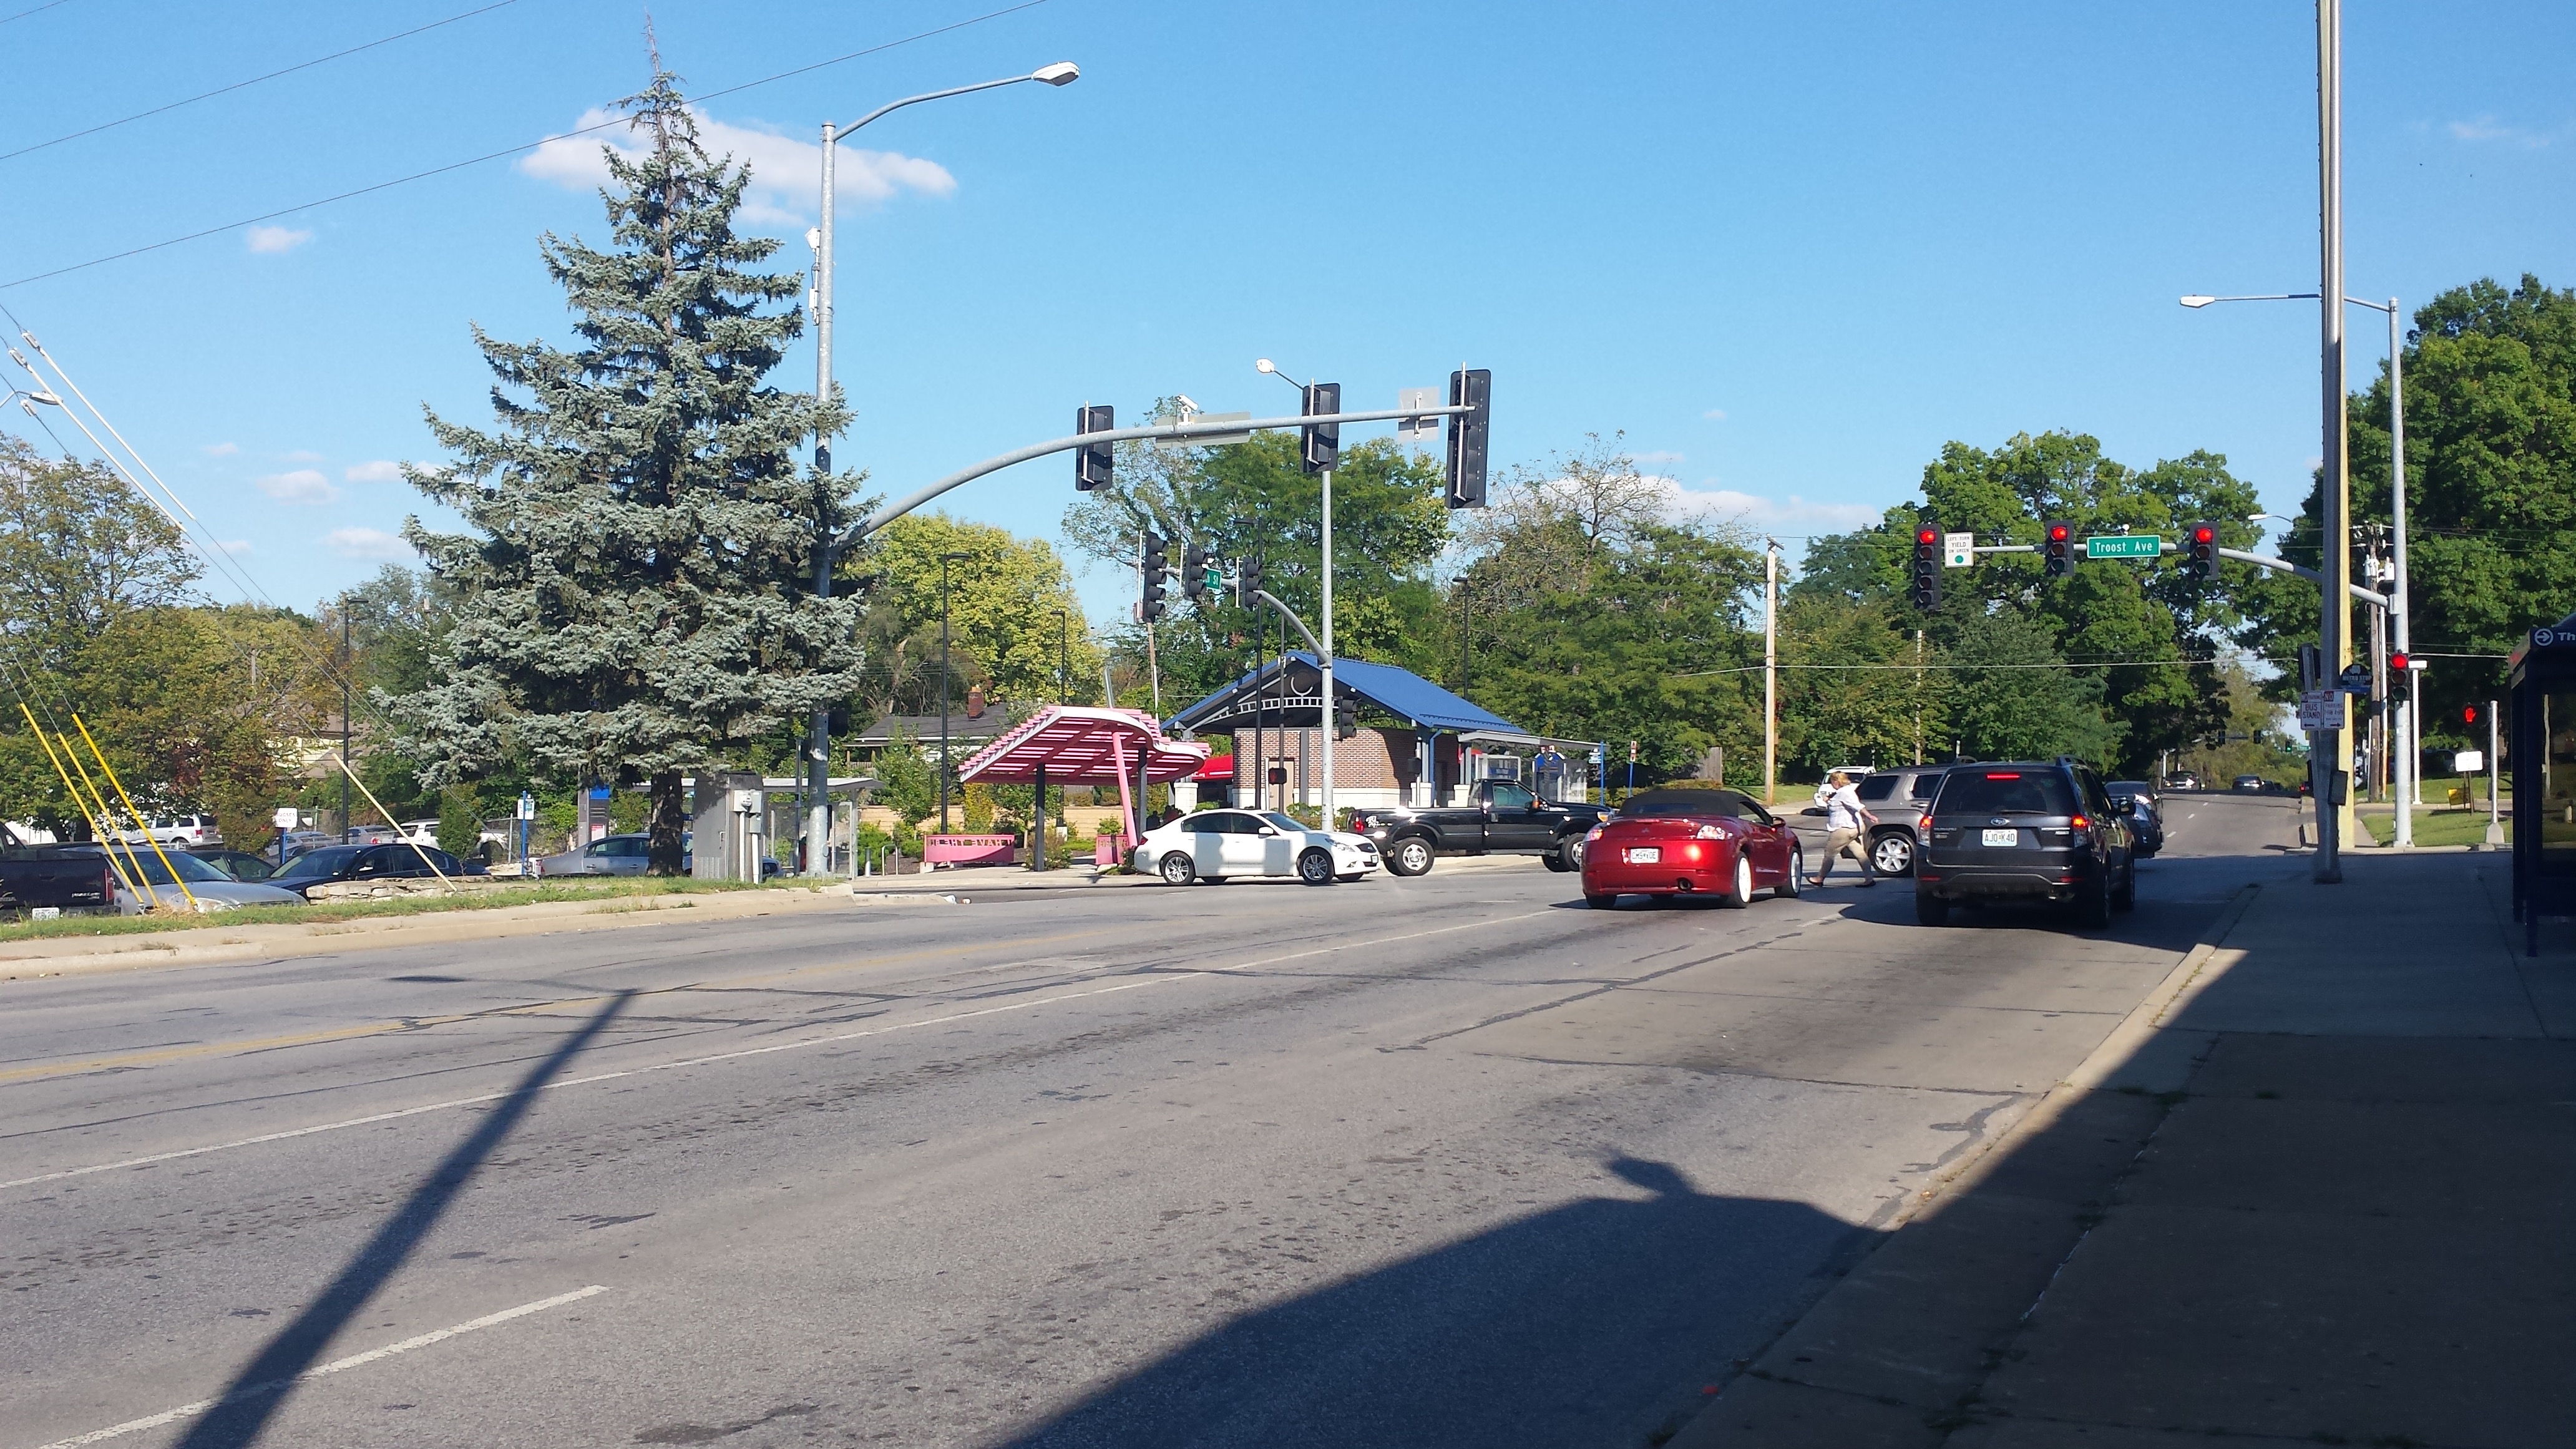 Looking east at 75th and Troost Intersection today
 Looking north at 75th and Troost intersection.
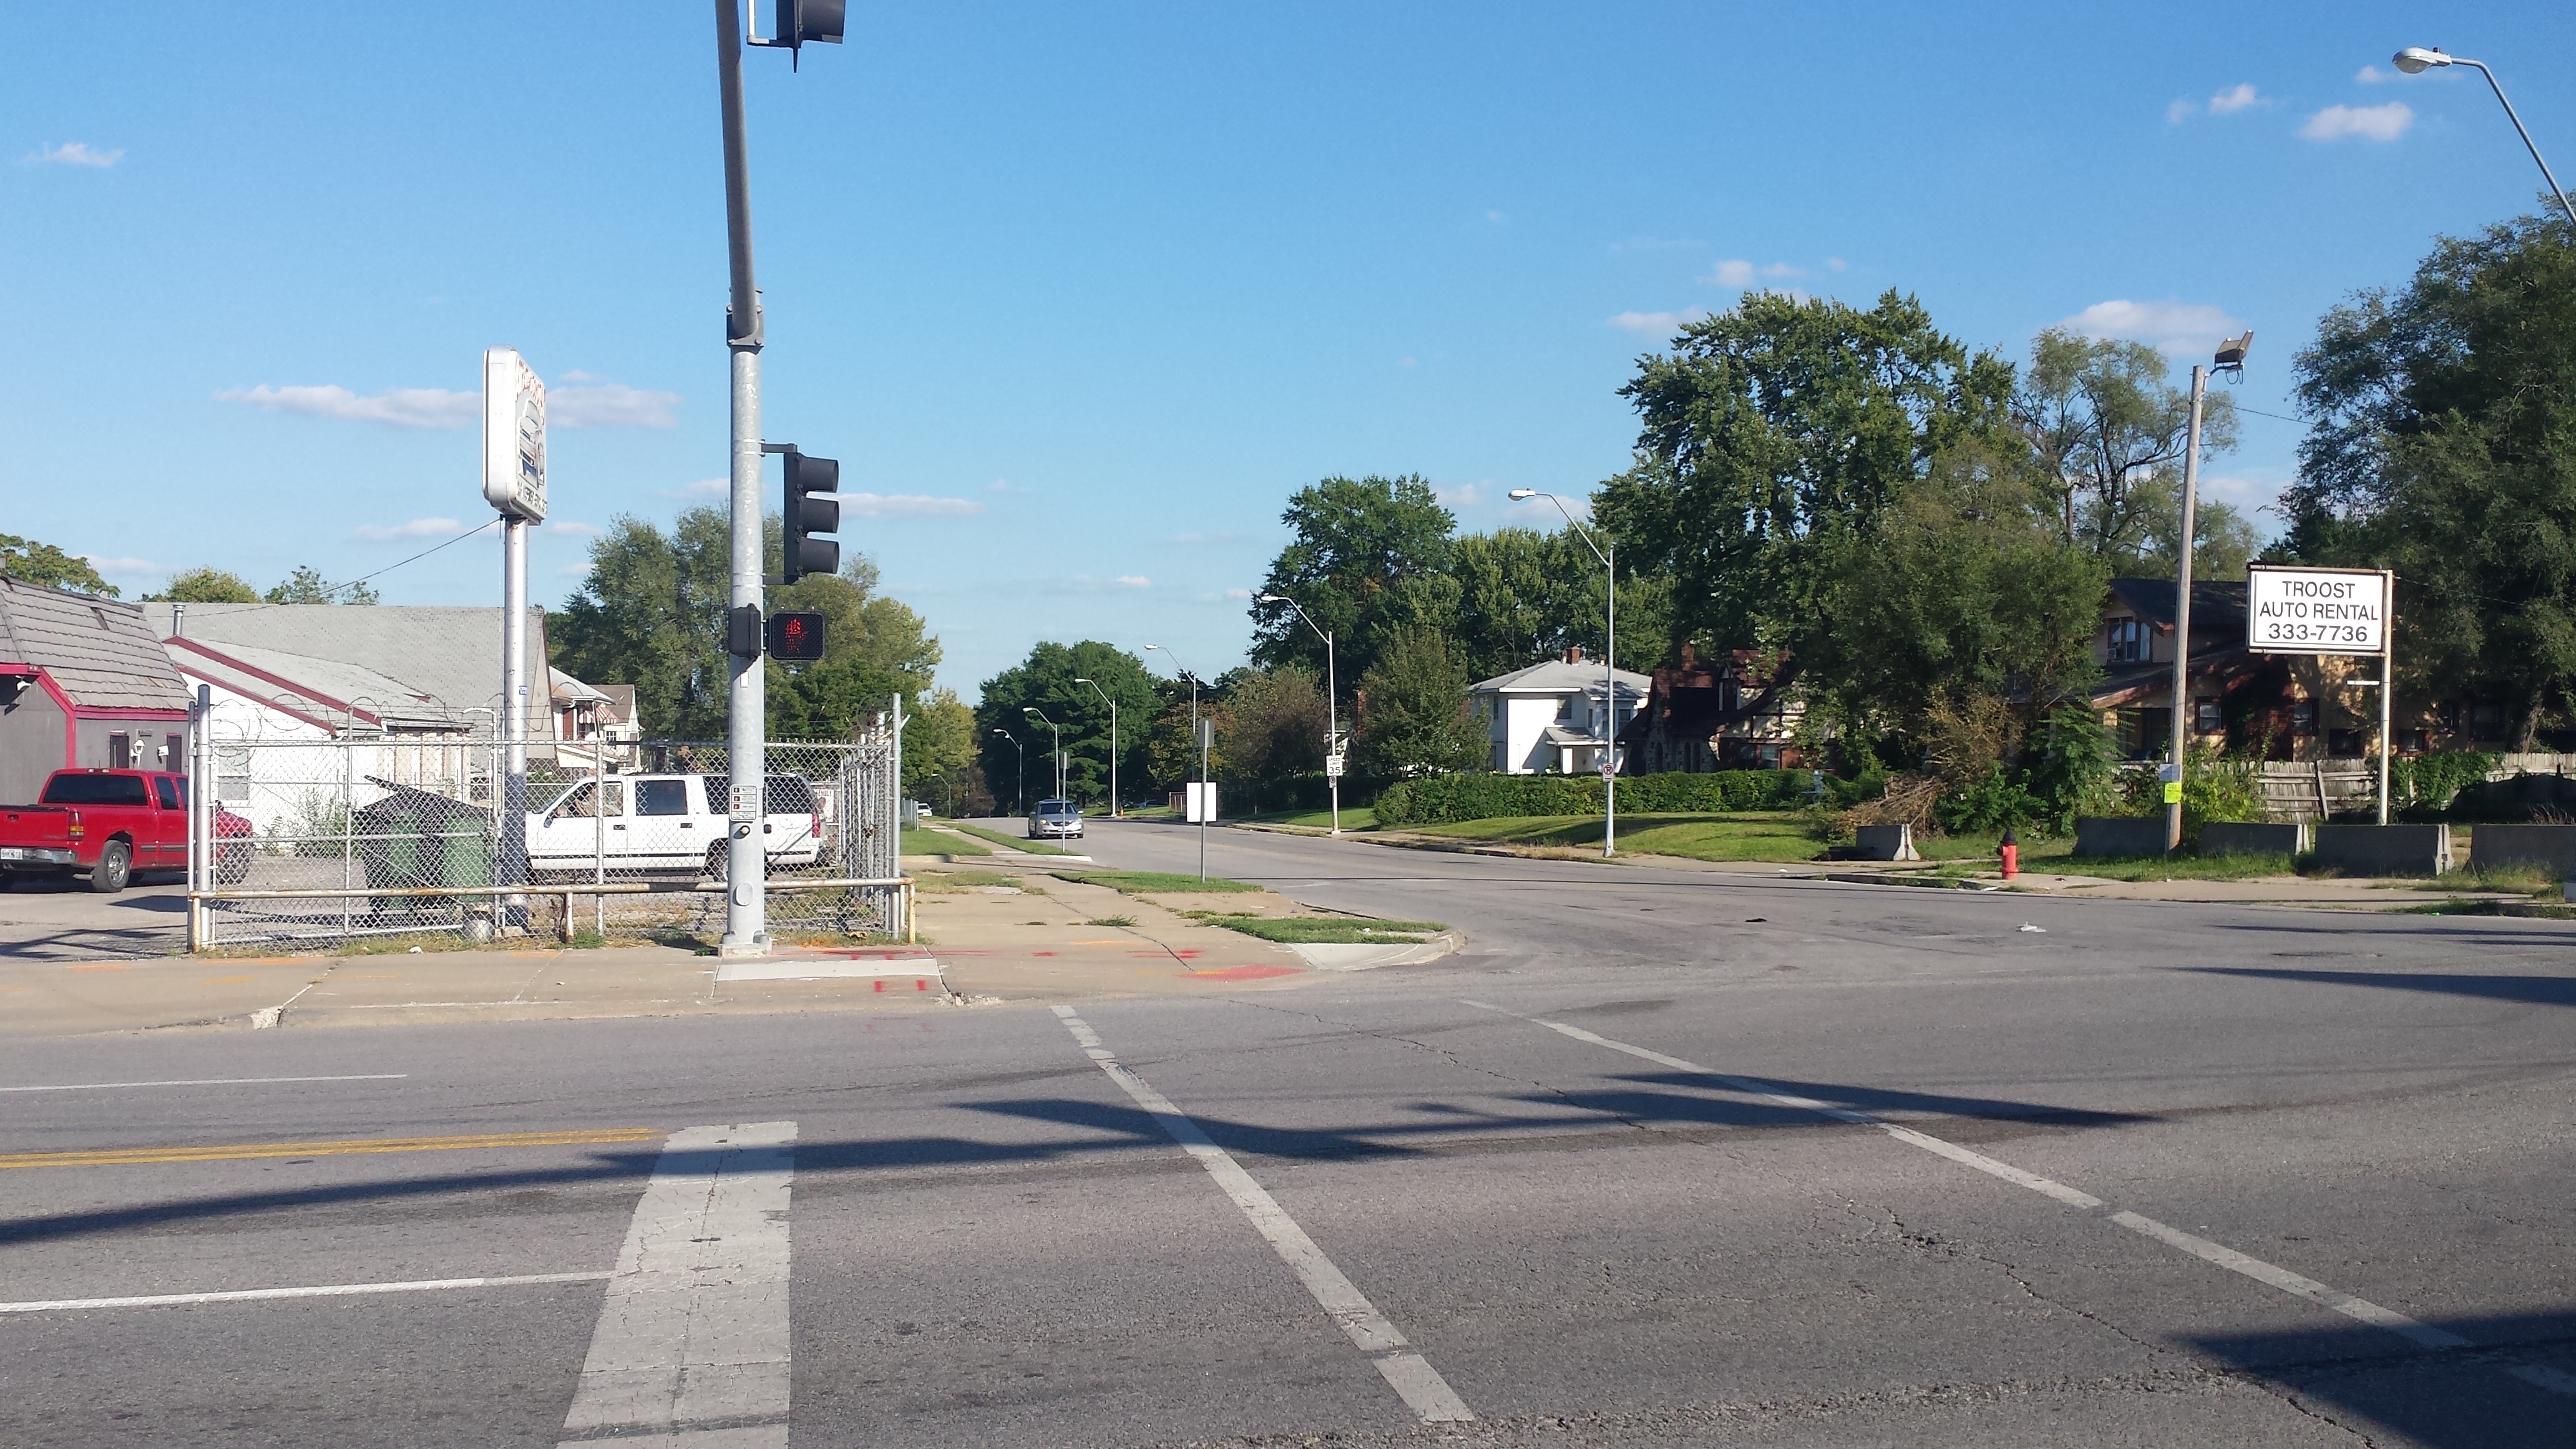
77th and Troost intersection, old Highway 71
61st and Meyer Blvd Census Entry – Carlos M.
The area I am covering is 61st and Meyer Blvd, the area has changed drastically over time, but one of the most prominent things that changed over time was the fact that education became something that was more valued, seeing as the number of high school graduates increased. Also, I was surprised that the population decreased rather than increased, seeing as at the KCMO level, the population amount boomed.
Census Data Analysis of 66th Terrace through 70th Street
My area of data analysis rests around 66th Terrace and 70th Street, which is home to census tract 86, on the west side of Troost, and tract 87, on the eastern side of Troost. A common theme of both tracts is a steady decreasing total population from 1950 to 2000. Tract 86 in particular, had an especially drastic decline of 2,294 residents during this time. Tract 87, followed the same pattern though to a much lesser extent, and lost 215 residents from 1950 to 2000. Interestingly, from 2000 to 2010, the Tracts seem to “flip”. During this time, tract 86, saw a mild decline of 14 residents, compared to tract 87, on the east side of Troost, which saw a rapid decline of 470 residents.
Another interesting thing I noticed; in 1950, when the black population of the western tract 86 outnumbered the eastern tract, 87 (a twist to where we are today), Troost Avenue still served as an economic and educational attainment dividing line. In 1950, the median income in the west tract was $6,855 and the median housing value $15,586, where in the east tract, the median income was $4,270, and the median housing value $9,790. Further, on the west side, 74.7% of the population over 25 completed high school or more, whereas on the East side, only 62.6% completed high school or more. Neat.
Census Data Analysis of Troost Avenue Between 40th Street and 43rd Street
Troost Avenue between 40th Street and 43rd Street lay within Census Tracts 65 and 64 (64 changing to tract 169 after 2000) of Jackson County, MO. Between 1950 and 2010, many changes occurred within the area, most prominently seen in the total population, race/ethnic group majorities and vacant housing units. In 1950, both areas housed roughly 4,000 residents per tract. By 2000, the total population in both areas decreased by over 2,000 residents. In 1950, white residents dominated the area, but by 2000, black residents highly concentrated the area, becoming the dominate race in Census Tract 65 by a large sum and equaling the total number of white residents in Census Tract 64. The most imperative change that occurred over the sixty-year time span was the housing units that have become vacant along the Troost Avenue corridor and surrounding area. The number of vacant homes in both tracts increased to over 200 homes between 1950 and 2000. The unkempt, vacant homes can be seen while driving through the area, supporting the statistics provided. With the disinvestment the area has gone through, many buildings are left vacant or knocked down and left as empty lots. As more residents move out of the area, vacating and abandoning their homes, the area becomes less safe as less people are on the streets and the lack of community continues to grow which in turn creates a larger gap between the newly developed investment areas of Kansas City, and the areas built one hundred years ago that lack reinvestment and continue to further decay.
Census Report: East 13th Street and Truman Road
Examining the census data for the area around of East 13th Street and Truman Road along Troost Avenue, I see consistent similarities and difference among the three different years being examined. Those similarities and differences are among race and migration and housing statistics.
As I have research this area before when looking at sanborn maps, I found that there was a shift in interest of building interstate highways from rural areas to urban areas in the 1970s (Missouri Department of Transportation, 2013). I can clearly see that this is evident in my data. There is a clear decline in population from 1950 to 2010 in those first three tracts. For 1950, the total population for tract 16 was 6,549 (Social Explorer). In Tract 16 for 2000, the total population was 1,080 (Social Explorer). For 2010 in tract 154, the total population was 3,484 (Social Explorer).
As the population of black people still stays dominate throughout the three years being examined, when we get to the year 2000, the third major category is Hispanic/Latinx which was at a total in both tracts of 4.47% (Social Explorer). The number of Hispanic and Latinx people in both tracts in 2010 was 6.24% (Social Explorer). In the area that I have been analyzing there is a slow migration of Hispanics to the Independence Avenue area, extremely close to east 13th Street and Truman Road. From a Kansas City Public Radio article in 2014, “A surge of new immigrants from Central America and Mexico revitalizes Kansas City’s most established Hispanic communities. Armourdale is repopulated with new Latino immigrants. Many immigrants resettle in corridors, such as Central and Minnesota Avenues in Kansas, and Independence Avenue in Missouri” (Rodriguez, 2014).
Missouri Department of Transportation. (2013). “Missouri’s Interstate System: Yesterday, Today and Tomorrow”. Retrieved from http://www.modot.org/interstate/ MissourisInterstateHistory.htm.
Social Explorer. (1950, 2000, 2010). Retrieved from https://www.socialexplorer.com/a9676d974c/explore
Rodriguez, Lisa. (2014). “Timeline: Events That Shaped Kansas City’s Hispanic Communities In Missouri, Kansas”. KCUR. Retrieved from http://kcur.org/post/timeline-events-shape d-kansas-citys-hispanic-commmunities-missouri-kansas#stream/0
Census Report – Troost Avenue Between Volker Boulevard and 52nd Street/Rockhurst Road
The census tracts that contained my area of Troost Avenue between Volker Boulevard and 52nd Street/Rockhurst Road were census tracts 74 and 75. I compared these two census tracts to one another as well as the overall city and the larger metropolitan statistical area across three censuses – 1950, 2000 and 2010.
Census tracts 74 and 75 had both similarities and differences to each other over the years. For example, in 1950, both census tracts were over 99% white. However, in 2000, tract 74 remained predominately white (78.1%) whereas tract 75 became predominately black (60.4%). This is the trend that we still see to this day as tract 74 lies on the west side of Troost, which is often associated as mainly white and tract 75 lies on the east side of Troost, which is often associated as mainly black.
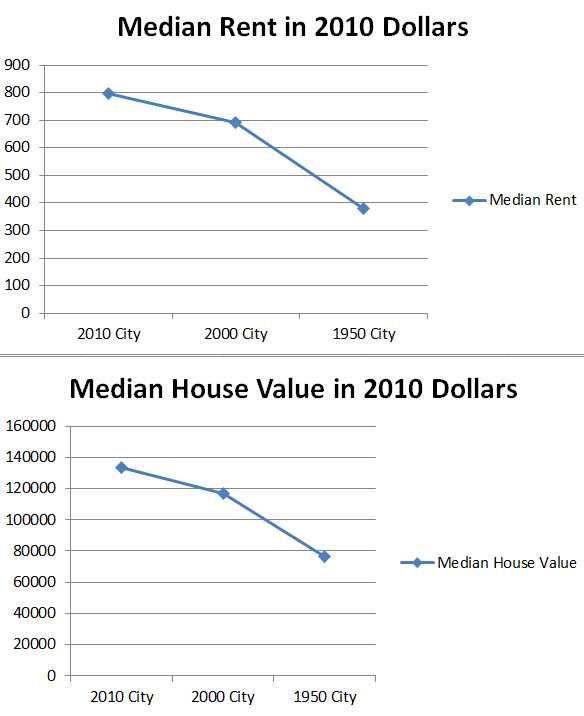
One area where the census tracts are similar is on the median rent price. In 1950, tract 74 had a median rent price of $53 while tract 75’s was $54. In 2000, both census tracts’ median rent price was $539. Finally, in 2010, there began to be a little bit more of a gap because tract 75’s median rent was $865, while tract 74’s was only $850.
Demographics of Troost Avenue Between 31st St. and Armour Blvd.
In 1950, the area between 31st Street and Armour Boulevard on Troost Avenue was a dense community of almost exclusively white residents. This changed drastically over the next fifty years. The population density greatly decreased as many Kansas City residents relocated outside the city center and the population became decentralized. These changes also led to differences in race and class. As many wealthy, white residents expanded outward, this area of Troost Avenue was left to predominately low-income, minority residents. By the 2000s, Troost Avenue had become a dividing line. Residents on the west side had a more even distribution of race and a higher median income. Residents on the east side were predominately minorities with a lower median income.
Census Report of Area Between 72nd Street and 75th Terrace
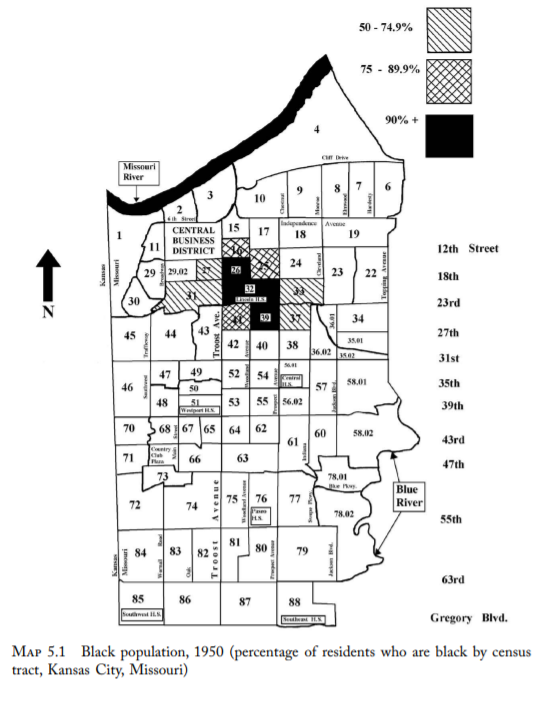
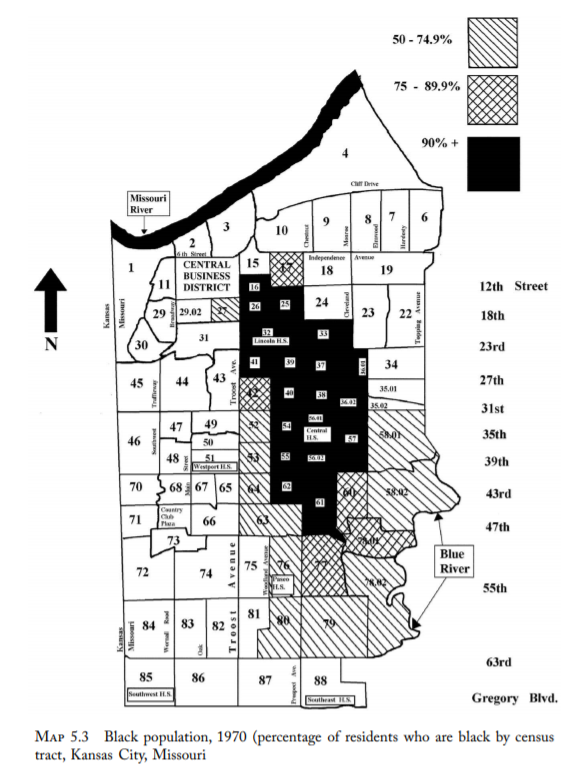
For my census project I was tasked at exploring the different demographic variables for the areas between 72nd street and 75th terrace. To do this I looked at census tracts 90 and 91 for Jackson County in Kansas City for the years 1950, 2000, and 2010. Census tract 91 shows information for blocks west of Troost Avenue and 90 represents areas east of Troost. Upon exploring information from the US Census Bureau and American Community Survey, I found some very interesting information. The most interesting thing that I found was the segregation of the African American population east of Troost and how it could not really be seen in 1950 for my area, but was very visible by 2000. The first picture shown in this post shows that segregation of the African American population was happening in Kansas City by 1950, but that it had not quite reached 72nd street yet. The second picture shows Kansas City in 1970 and how segregation had expanded. Although not yet to 72nd street, these two pictures show how racial division was following Troost and expanding rapidly. By 2000 segregation would have reached my census tracts. In fact in 2000, census tract 90 was around 88% African American and around 8% white, while census tract 91 was almost 77% white and only around 19% African American (United States Census Bureau (2000). Social Explorer, Jackson County Missouri Census Tract 90 & 91. Retrieved From https://www.socialexplorer.com/tables/C2000/R11508552). I thought it was very interesting to learn when segregation became present in my area and the other demographic variables that were affected by segregation.
Troost Avenue, 55th St to 58th St
The area along Troost Avenue between 55th St and 58th St has seen growth matching much of the rest of Kansas City. When it was founded, the half of the blocks facing the streets to the west and east (Harrison St and Forest Ave respectively) on either side of Troost were broken into neat rectangular divisions that were quickly filled with single-family houses. By the 1950s all the divisions had been filled with houses, and since Troost’s extension here, businesses have filled the other half facing the avenue.
Since the 1950s, many of the same houses still remain, fairly well maintained, but the commercial/public corridor enclosing Troost has seen many bouts of reconstruction, new business, and vacancy. Many parking lots sit unused, buildings are boarded up, but the remaining public buildings and spaces (churches, a park, schools), and the small shops, give the area a bit of livelihood.
Troost Ave. 78th St. and 82nd Terr.
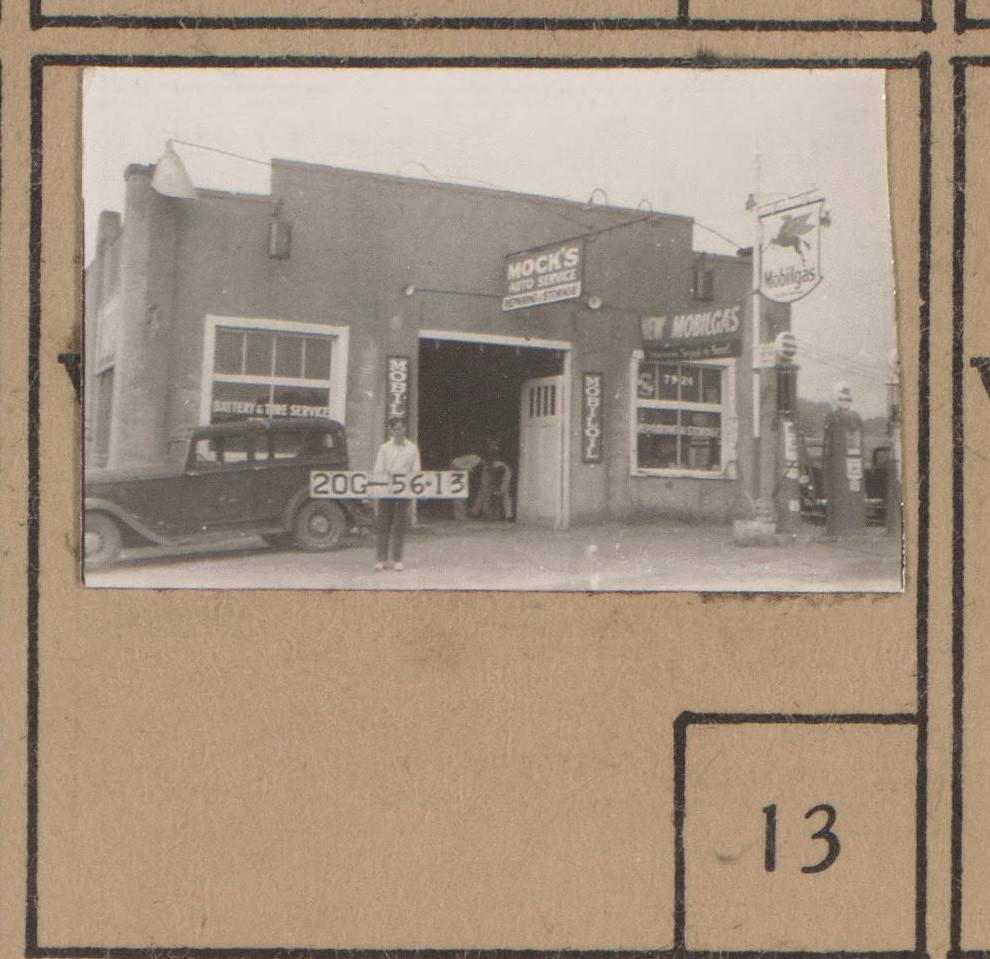
The area of Troost Avenue between the areas of 78th St. and 82nd Terrace were not part of the Kansas City until it was annexed in 1947. This tax assessment photo from 1940 shows Mock’s Auto Repair shop at 7924 Troost Ave.
According the census information, 79th St. seemed to be a sharp dividing line for race. The area south of 79th St. and east of Troost consistently reported a large majority of white population while the area north of 79th St. and east of Troost drastically changed population to a reported majority of black residents beginning in the 1970’s. The area now is being revitalized and is home to the Academy for Integrated Arts and a new “Nature and Play” community space set to be finished in the fall of 2017.
Troost Avenue Historical Map and Photo Analysis – 75th to 78th Street
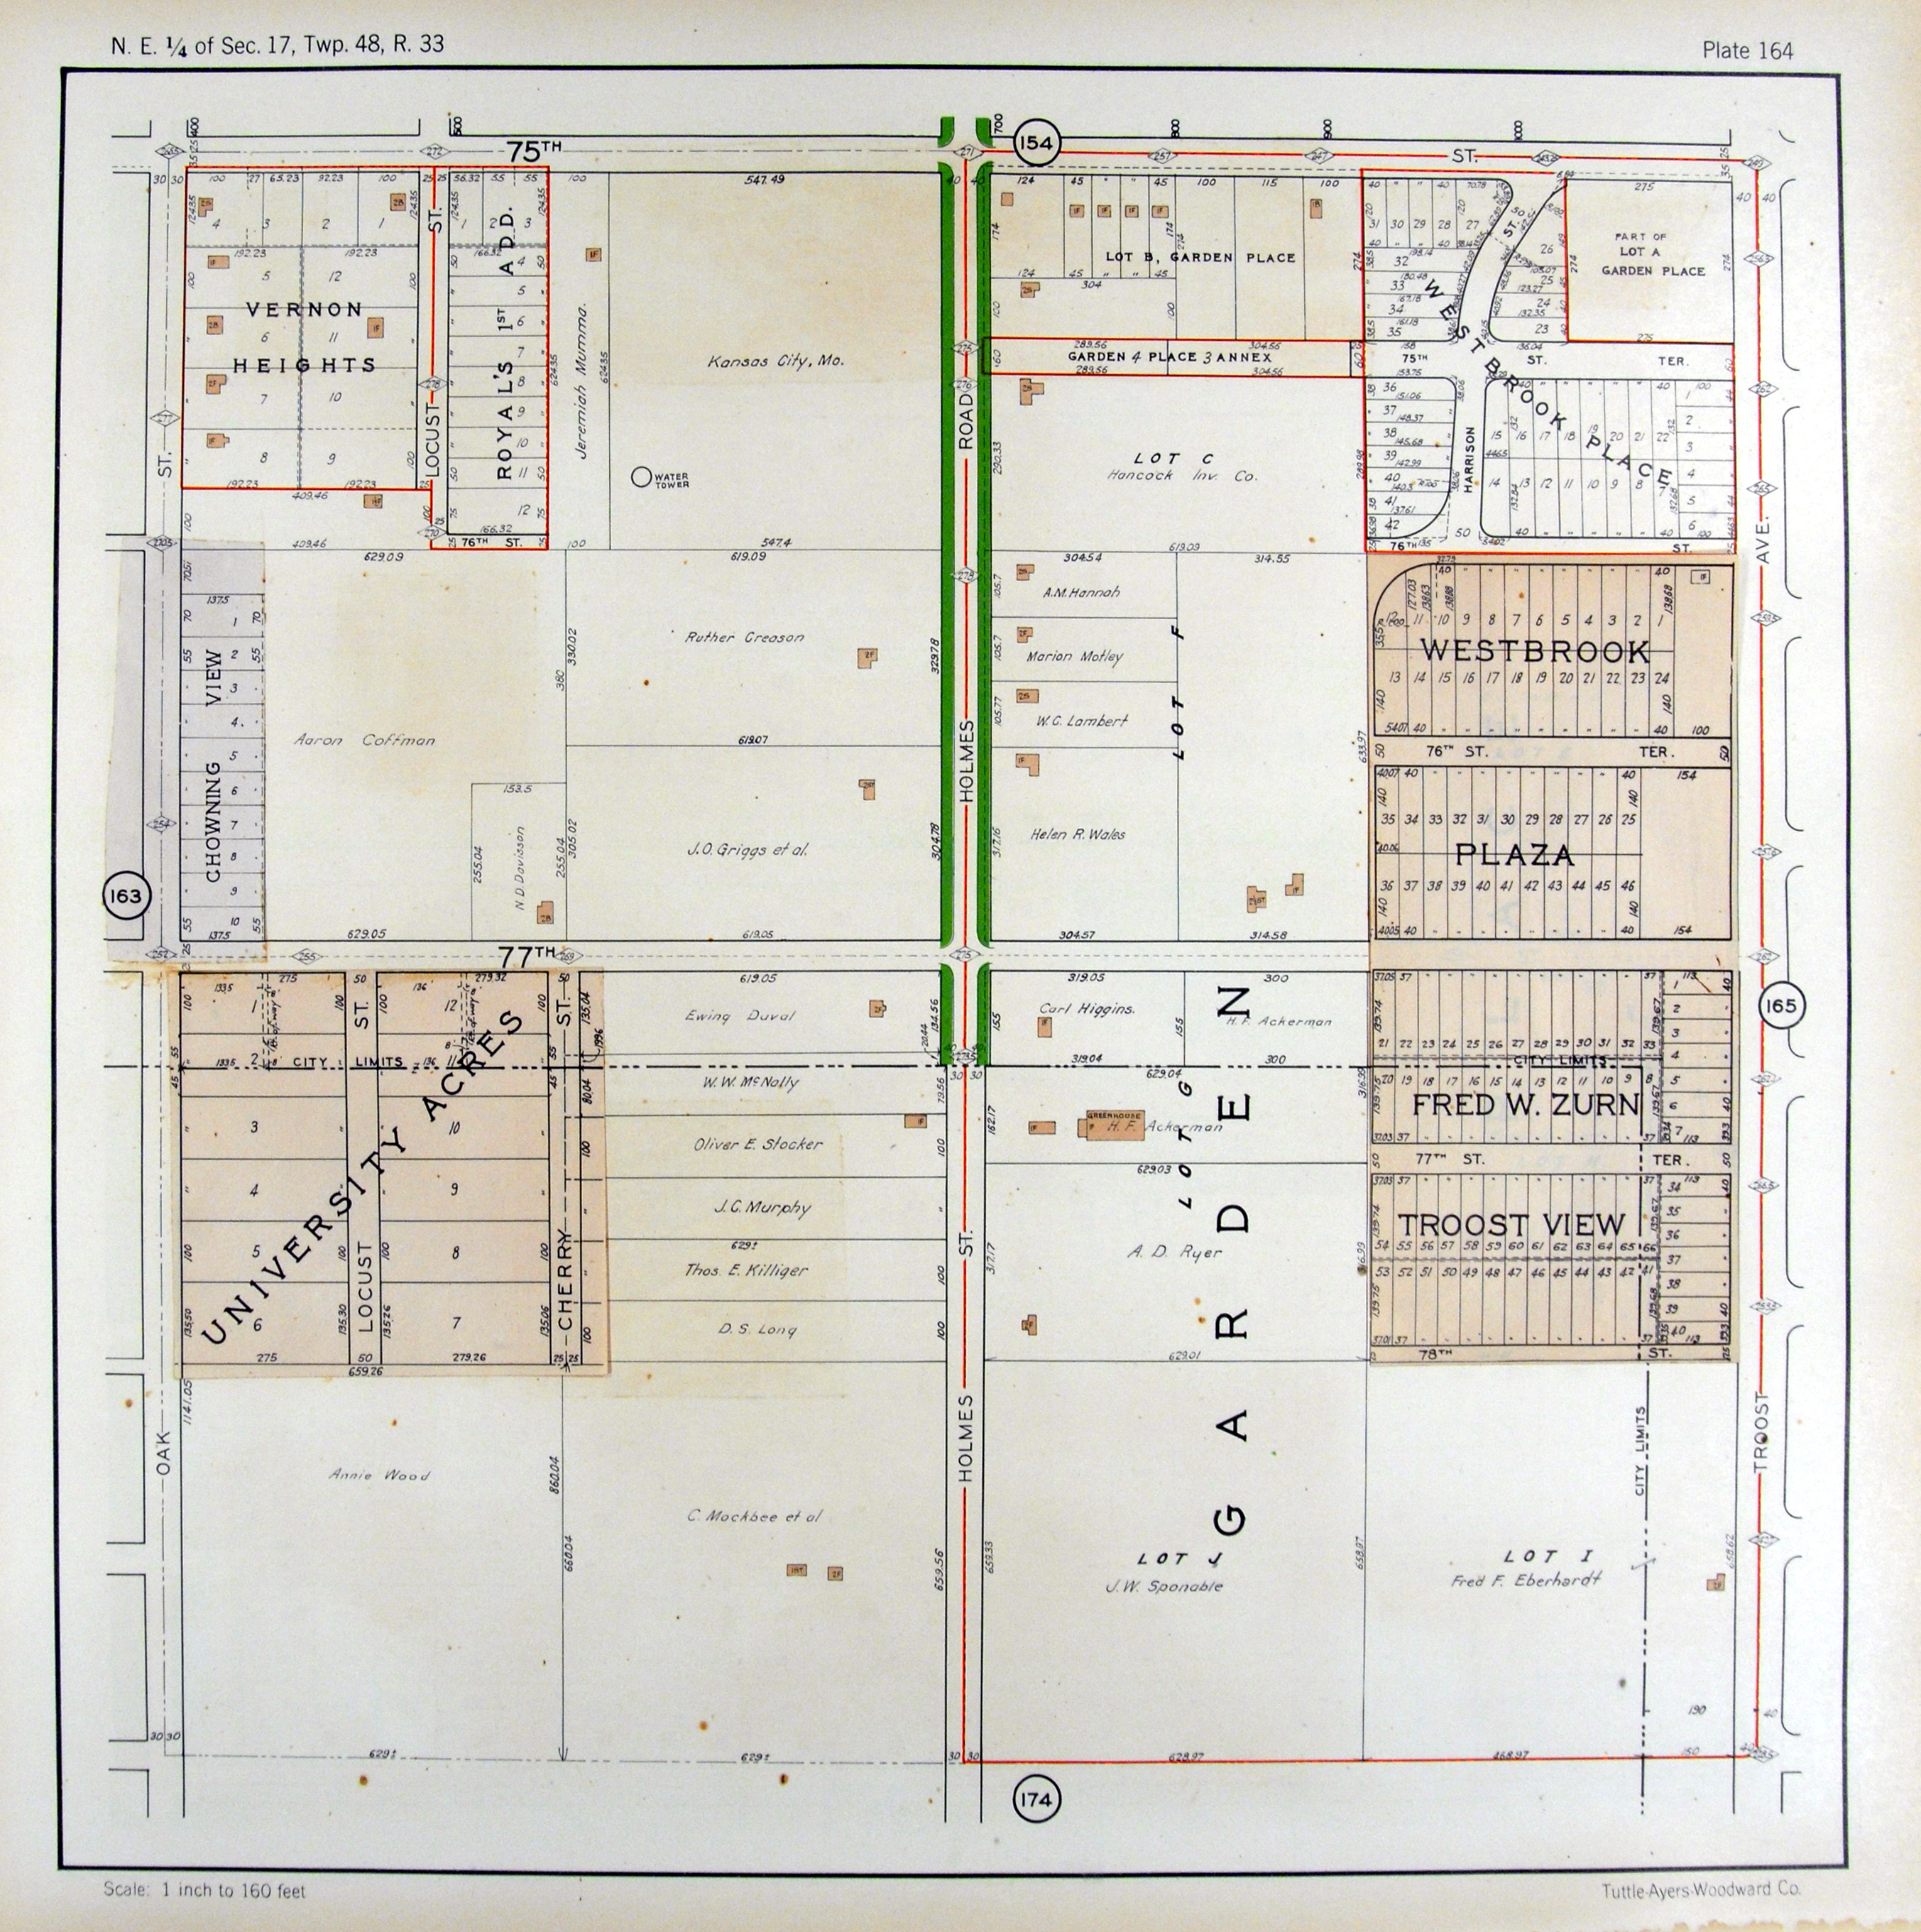
In 1900 Troost Avenue from 75th to 78th Street was farmland well outside the limits. Within 50 years it became a thriving suburb and today it has been fully absorbed into the urban core of Kansas City. The 1909 annexation more than doubled the size of Kansas City. In the following decades, Troost from 75th to 78th was still relatively rural and undeveloped. An initial attempt to develop the area was initiated by the Methodist Church who were attempting to create Kansas City’s first university, Lincoln and Lee University and land was bought just west of Troost and 75th for the proposed university. While the initial plan never materialized, the project of building a university for the city was eventually undertaken by JC Nichols and William Rockhill Nelson, two of the wealthiest, and most powerful, individuals in Kansas City at the time. The 1925 atlas indicates this land as “University Acres.”

Comparing the state of the neighborhoods immediately surrounding UMKC – Countryside, the Plaza, Wornall-Homestead, and Brookside – to state of the neighborhoods around Troost from 75th to 78th demonstrates the impact the real estate market of the 1920’s and 30’s still has on the built environment, and the character of the city. The decisions and events that prevented Lincoln and Lee University from forming and countless other decisions have profoundly affected the daily lives of residents of the area, and the nature of the community.
Northernmost Troost
The area of Troost from 4th to Independence had seem some radical change. At two separate periods of time entire blocks of residential housing had essentially vanished between focused time periods. It was the first half of the 20th century when the a block on the corner of 4th and Troost was razed for a park and playground around a school, but, ultimately became a community center and empty field. The second, and probably part of of the most notable event in Kansas City History, was the creation of the Eisenhower Interstate System. In this focus area an entire block (one of many around the city) displaced over a dozen homes and business for an highway onramp for I35/I29.
Personally, one of the funniest/most serendipitous moments of my project was while going through the 1940 Tax assessment photographs I discovered that the photographs I had taken a month prior matched almost perfectly to those taken 67 years ago.
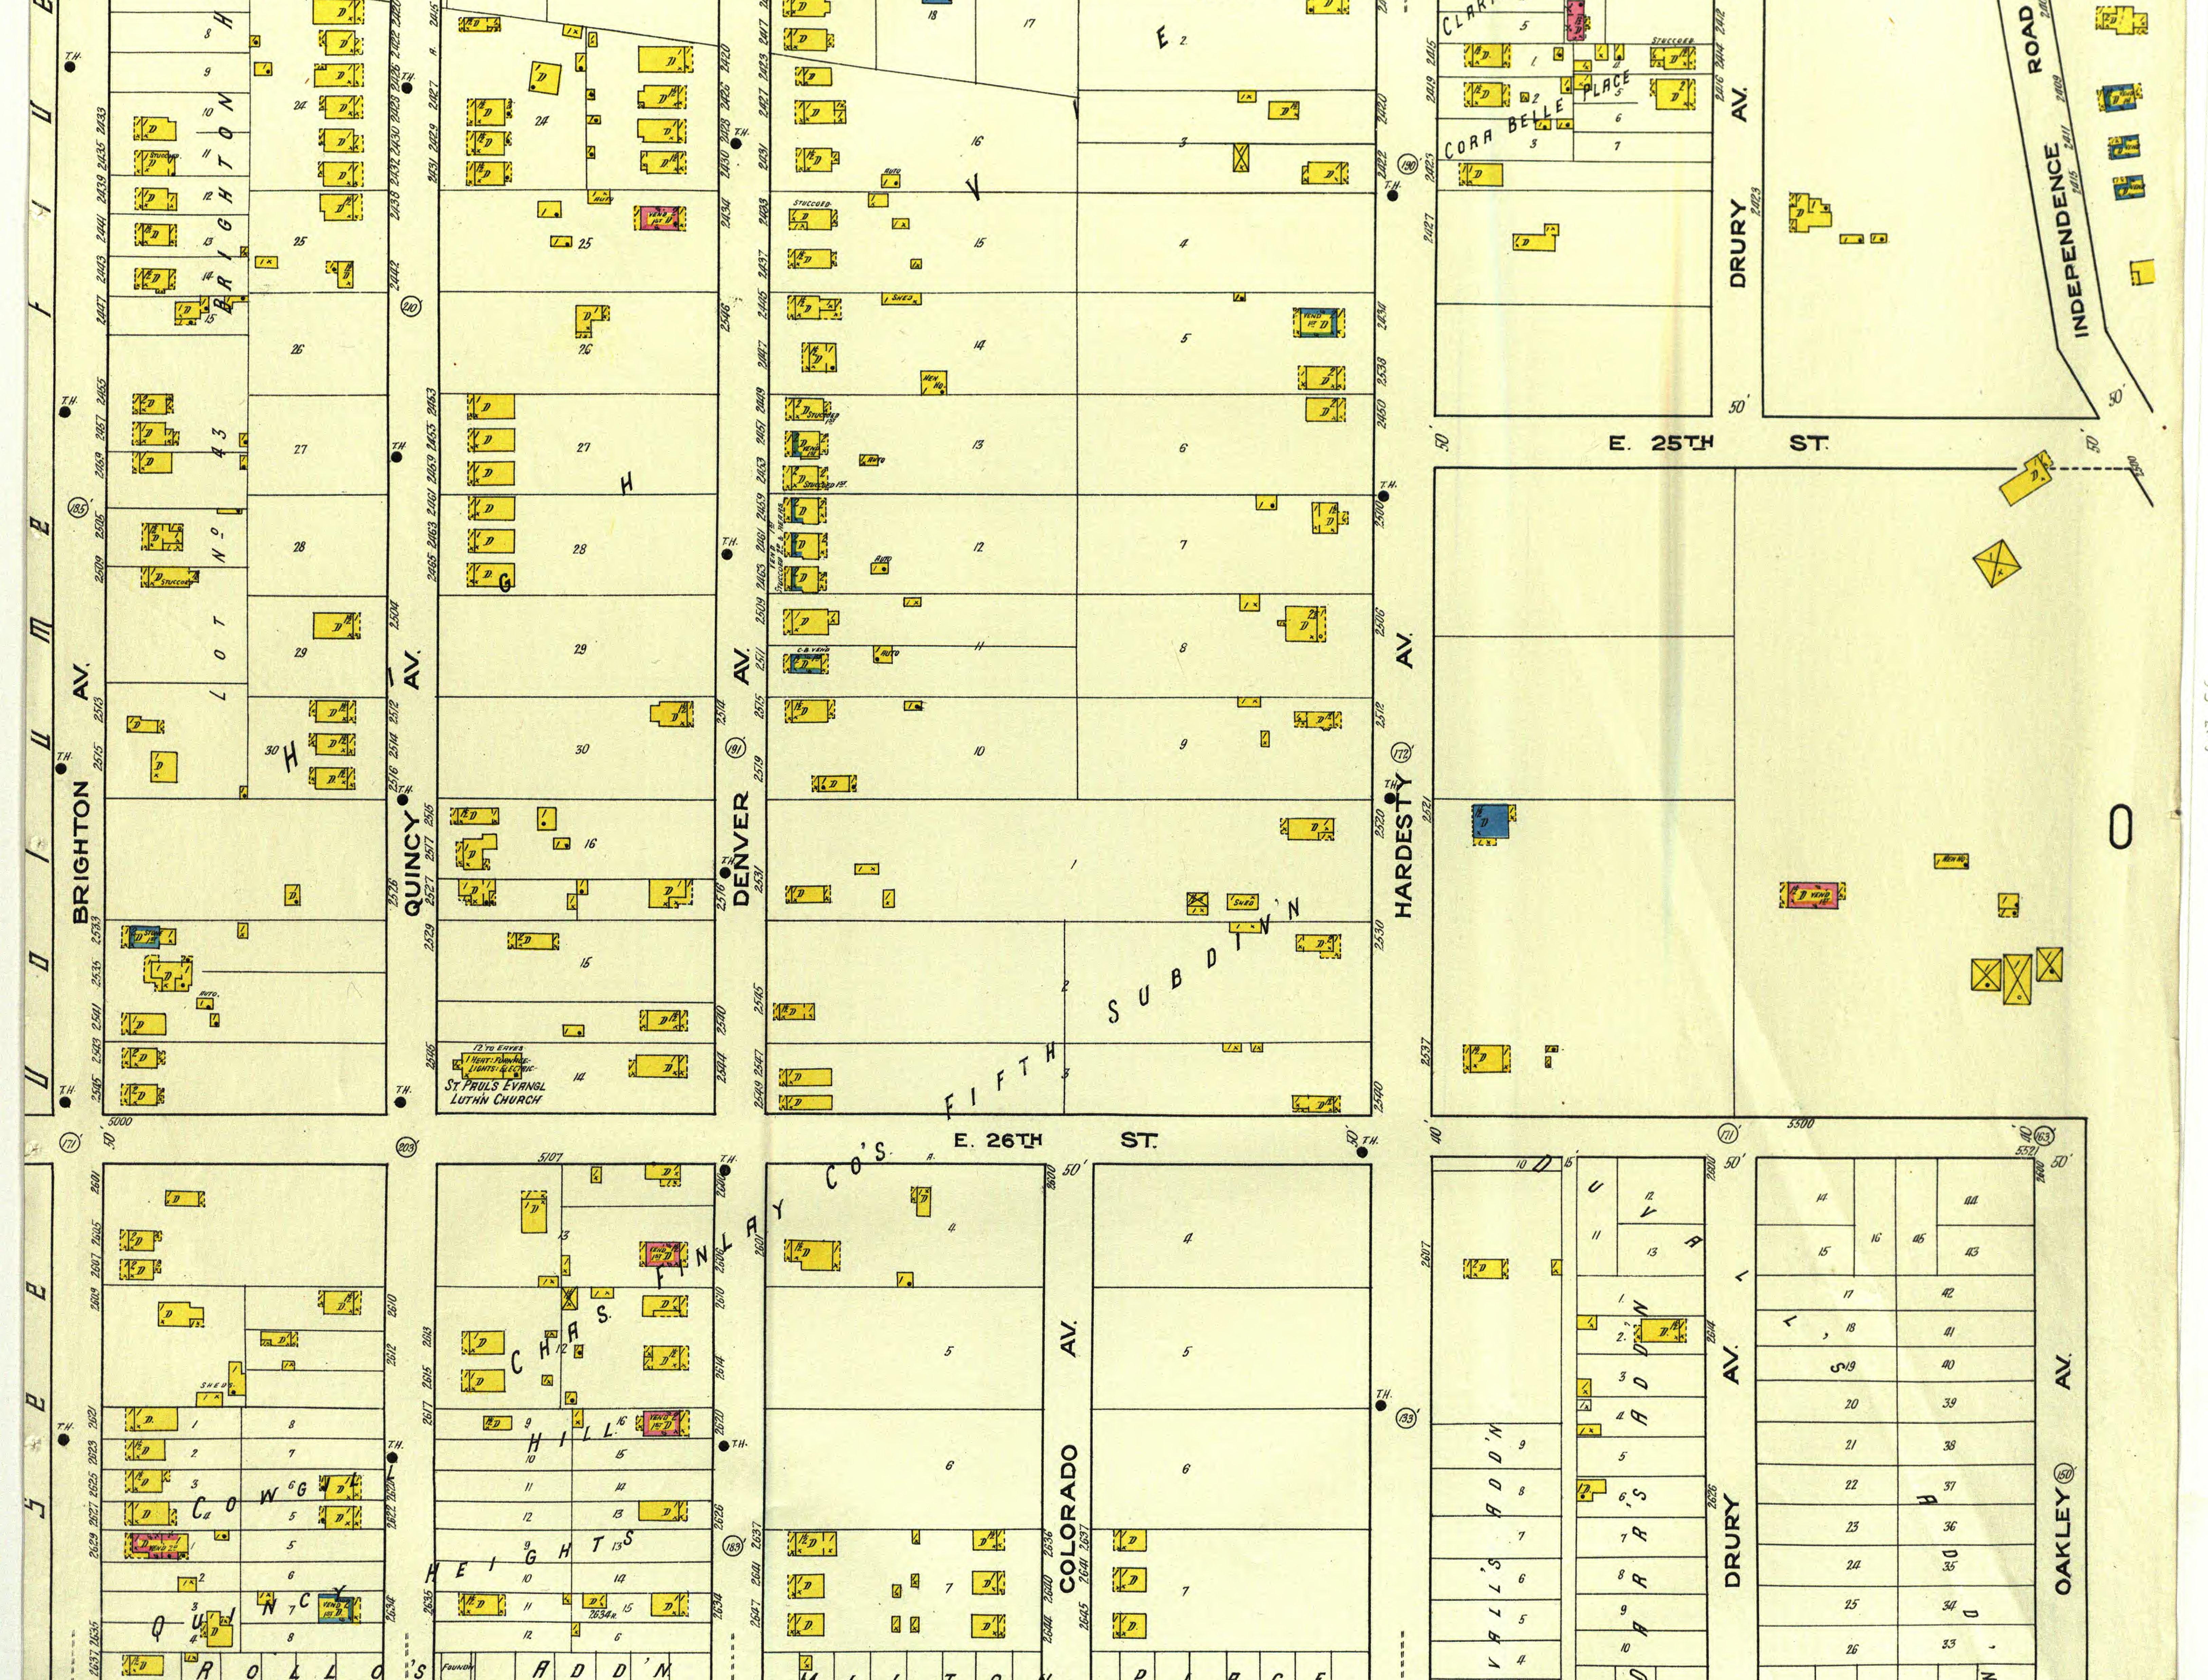
Troost Ave between 34th street and 37th street
Troost avenue between 34th through 37th street are areas that have drastically changed over time. In 1917, these blocks were mostly vacant with just a few buildings. Thirty-four years later, the vacant lots in this area had completely vanished. In their place was now housing, and an increased amount of commercial buildings. Fast forward to today, many homes and businesses have been demolished, and those who weren’t are left unoccupied.
These are two pictures from 1940(left) and 2017 (right). As you can see the picture on the left shows a business with housing on both sides. Now in 2017, the lot where the business once was is now unoccupied while the housing next to it have been demolished, leaving a vacant space.
Photograph from 1940 Tax assessor. Photograph from google maps.
Volker and Brush Creek Boulevard
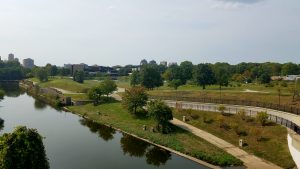
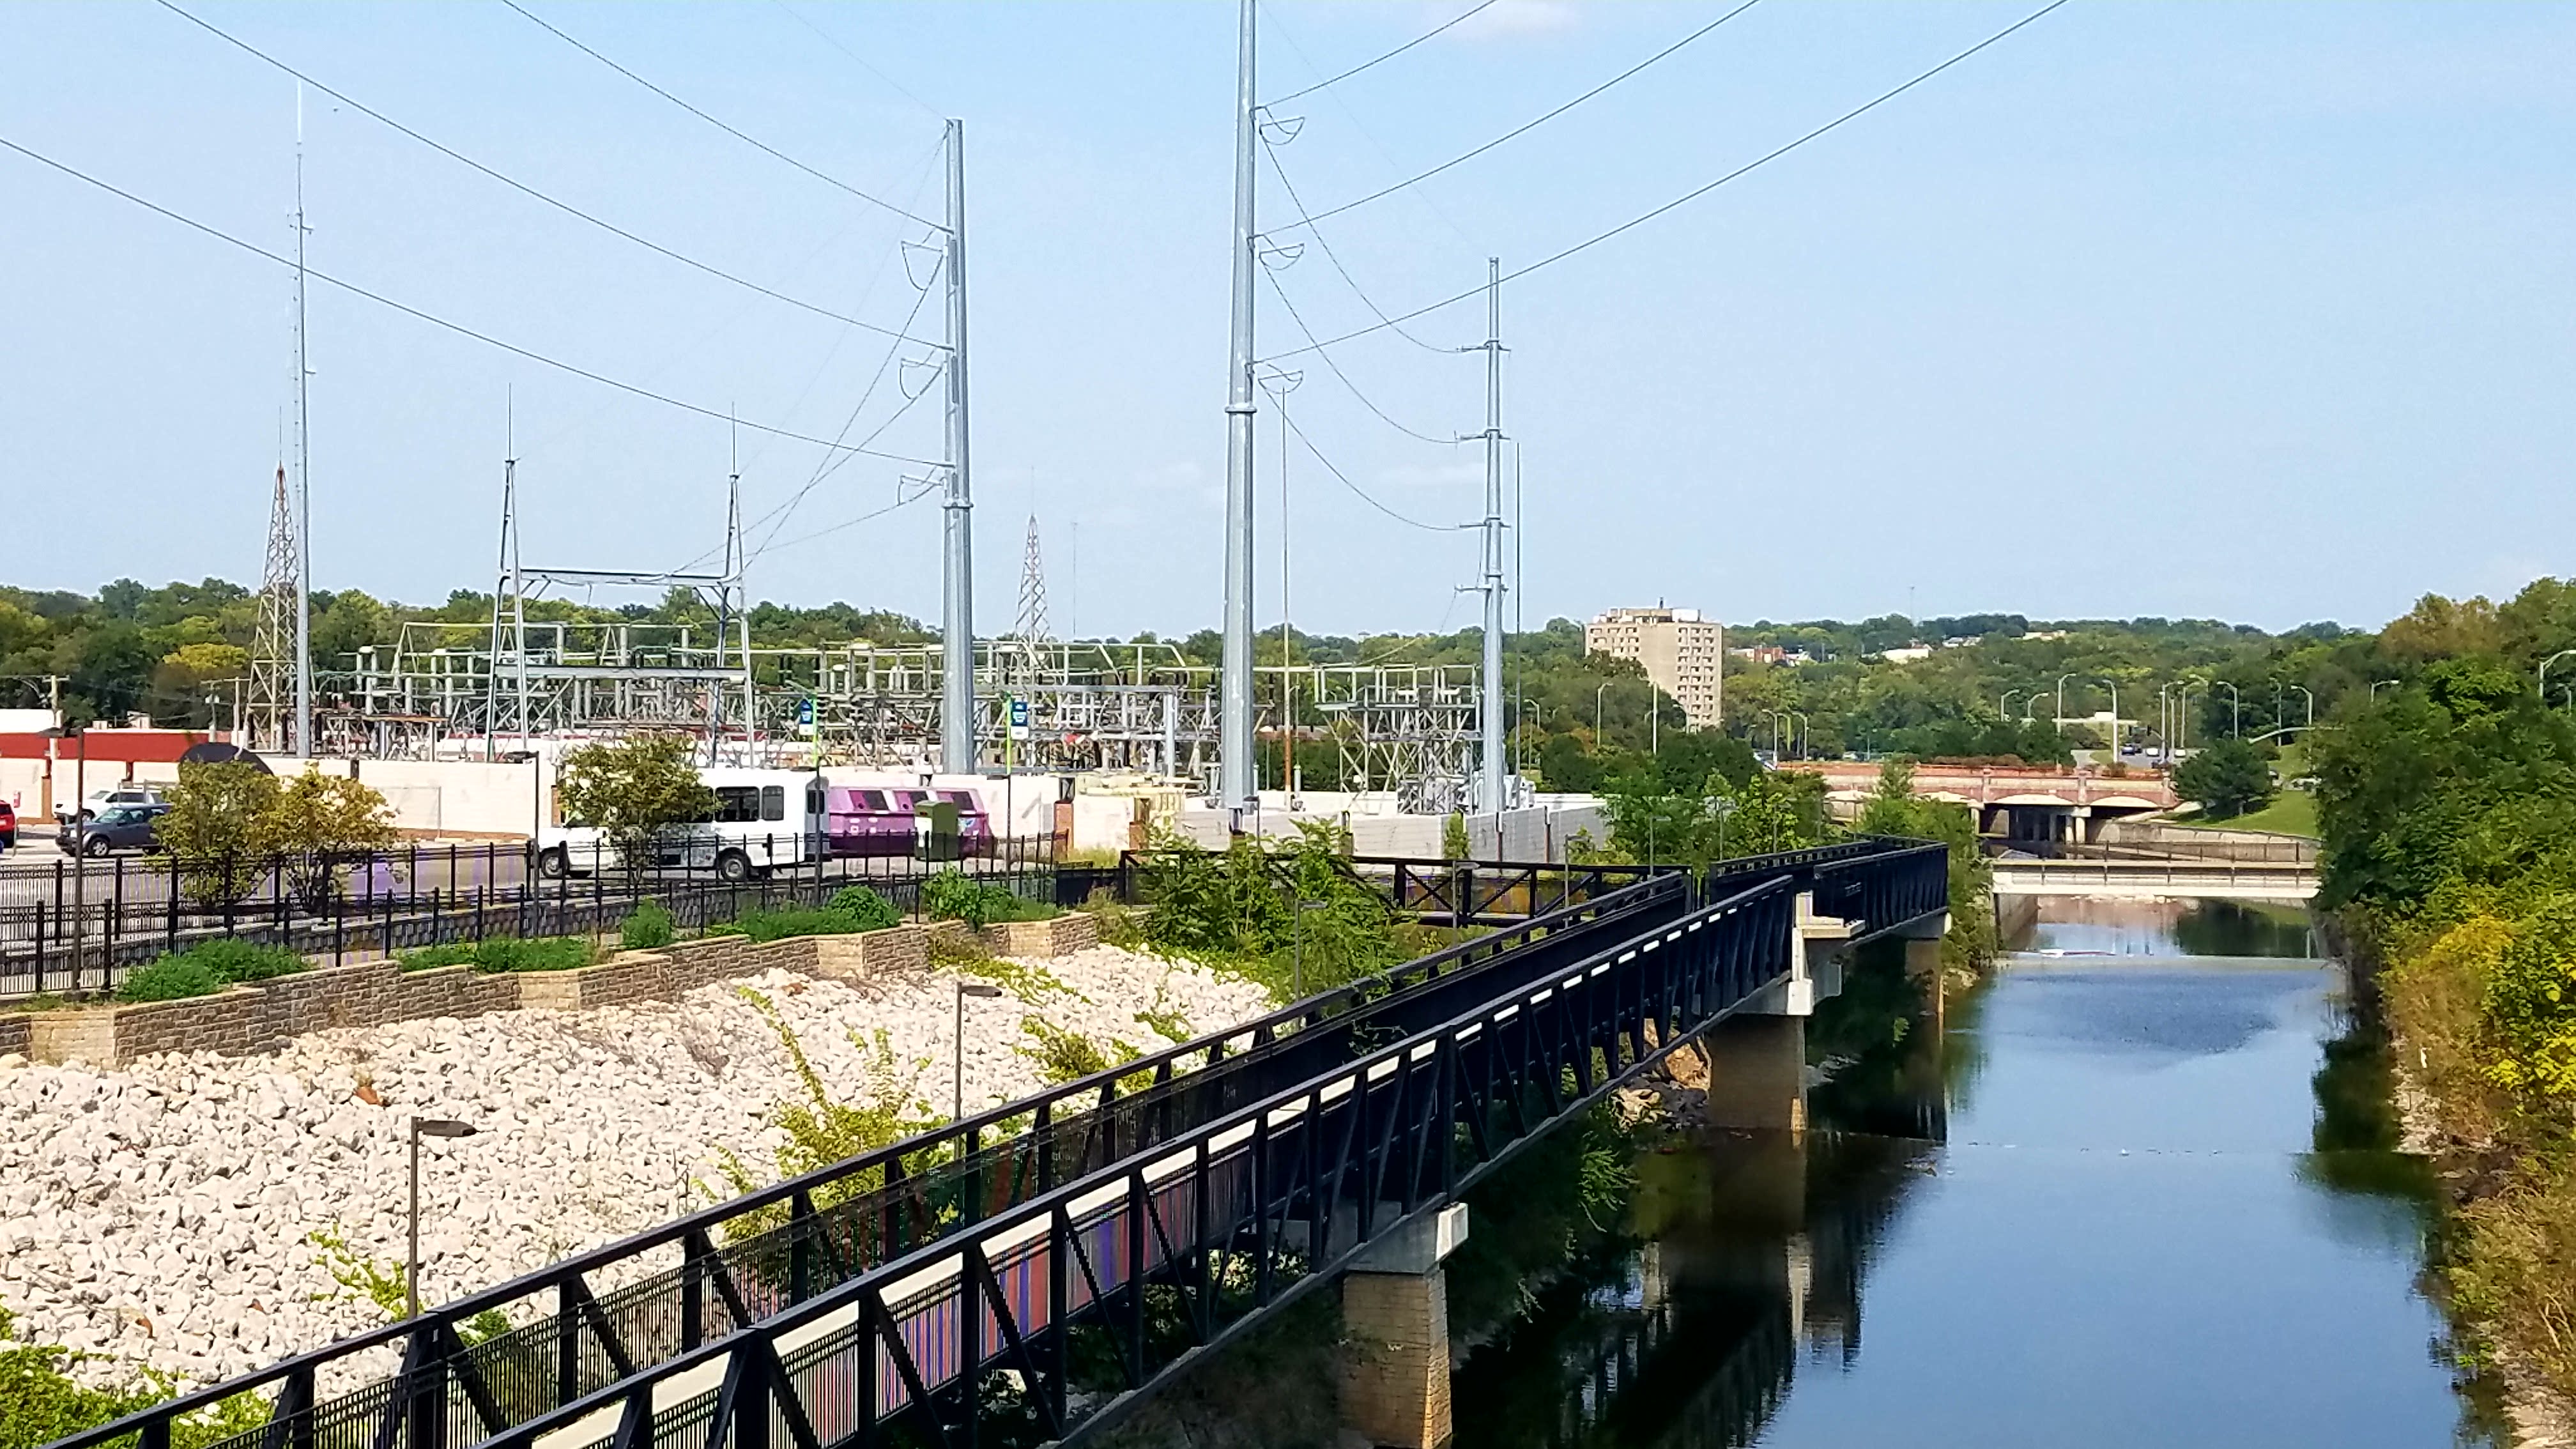
While first gathering information in the field, I started on the bridge located above Brush Creek at the intersection of Troost and Volker Boulevard. From the start, a clear physical difference between the west side of Troost and the east became apparent. Viewing from the west, a picturesque landscape can be seen before the backdrop of the Plaza. Directly across the street the landscape drastically changes. Curved open pathways become linear and confined, green grass turns to gravel and the view of open blue skies become obscured by towering power lines.
Troost Avenue Map and Photo Analysis: 31st to 34th
From millionaire homes in the late 19th century to emptiness and murals depicting what once was in the beginning of the 21st century. The four block stretch from 31st to 34th started off as an escape from city life, as described by Webster Withers. Along with his neighbor L.V. Harkness, possibly one of the wealthiest men to live in Kansas City. Due to the growth of the city’s population and the ever-expanding core, other not so wealthy residents moved out, including to 31/34. As the population increased so did its market, seen in the expansion of the city’s streetcar lines out to 33rd and Troost by 1889. Many businessmen saw the economic potential in this area and quickly invested. This led to the Wirthman Building, a Woolworth Five-and-Dime, the Firestone Building, and many others until 33rd when you could find mainly residential buildings along Troost. The landscape stayed virtually unchanged until the late 1960’s when the area saw a racial mixup and the population went from exclusively white to many whites leaving and a newfound majority of blacks by 1970. Crime and poverty rates ran throughout the 31/34 section from then on leading to the vacancy and sometimes even demolition of historic buildings. In 2017, this section of Troost is inhabited by people who look to live and do the best with what they have. They are strong, resilient, and see change as just a test to their strength. These four blocks have seen the wealthiest and poorest of Kansas City, and throughout the years the physical landscape has changed drastically, but one thing has remained the same, they have all chased their own dreams.
Between 58th and 61st Street – Troost Avenue
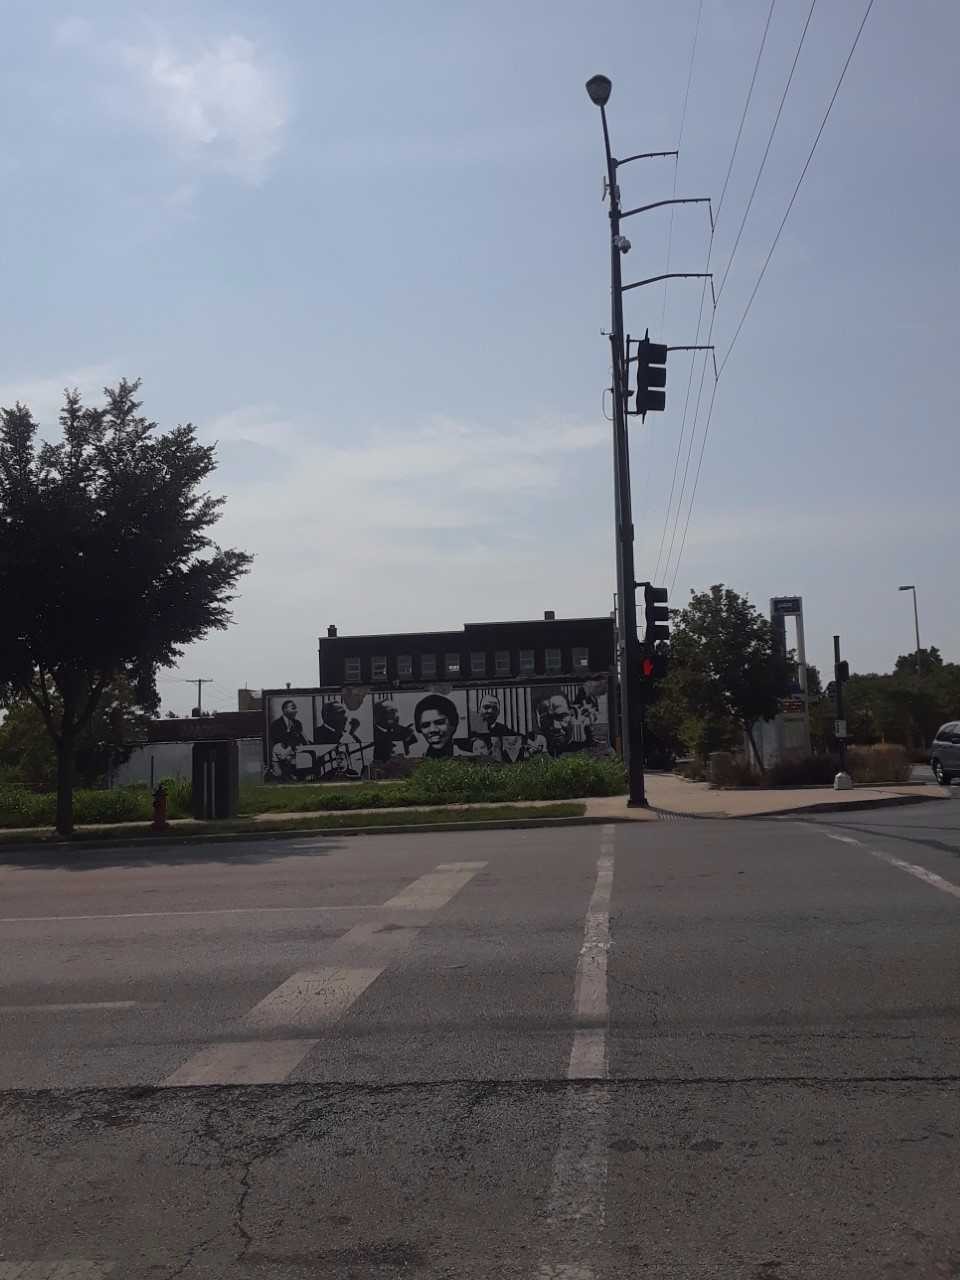
According to the book Pendergast! by Lawrence H. Larsen and Nancy J. Hulston, Kansas City nearly doubled in size in the early 1900s thanks to many annexations that brought the city limits all the way to 79th St. This area just west of Troost shows the Crestwood housing developments – a development of JC Nichols after he constructed the Country Club Plaza. His contributions very much defined the plaza area, including the segregation between East KC and West KC.
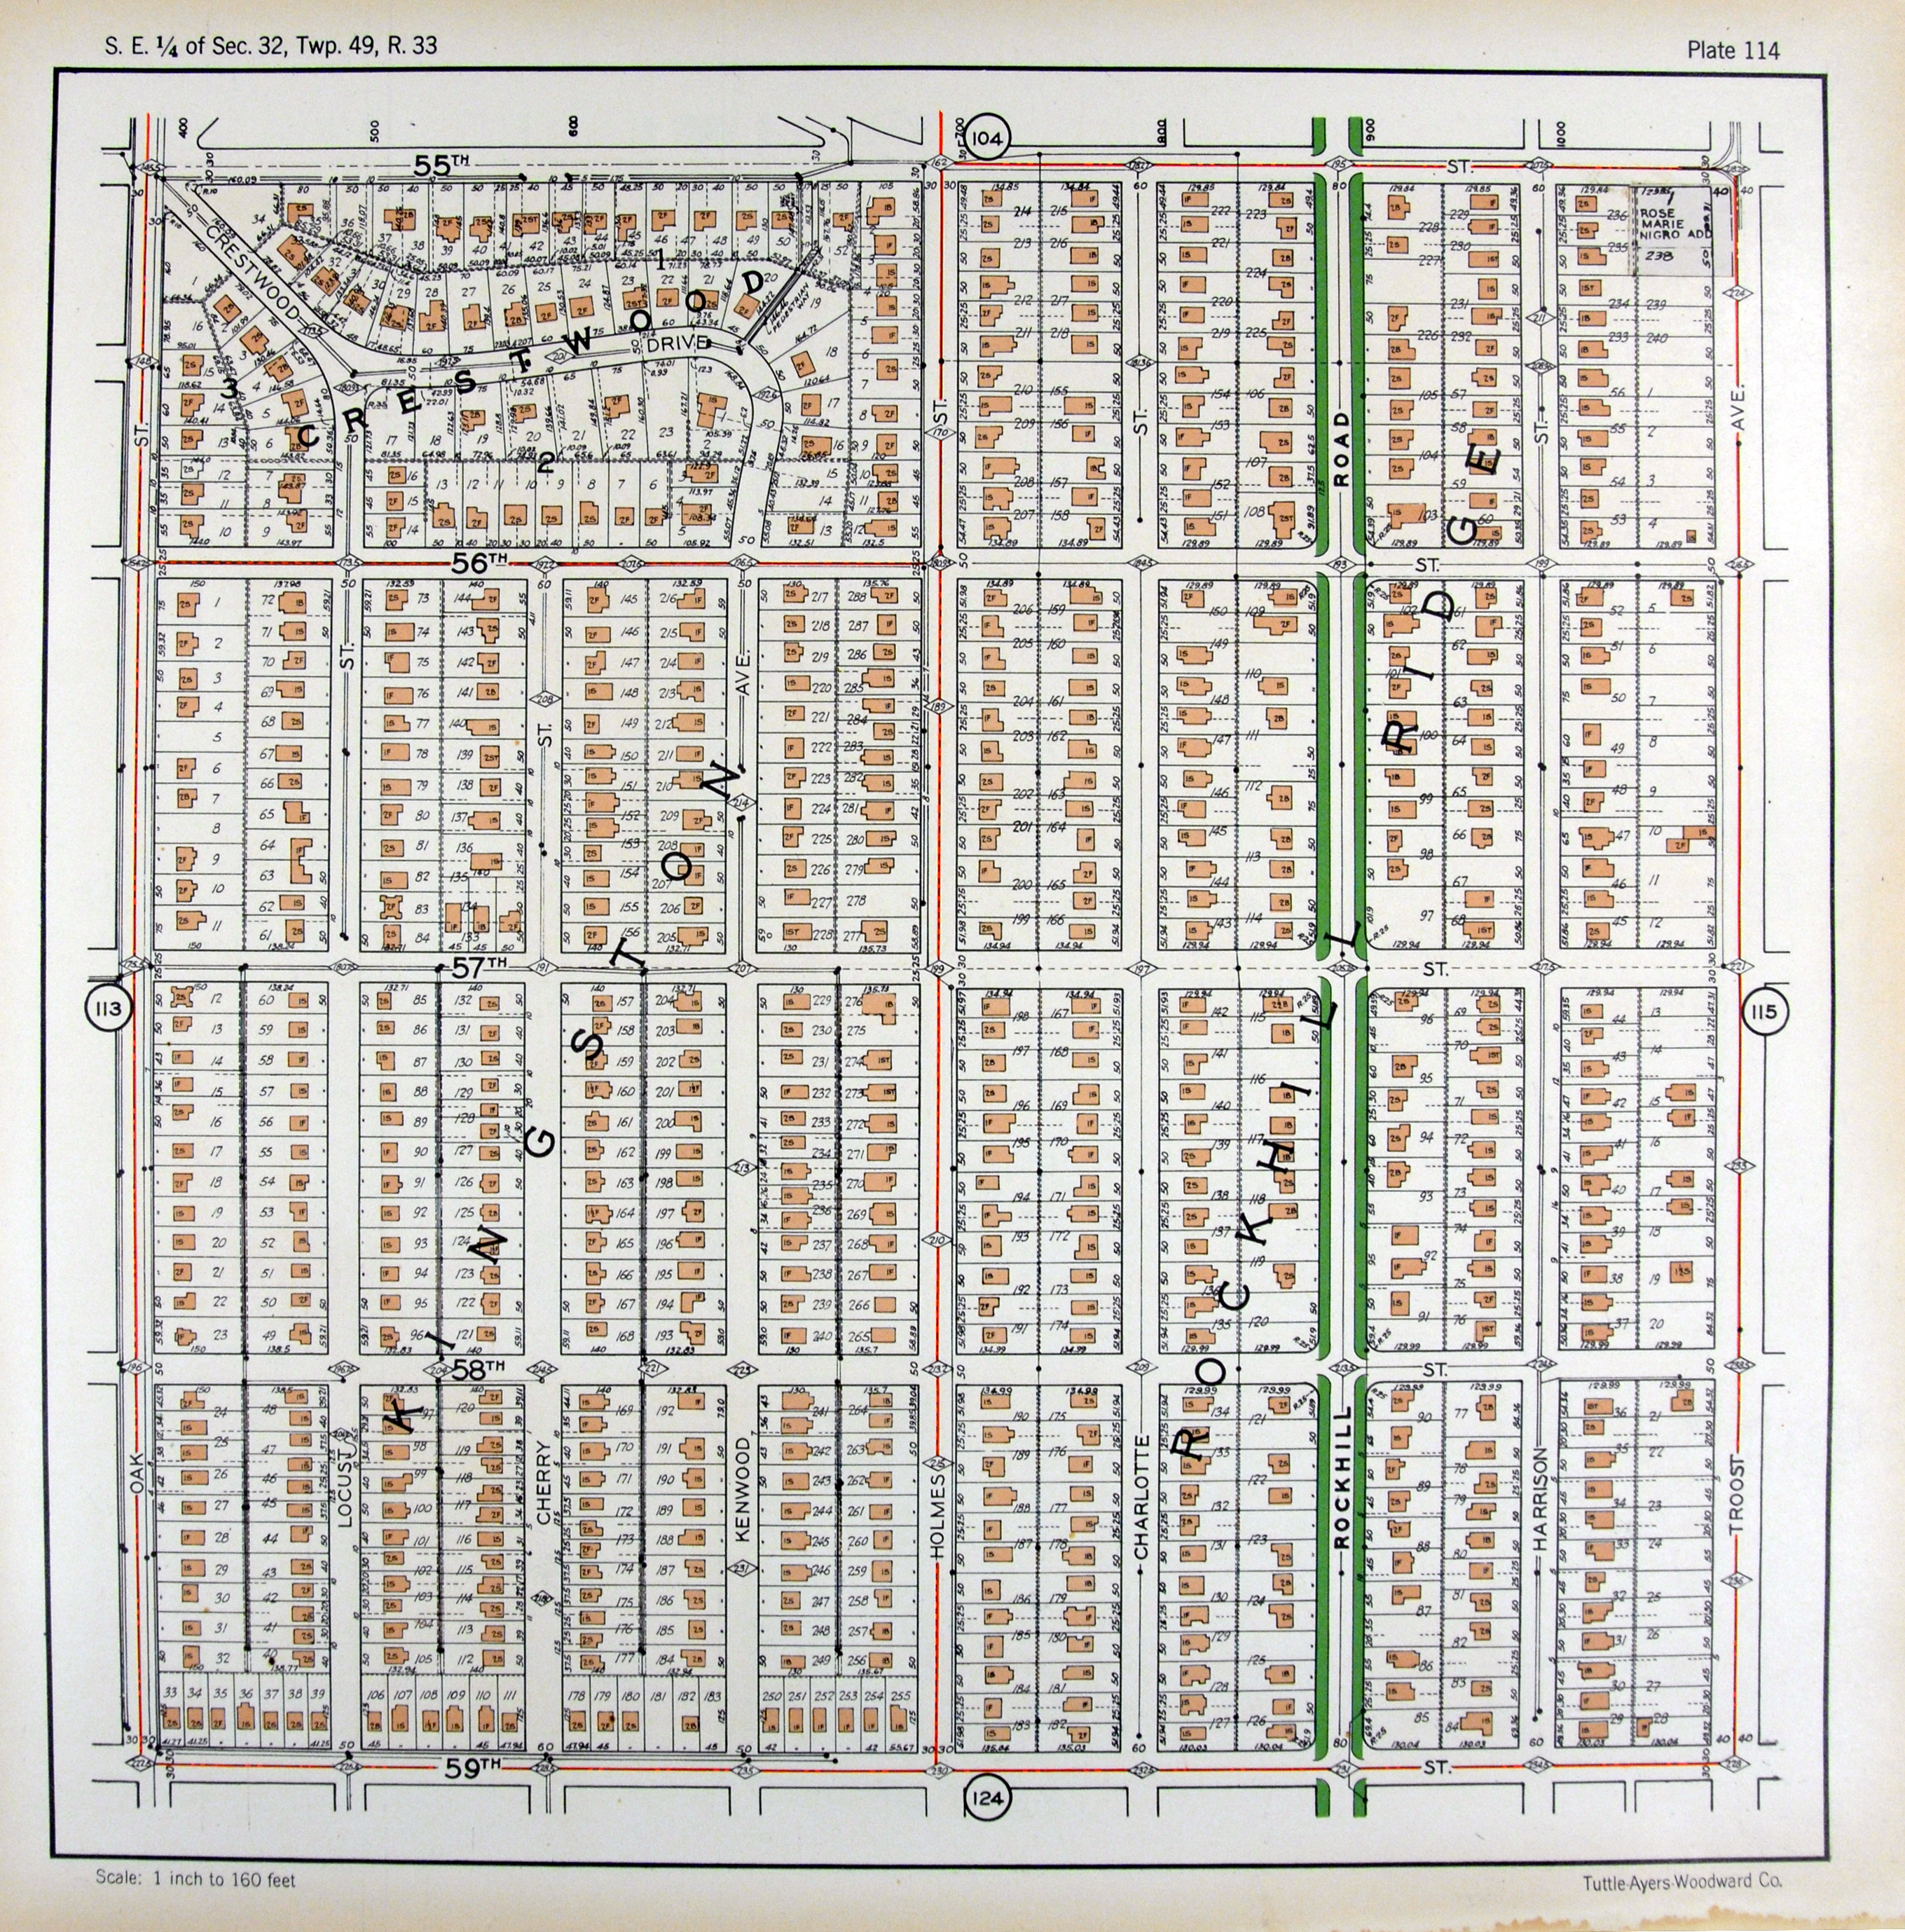
This image here of many of the streets to the west of Troost reveals an interesting amount of regularity in housing as well as a nice break from the grid system, but right along Troost the buildings suddenly seem irregular and spaced out. Although this intrigued me, I can’t make any conclusions based only off of this information.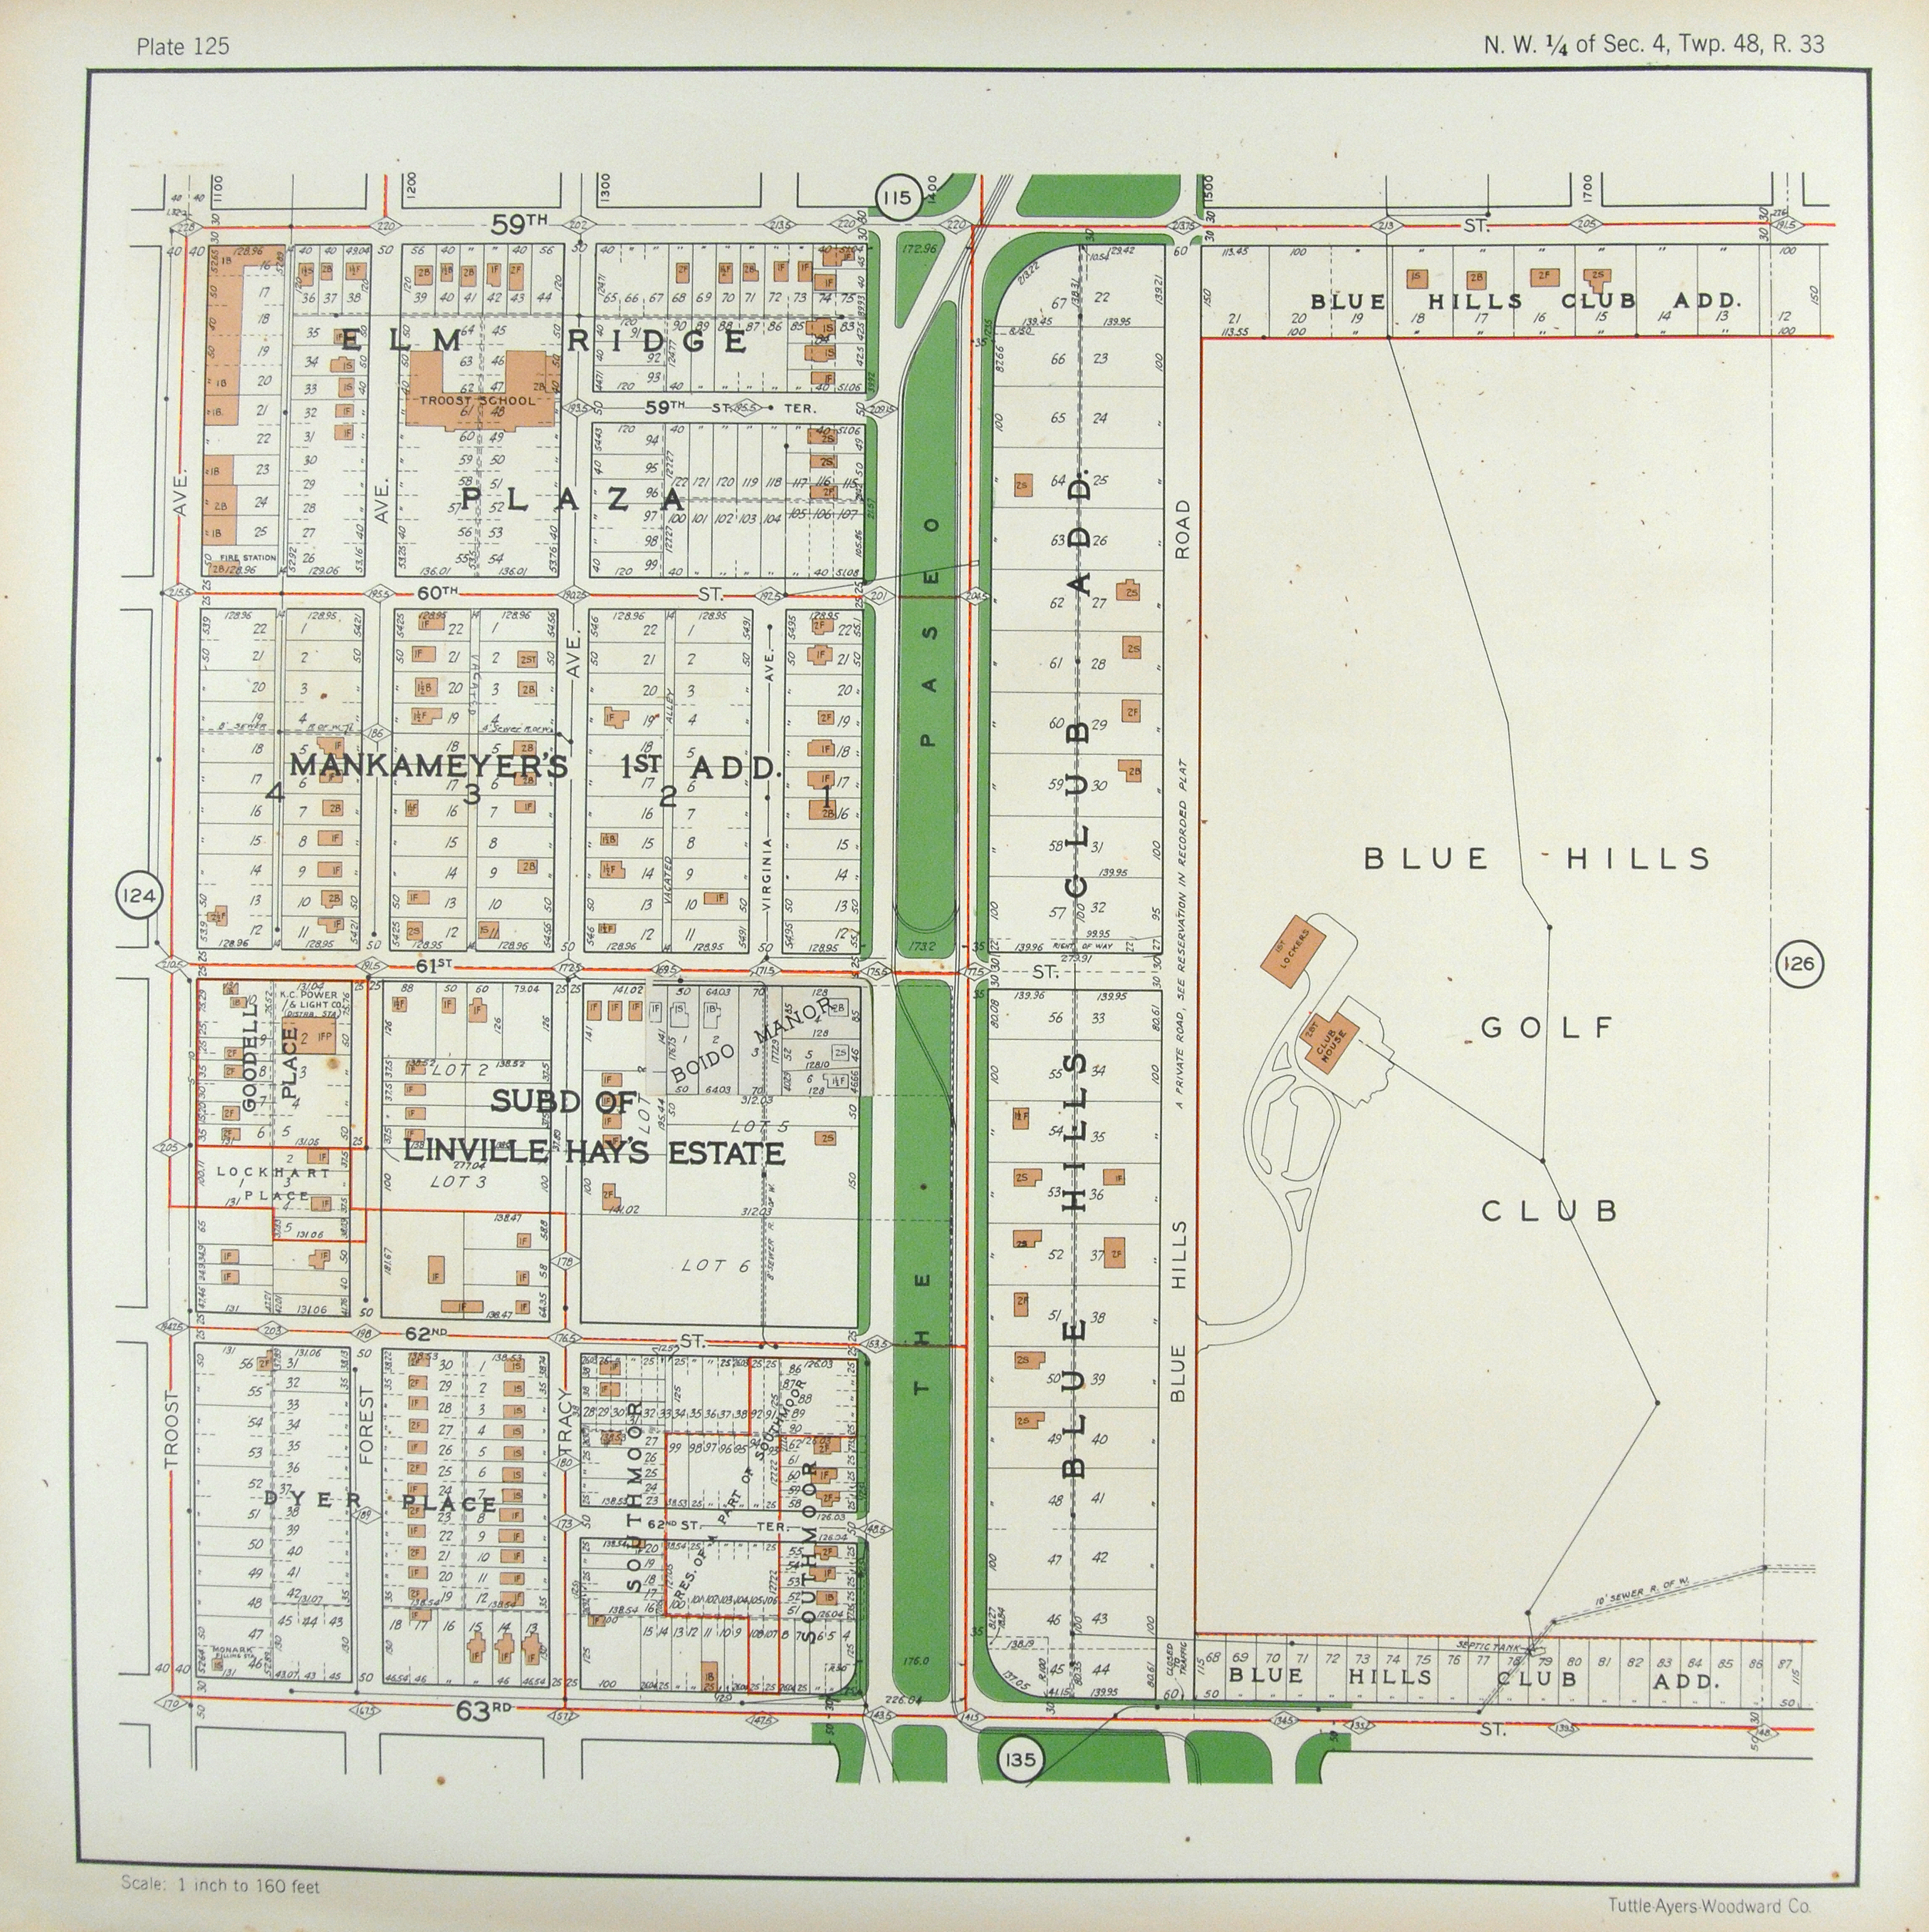
Nothing directly on Troost is of interest here with the same sparse buildings demonstrated earlier, but directly west of these blocks is a school that is still there today along with a golf club, which relocated in 1963. The nature of this area changes a bit in the 1950s, where all along Troost are auto shops, auto sales, and machining shops. That is presumably where the money was at that time. The increase in business interest also meant more buildings, which went stagnant throughout the late 1900s and into present day. Now, density is roughly equivalent to that of the 50s along these blocks of Troost with quite a few auto sales still around.
Troost Avenue Historical Map & Photo Analysis 18th Street – 22nd Street


In 1950(figure ground on the left), the area from 18th street to 22nd street on Troost had a lot more buildings and Troost Avenue was still a straight street. Although it is hard to tell in the 2017 figure ground once Troost intersects with 20th, it curves up and is a bridge that goes over 22nd. I only had two intersections with streets, 18th and 19th, because of how the road has been altered. The map from 1950 was also before the highway was put in to the west of Troost. I believe the highway was a major thing that drove businesses away and the bridge as well because it was a complete reconstruction of the road. The area now is not cared for and majority of the buildings or just objects in that area have graffiti on them. Nobody is out on the streets and I barely saw anybody driving there. It is an industrial area with scrap and salvage yards lining the block. Everything that is a business is either locked up, has a fence with barbed wire, or advertises that they have security cameras. You can tell on certain buildings where the rest has been torn down or where the original windows have been taken out and replaced with conventional ones or just covered with brick completely. You can also tell where two building became one and were just painted the same color. Train tracks run through the area and there was no residential area from 18th to 22nd.
Admiral Blvd- 10th Street Gabrielle Anderson
I found of that Admiral Blvd all the way to Tenth street has really grown over time. It started off with barley any buildings, and it has now evolved into something much greater. There is some empty lots located by Tenth Street, but it doesnt take away from the beauty of the street. It was beautiful to see the advancemnt of the territoy I evaluated. Homeless people were sometimes found walking along the blocks. Independence Avenue a couple of blocks away is known for drug deals and prostitution, so that was something I never knew about until I went down there. The sandborn maps were cool to look at, and they really helped me get a better understanding on what I was looking at.
25th and 28th Street
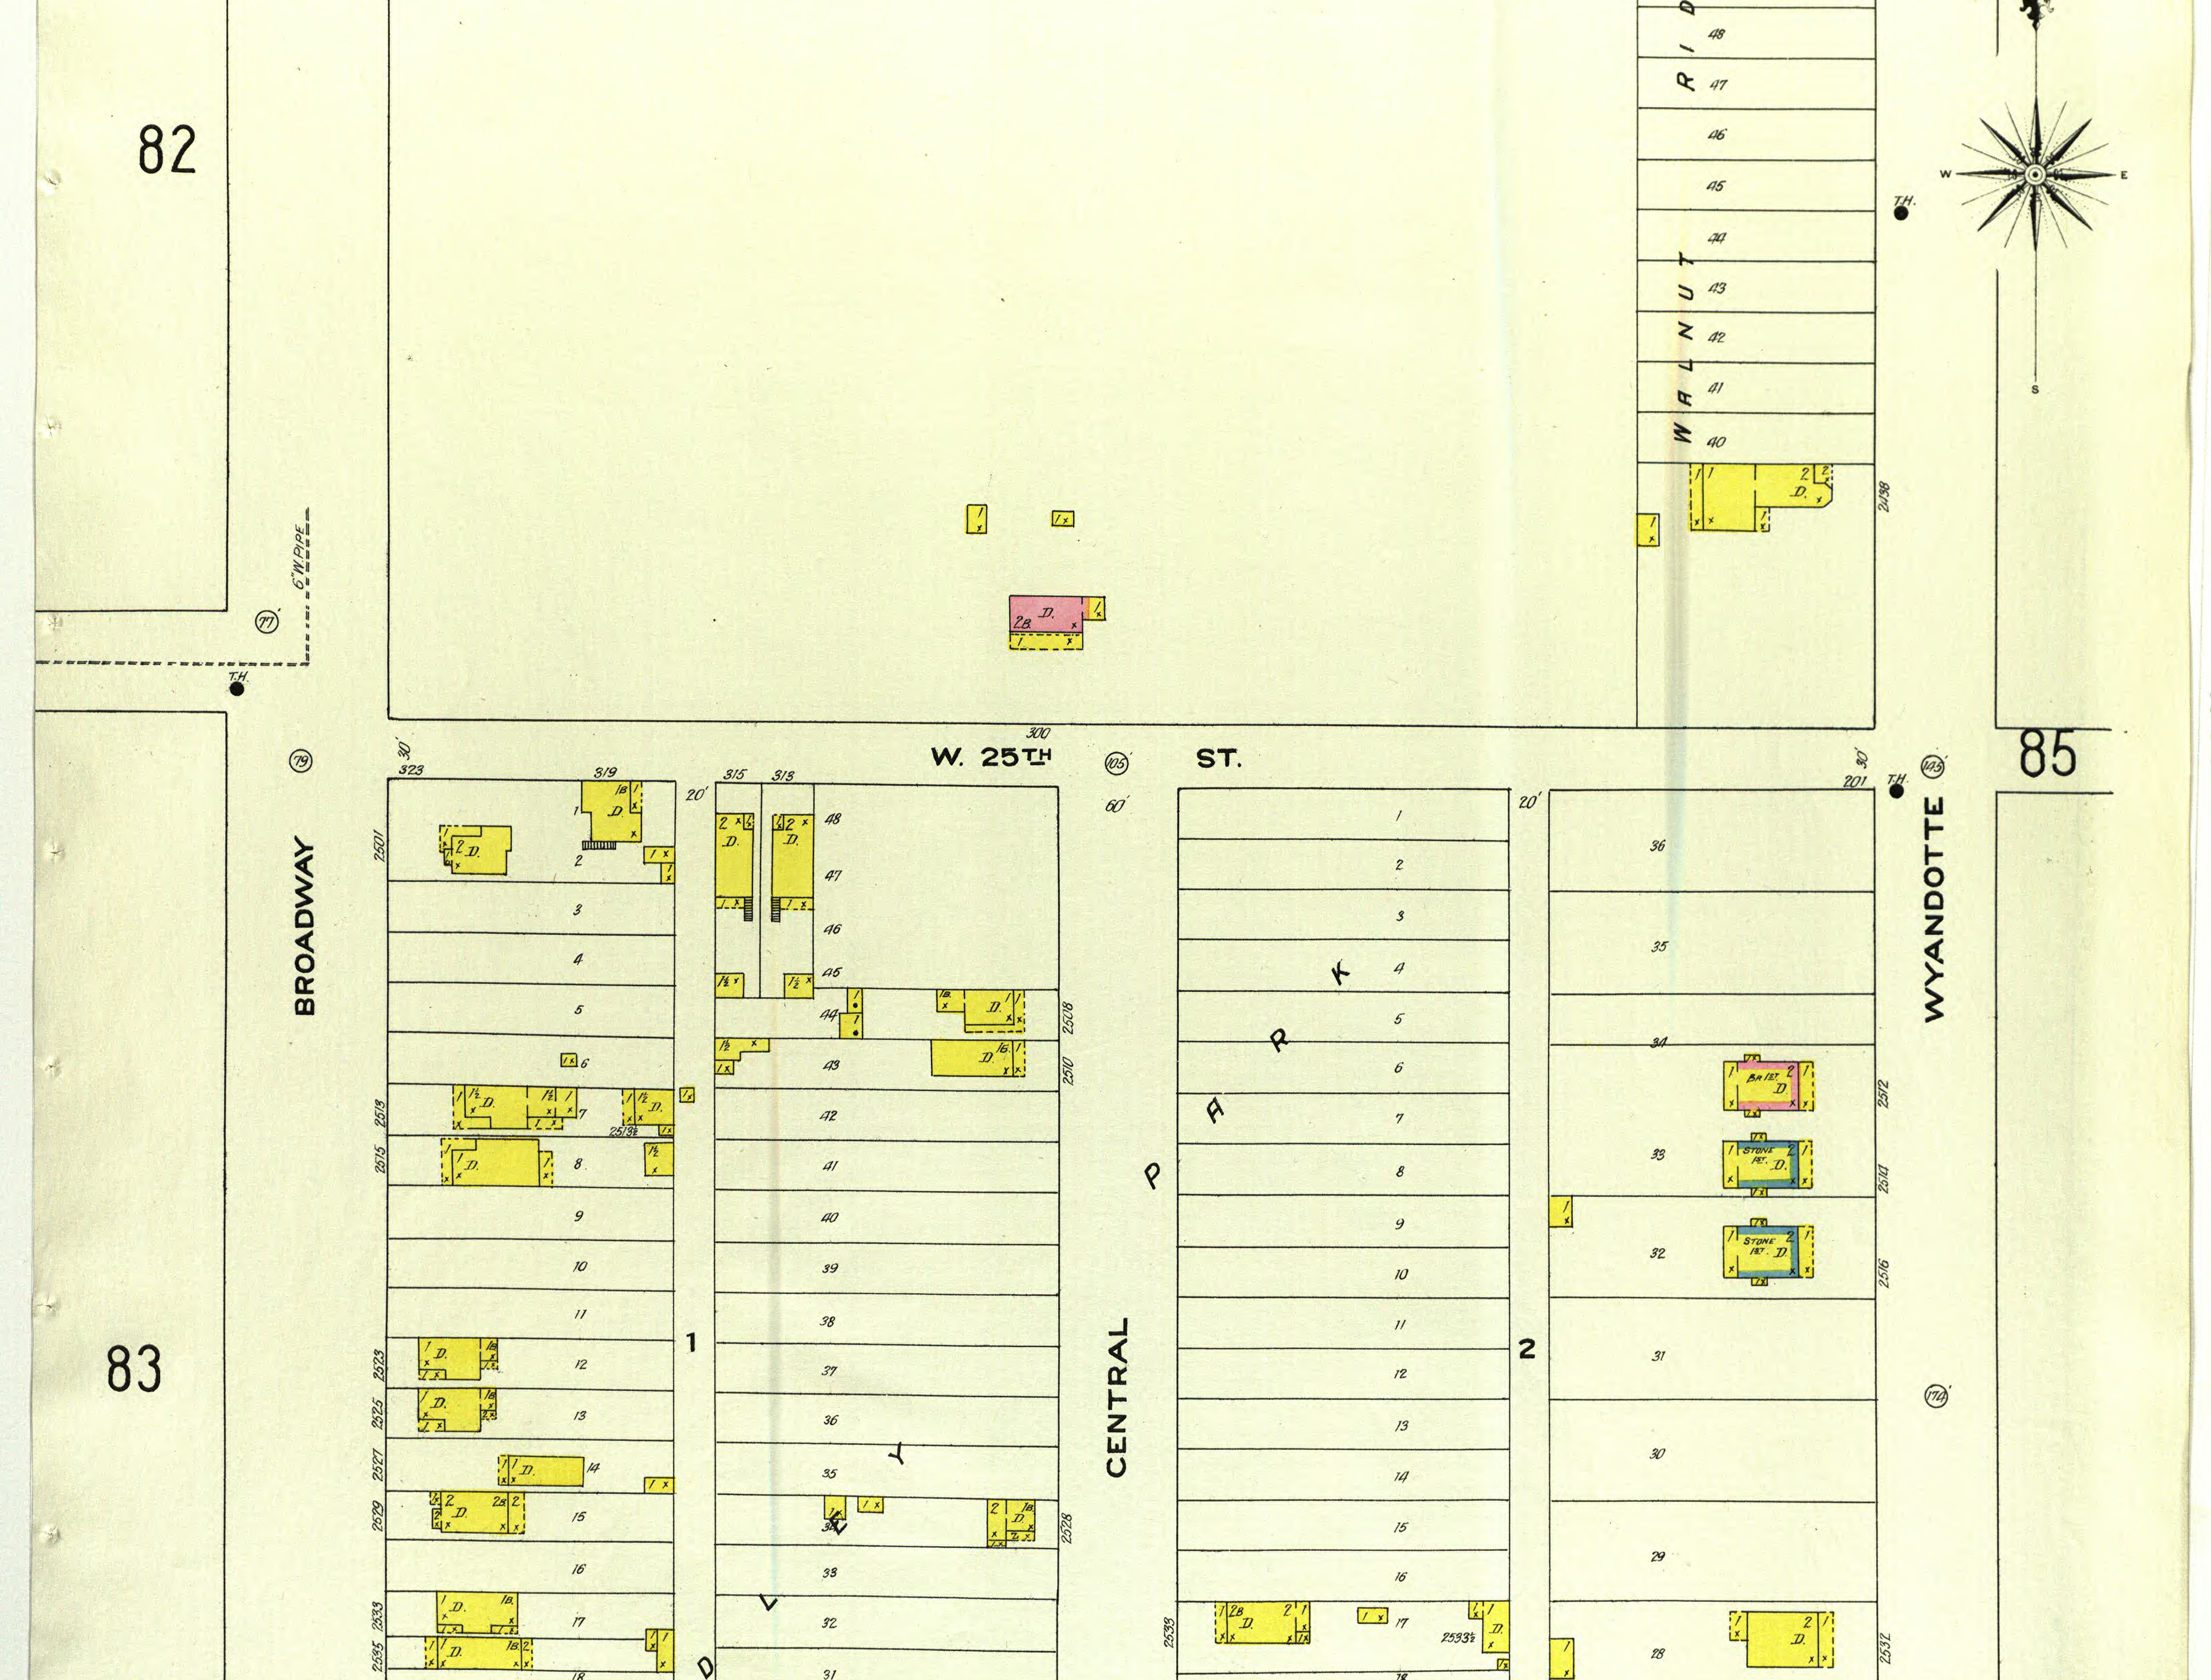
For the Historical Map and Photo Analysis project I was assigned the 25th and 28th street blocks. The streets were not included in the early 1895 Sanborn maps due to their higher numbers. 25th street in its early period was lacking much development. The Sanborn maps showed one or two buildings per page. As the maps moved more westward there was evidence of more development and the area appeared more commercial. For 28th street the earliest Sanborn maps were similar to 25th street with buildings spread sporadically throughout the images. Current developments of the streets support the early Sanborn maps. 25th street is a residential area for the most part but as you move further westward the scenery changes to a more commercial area, with the UMKC hospital hill campus in the area. For 28th street it remained more residential with the development of several parks in the area and also the union cemetery.
Images 25th and 28th streets
Troost Ave. From 25th street to 27th street
The 25th through the 27th blocks of Troost Avenue have since at least 1885 been primarily residential homes. With many of the properties to the west having single family homes and the east side morphing from similar homes into apartment homes it endorses the idea of Troost being the racial dividing line with whites on the west and blacks on the east. The are is now a large apartment complex to the west and currently abandoned and barren to the east with a new development soon to come.
Troost Avenue : Between 43rd Street and Brush Creek BLVD
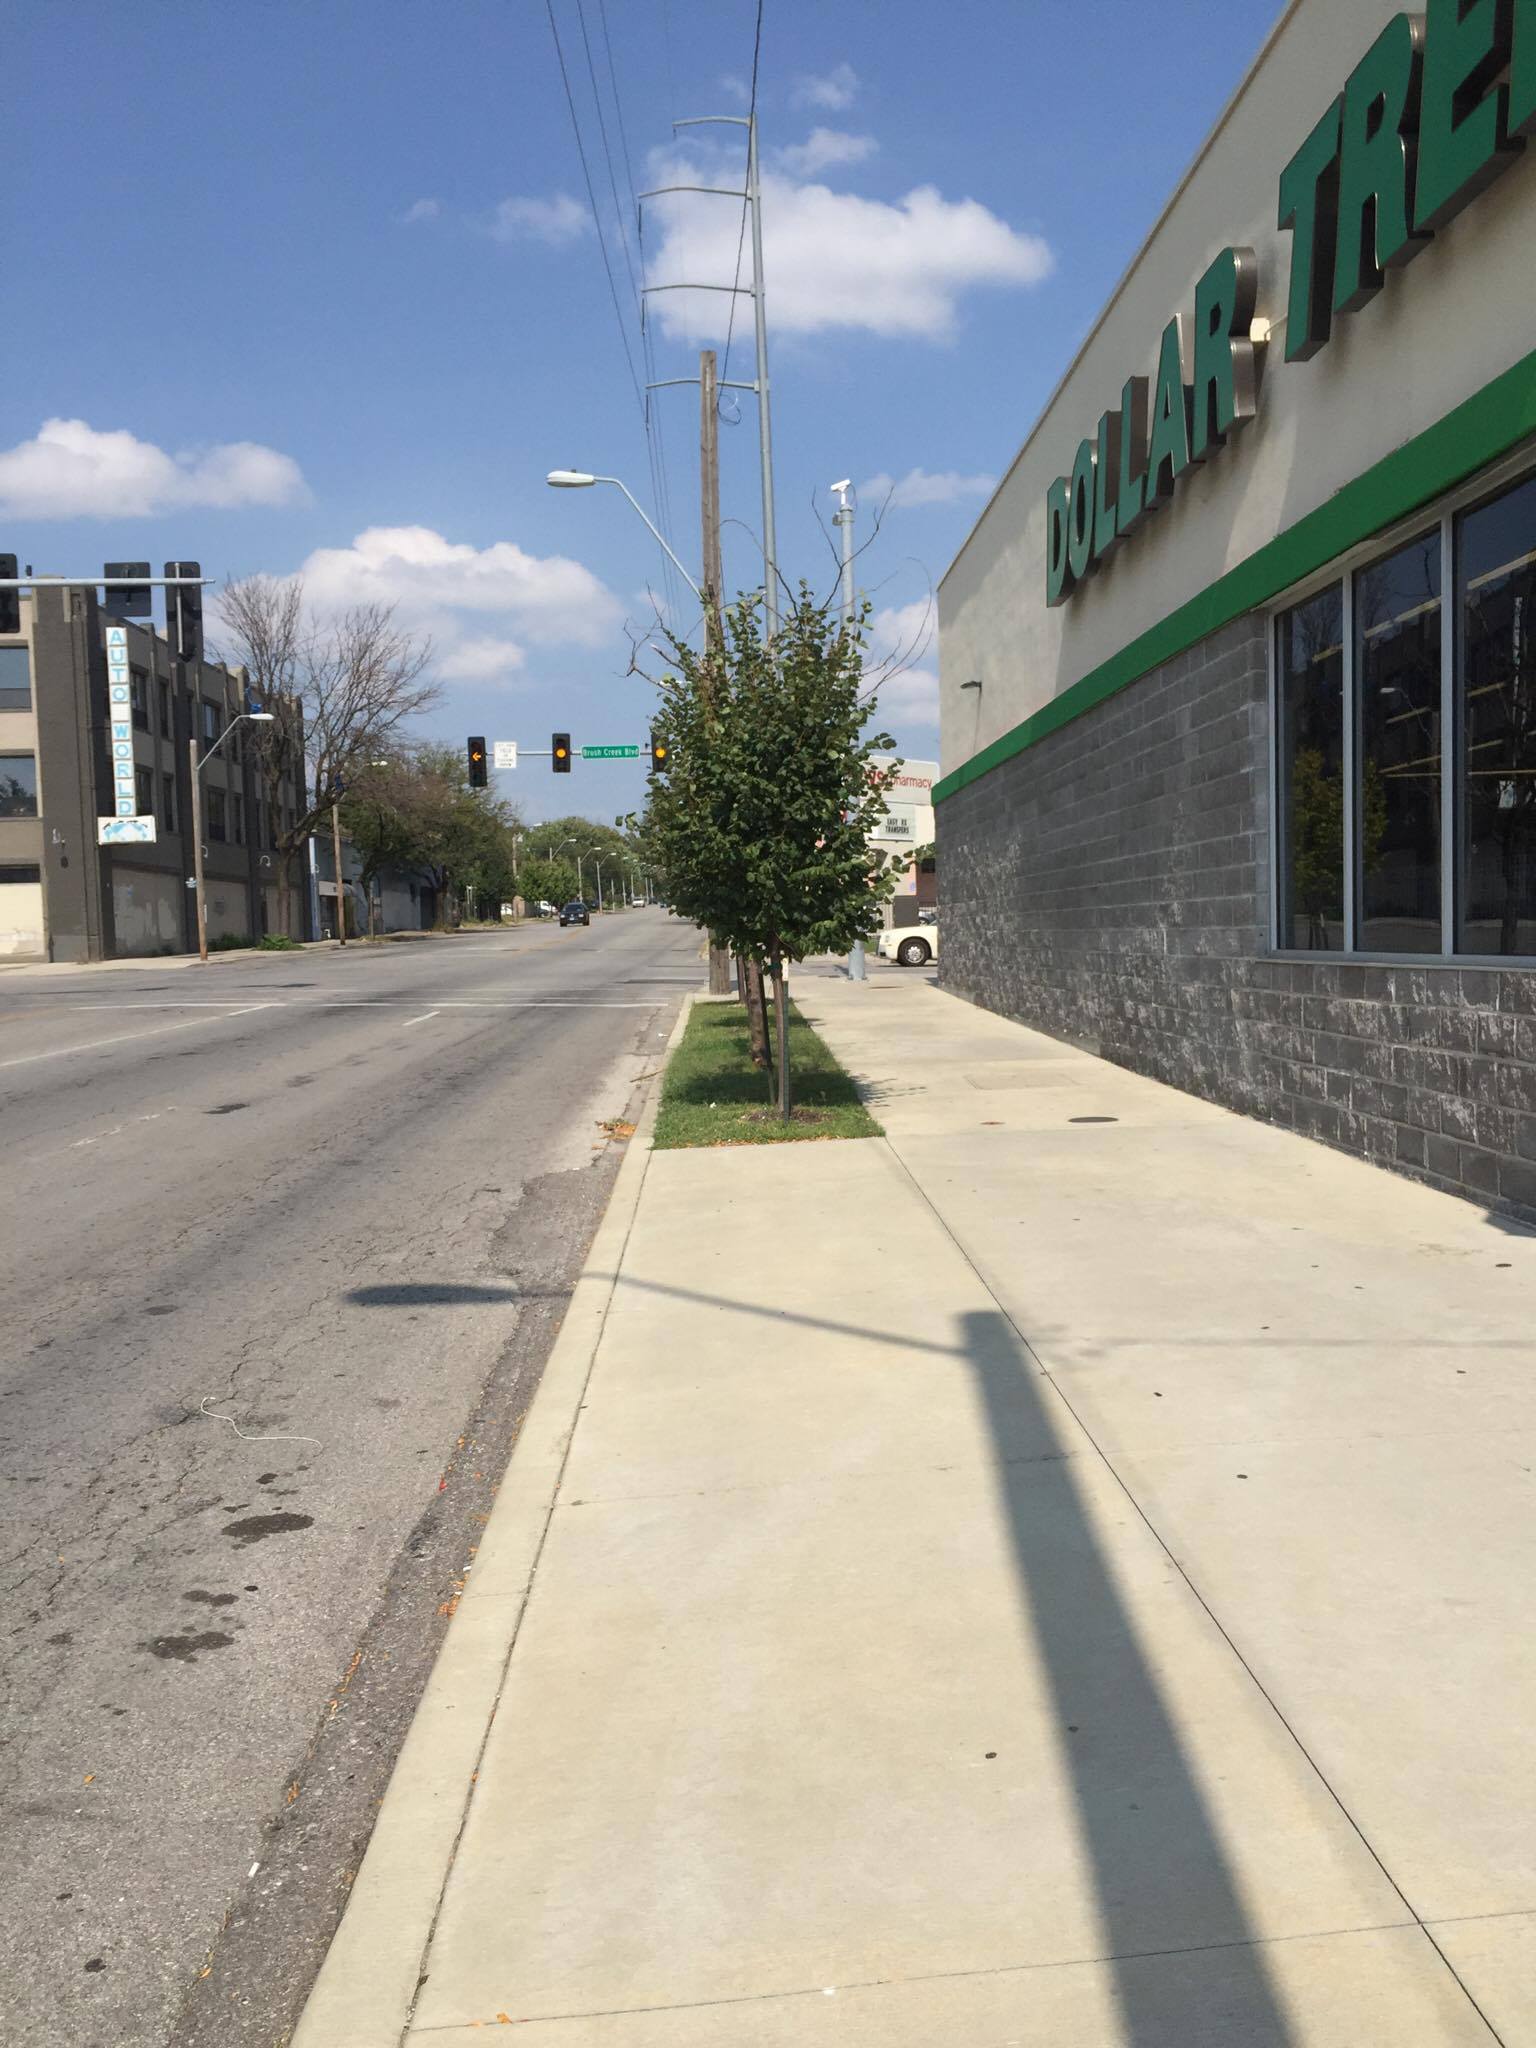
Troost Avenue is a major street that stretches north to south in Kansas City, Missouri. The development of Troost avenue began in the year of 1834 near 31st Street and the street continued to develop into the 1900s, introducing movie theaters, apartments, retail stores and more. Troost avenue is also historically known as a racial dividing line in Kansas City. My research was over Brush Creek BLVD and 43rd street along Troost avenue. It has a few changes overtime for example, It went from grid setting into more commercial place and the grids begin to dense with businesses and residents. Business like Cars & Auto were more dominant in the period of 1909 to 1950 but eventually it started to decrease in those businesses. Shopping business like CVS, Dollar tree were introduced as well as bus transportation system like RideKC and Max in the present time but it is still is a dividing residential place between high incomes and low income.
Troost, From Meyer Boulevard south to 66th Terrace and Environs.
The area of Troost just south of Meyer Boulevard has always been of a commercial character. However, a number of east-west streets in the area contain an interesting mix of home styles and vintages.
For example, on 65th Street, the lots on the eastern extent, near The Paseo were the first to be developed. This construction occurred in the late 1910’s and 1920’s. At that time, The Paseo was a thriving residential boulevard and one of the premier addresses in the city. It makes sense that the lots nearest the grand boulevard would be the most desirable.
The humble commercial nature of Troost made the western extent of the block less desirable for residential development. Much of this end of the block remained undeveloped until the housing shortage following WWII.
The staggered development of the block led to some interesting contrasts in residential architecture. On the western portion, one will find a mix of craftsman bungalows, traditional four-squares with front porches, and Tudor styles. All popular in the early 20th century. The eastern portion features cape cods, split-levels, and simple post-war vernacular homes. These styles were popular and inexpensive to construct after the World War.
Many of these homes still exist today. Some have undergone extensive renovations, masking the identifying characteristics common to their types, but with close examination you can recognize the same home in modern and antique photographs.
Troost Ave and 10th St. – 13th St.
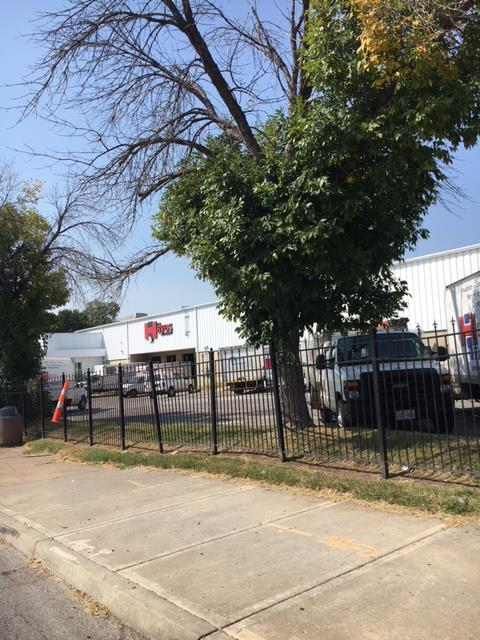
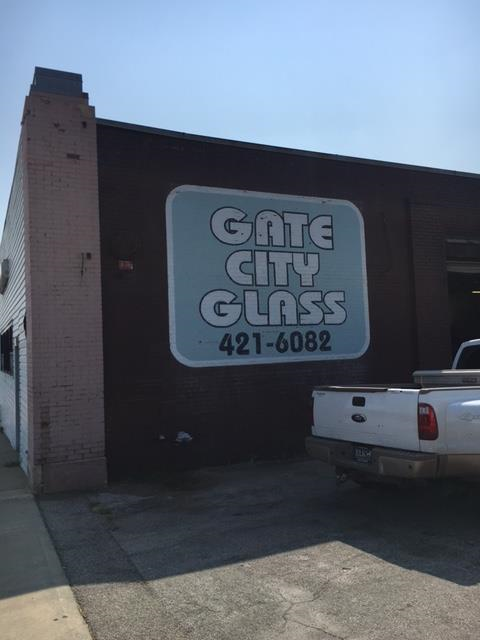
Troost Ave. have been a major dividing line in Kansas City, MO. since I can remember. I had the opportunity to research the area of Troost Ave and 10th St. – 13th St. When I first arrived, the area seemed very dead and there was only a few businesses. There was not much automobile traffic in the area but there was a good amount of people traveling by foot. I noticed three bus stops on the main corners. The City Union Mission building is right on the corner of 10th and Troost Ave and seemed to attract many homeless people to this area. I was only at my location for less than an hour, but I had multiple people come up to me and ask if I had any extra cash I could spare. I also noticed there were some people sleeping in the sidewalks. Below are images of the main buildings/businesses between 10th St and 13th St on Troost Ave. In these photos, one can see most of the businesses are surrounded by tall black metal gates which makes me believe they are trying to keep people out.
This was only my experience for less than an hour. After researching I notices that Troost Ave. was once a major street for business and homes. Overtime, these four blocks went from residential housing to a more industrial area. It is truly sad to see such a important street with so much history go down the drain. Below are images of what is now Troost Ave. and 10th St. – 13th St. You can see how deserted the area has become over the years.


Troost Ave. Between 52nd/Rockhurst and 55th
The 53rd block of Troost Avenue is home to many buildings owned by Rockhurst University. Michael Dowling, founder, purchased 25 acres in 1909 which in the next year would become Rockhurst College. The college later merged with Rockhurst High School in 1923. The college remained on site and the two institutions used the same campus until the high school moved to a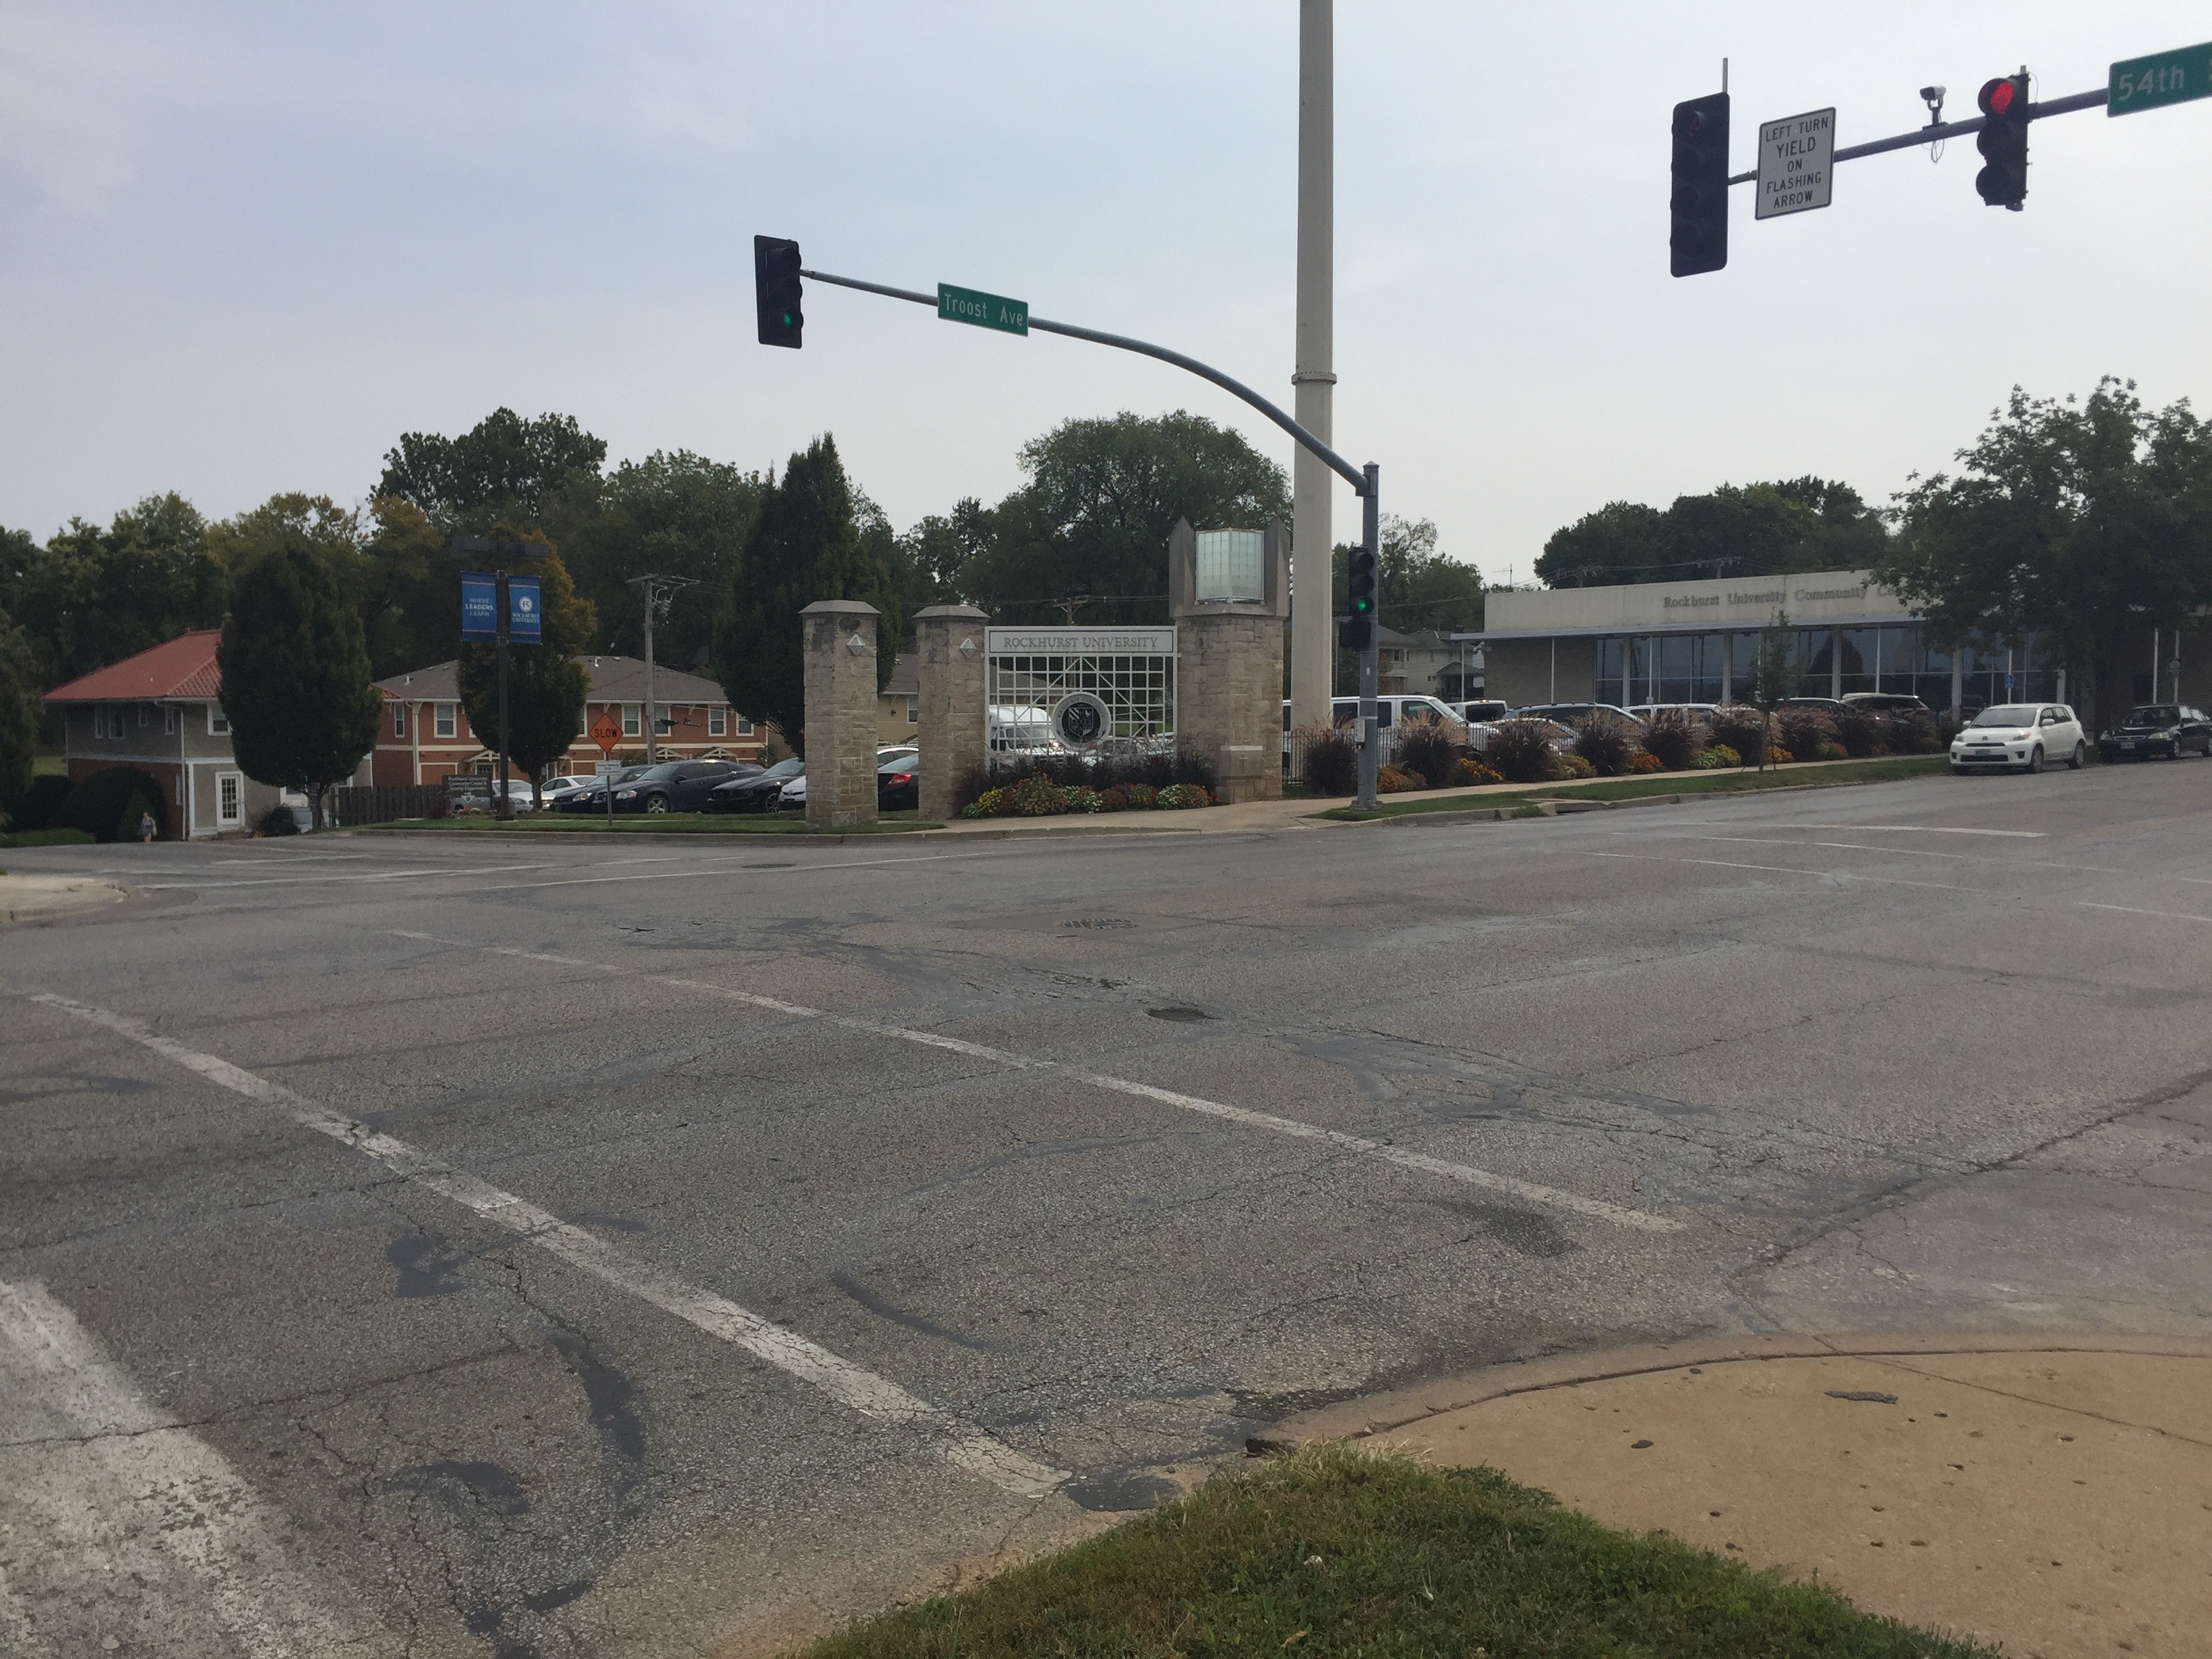 separate location in 1962.
Troost Ave. Between 31st St. and Armour Blvd.
Since 1896, the area between 31st Street and Armour Boulevard on Troost Avenue has evolved from a neighborhood of scattered homes, to a bustling commercial and entertainment district, to a graveyard for abandoned properties. The 1896 Sanborn maps show many large, undeveloped lots, with homes scattered around the street–the area was entirely residential. By 1951, however, the area between 31st and 33rd streets had developed into a commercial district full of theatres, drugstores, bowling alleys, banks, and rest stops. South of 33rd St. remained primarily residential, and it was a dense neighborhood with many homes. Today, only a few houses remain, and many properties–both commercial and residential–have been destroyed or abandoned, leaving the area an empty shell of its former self.
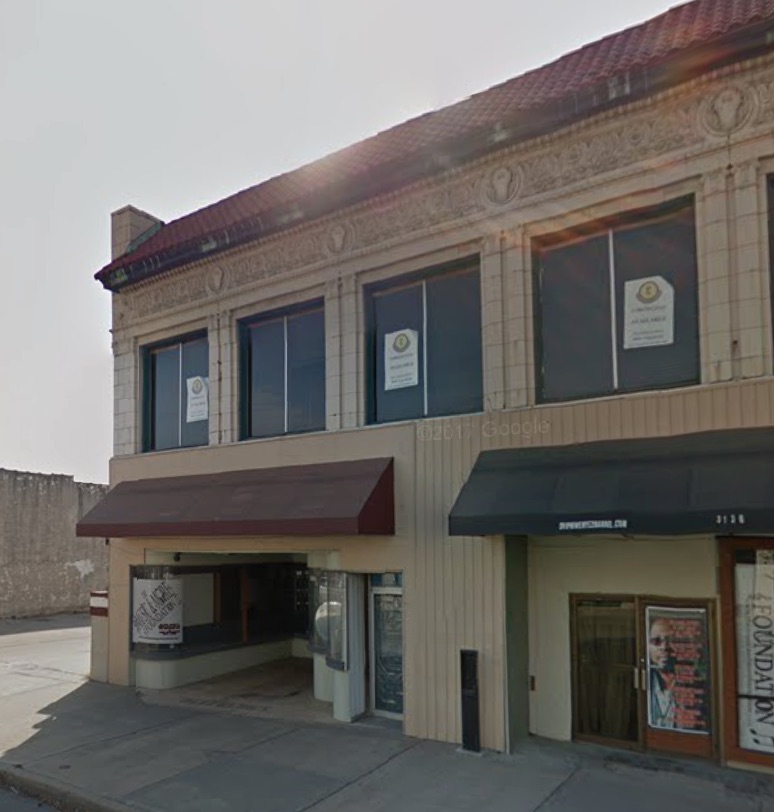
Troost Ave. between 70 st. and 72nd ter.
Troost Ave. is home to an extraordinary graveyard around 70th street. Shortly after the area where Troost Ave. was bought by the city, the Cavalry Cemetary was built. This monstrous cemetery was designed against the grain of the grid that surrounds it’s with winding pathways and beautiful landscaping. This is a Catholic cemetery that holds over sixteen thousand internments, dotted with grand moments of the famous and rich. Theodore Roosevelt even remarked that these grounds consisted of the finest collection of trees he had ever seen.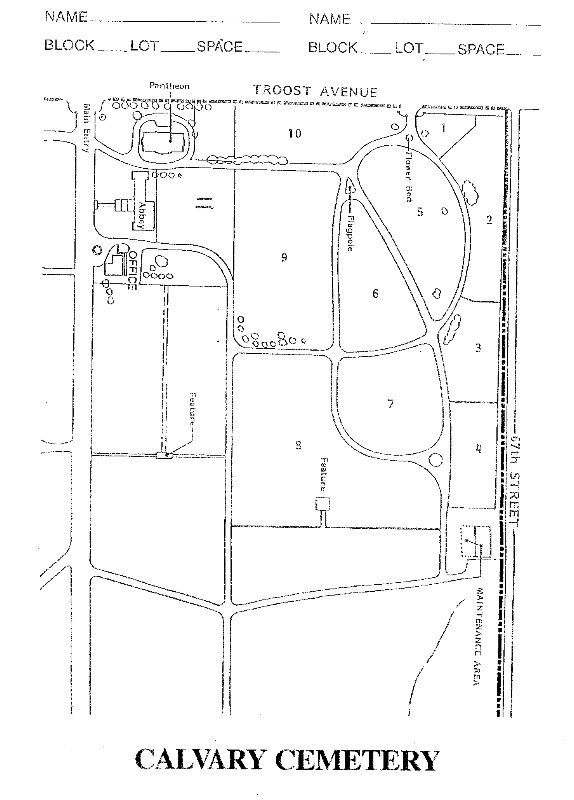
Analysis of Troost Ave. Between 40th St. and 43rd St.
Troost Avenue between 40th Street and 43rd Street is dominated by residential land use with few operating commercial buildings today. Iron bars placed on home windows and doors and high fences surrounding businesses suggest a lack of sense of security within the community. Little human activity occurs on the streets and what does stems from the Ride KC bus stops along the avenue, the only recent reinvestment seen within the three blocks. The earliest maps of the blocks are from 1909 which show few structures and many undeveloped lots. The area has slightly decreased in density from 1951 to 2017. The decrease in density is due to the demolition of many homes. Yet, those houses and apartment complexes still seen today are the original buildings from the early 1900’s. 1951 marked the peak of economic growth within the area with the most stores operating at the time. Since then, due to the disinvestment of the area, 40th Street to 43rd Street has many vacant building spaces that have not had reinvestment put back into them.
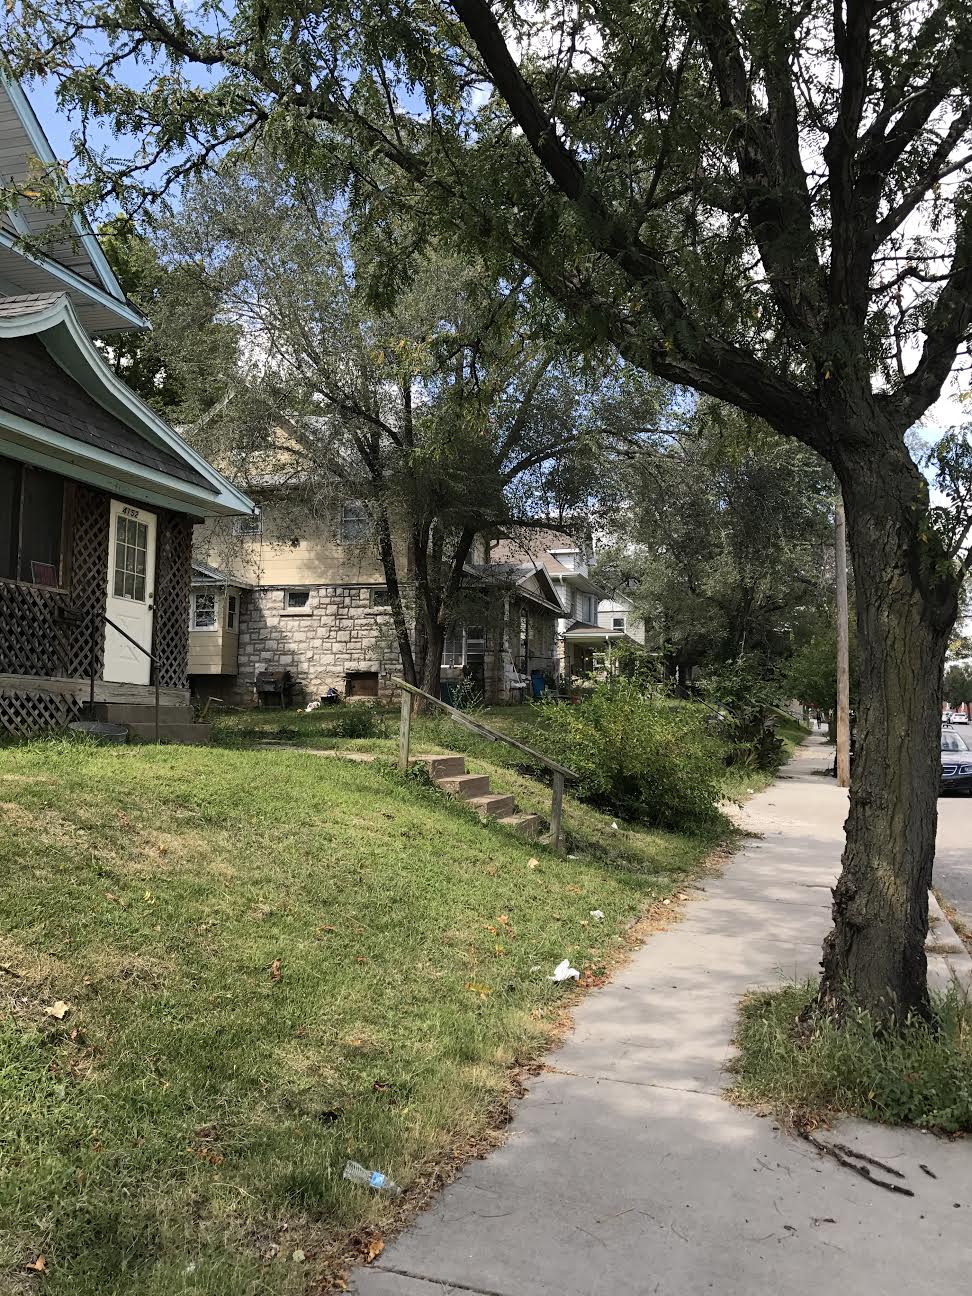
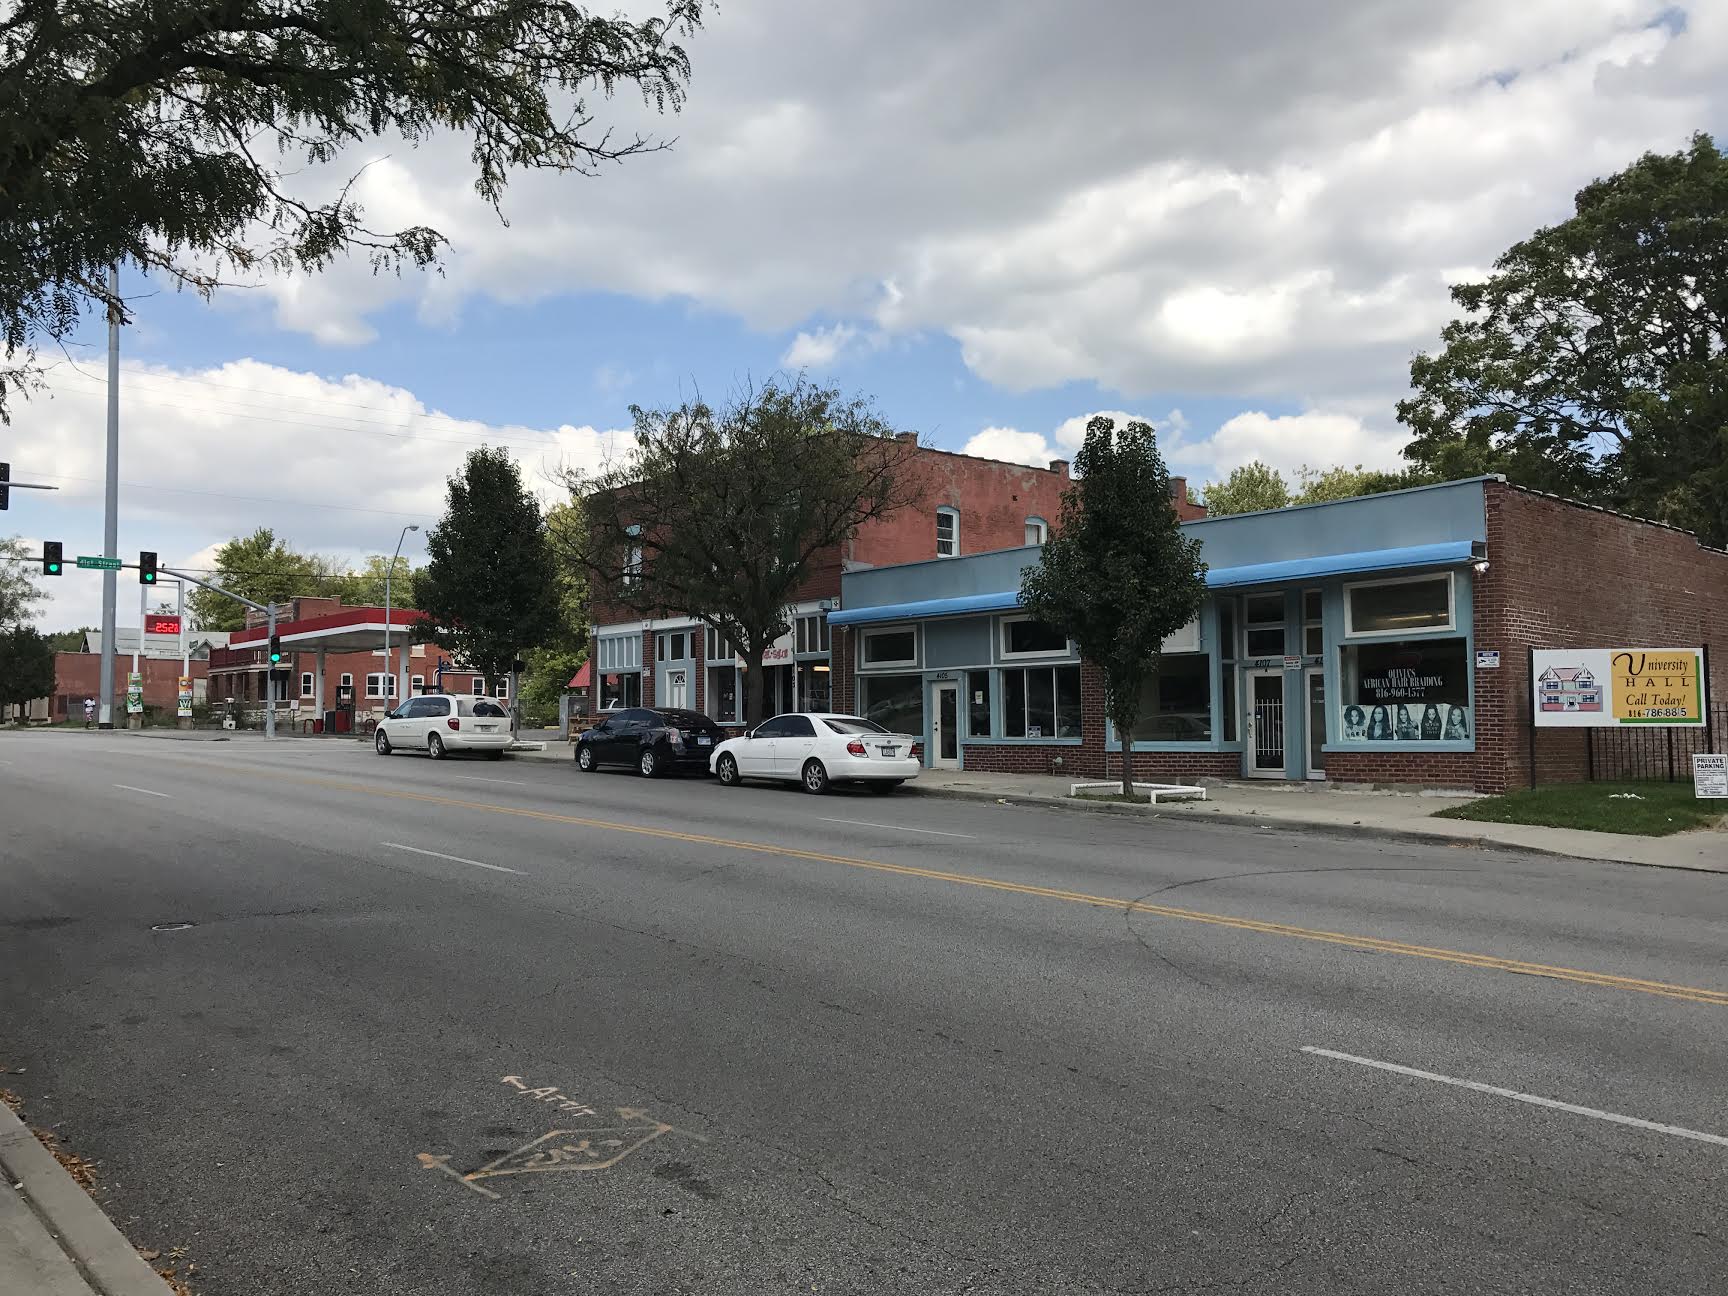
Troost Avenue Between Volker Boulevard and 52nd Street/Rockhurst Road
Troost Avenue from Volker Boulevard to 52nd Street/Rockhurst Road is an area that is dominated by two land uses- institutional and residential. On the west side of Troost, a portion of the UMKC campus can be found on the blocks bounded by 50th to 52nd Streets and Troost to Rockhill Road. The campus of The Stowers Institute for Medical Research can be found on the block just north of UMKC. The east side of Troost comprises of the two neighborhoods- Troostwood and Rockhurst Park as well as a small portion of the Rockhurst University campus on the corner of Troost and Rockhurst Road.
The western side of Troost has boomed over the last 70 years with expansions to both the UMKC campus and the Stowers Institute campus, which in 1950 was Menorah Hospital. The additions of Katz Hall, as well as the Spencer Chemistry and Biological Sciences, and other general buildings were added between 1965-1975 on the UMKC campus. The Menorah Hospital had several expansions after 1950 and eventually became the Stowers Institute around 2000.
Comparatively, the residential side hasn’t changed as much since 1950. The demolition of all homes facing Troost Avenue and 49th Street were the biggest changes seen on this side. In the Troostwood neighborhood, these demolished homes were replaced by seven low income housing opportunities known as the Troostwood Townhomes. In the Rockhurst Park neighborhood, the demolished homes were replaced by a Go Chicken Go restaurant, a Rockhurst University parking garage, as well as two other Rockhurst University buildings.
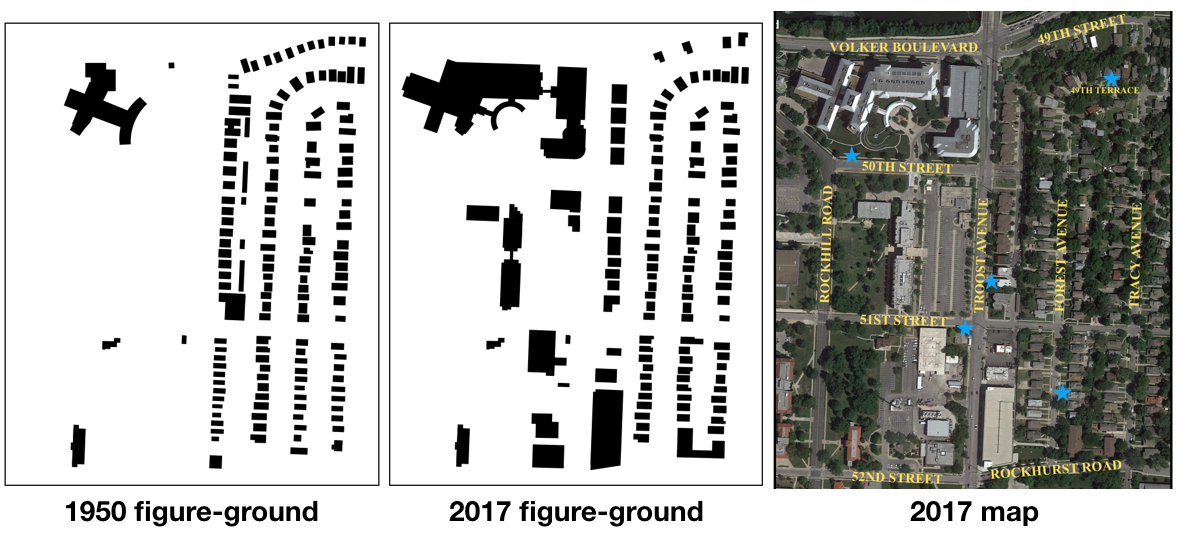
East 13th Street and Truman Road
After the 1960s into the 1980s, Missouri shifted its interest from expanding highways in rural and primary areas to urban areas. To quote an article made by the Missouri Department of Transportation, “In addition, the construction of urban interstate highways frequently led to the destruction of vibrant, working-class neighborhoods in both St. Louis and Kansas City. Interstate construction disproportionately affected poor, ethnic residents in urban areas. Highway planners wanted to keep costs low, so they designed roads that went through depressed neighborhoods where property values were low and right of way could be acquired cheaply.” (Missouri Department of Transportation, 2006). Minority neighborhoods were deeply affected and citizens were furious. When looking at the assigned area of East 13th Street and Truman Road along Troost Avenue, there’s not a robust residential area. The building of I-70 in my assigned area, explained a lot as to what I saw when going to my assigned area around East 13th Street and Truman Road, the area near 70 highway; it was extremely underdeveloped. There were plots of land that were vacant with a few businesses not open to the general public like All Services Home Healthcare and a General Parts store. Being downtown and near the Salvation Army and The City Union Mission, there were quite a few of homeless people. Little to no housing was in sight, The total population of the assigned area in the U.S. Census tract 154 of Jackson County was 5,847 out of a total population of 459,787 (U.S. Census Bureau, 2010).
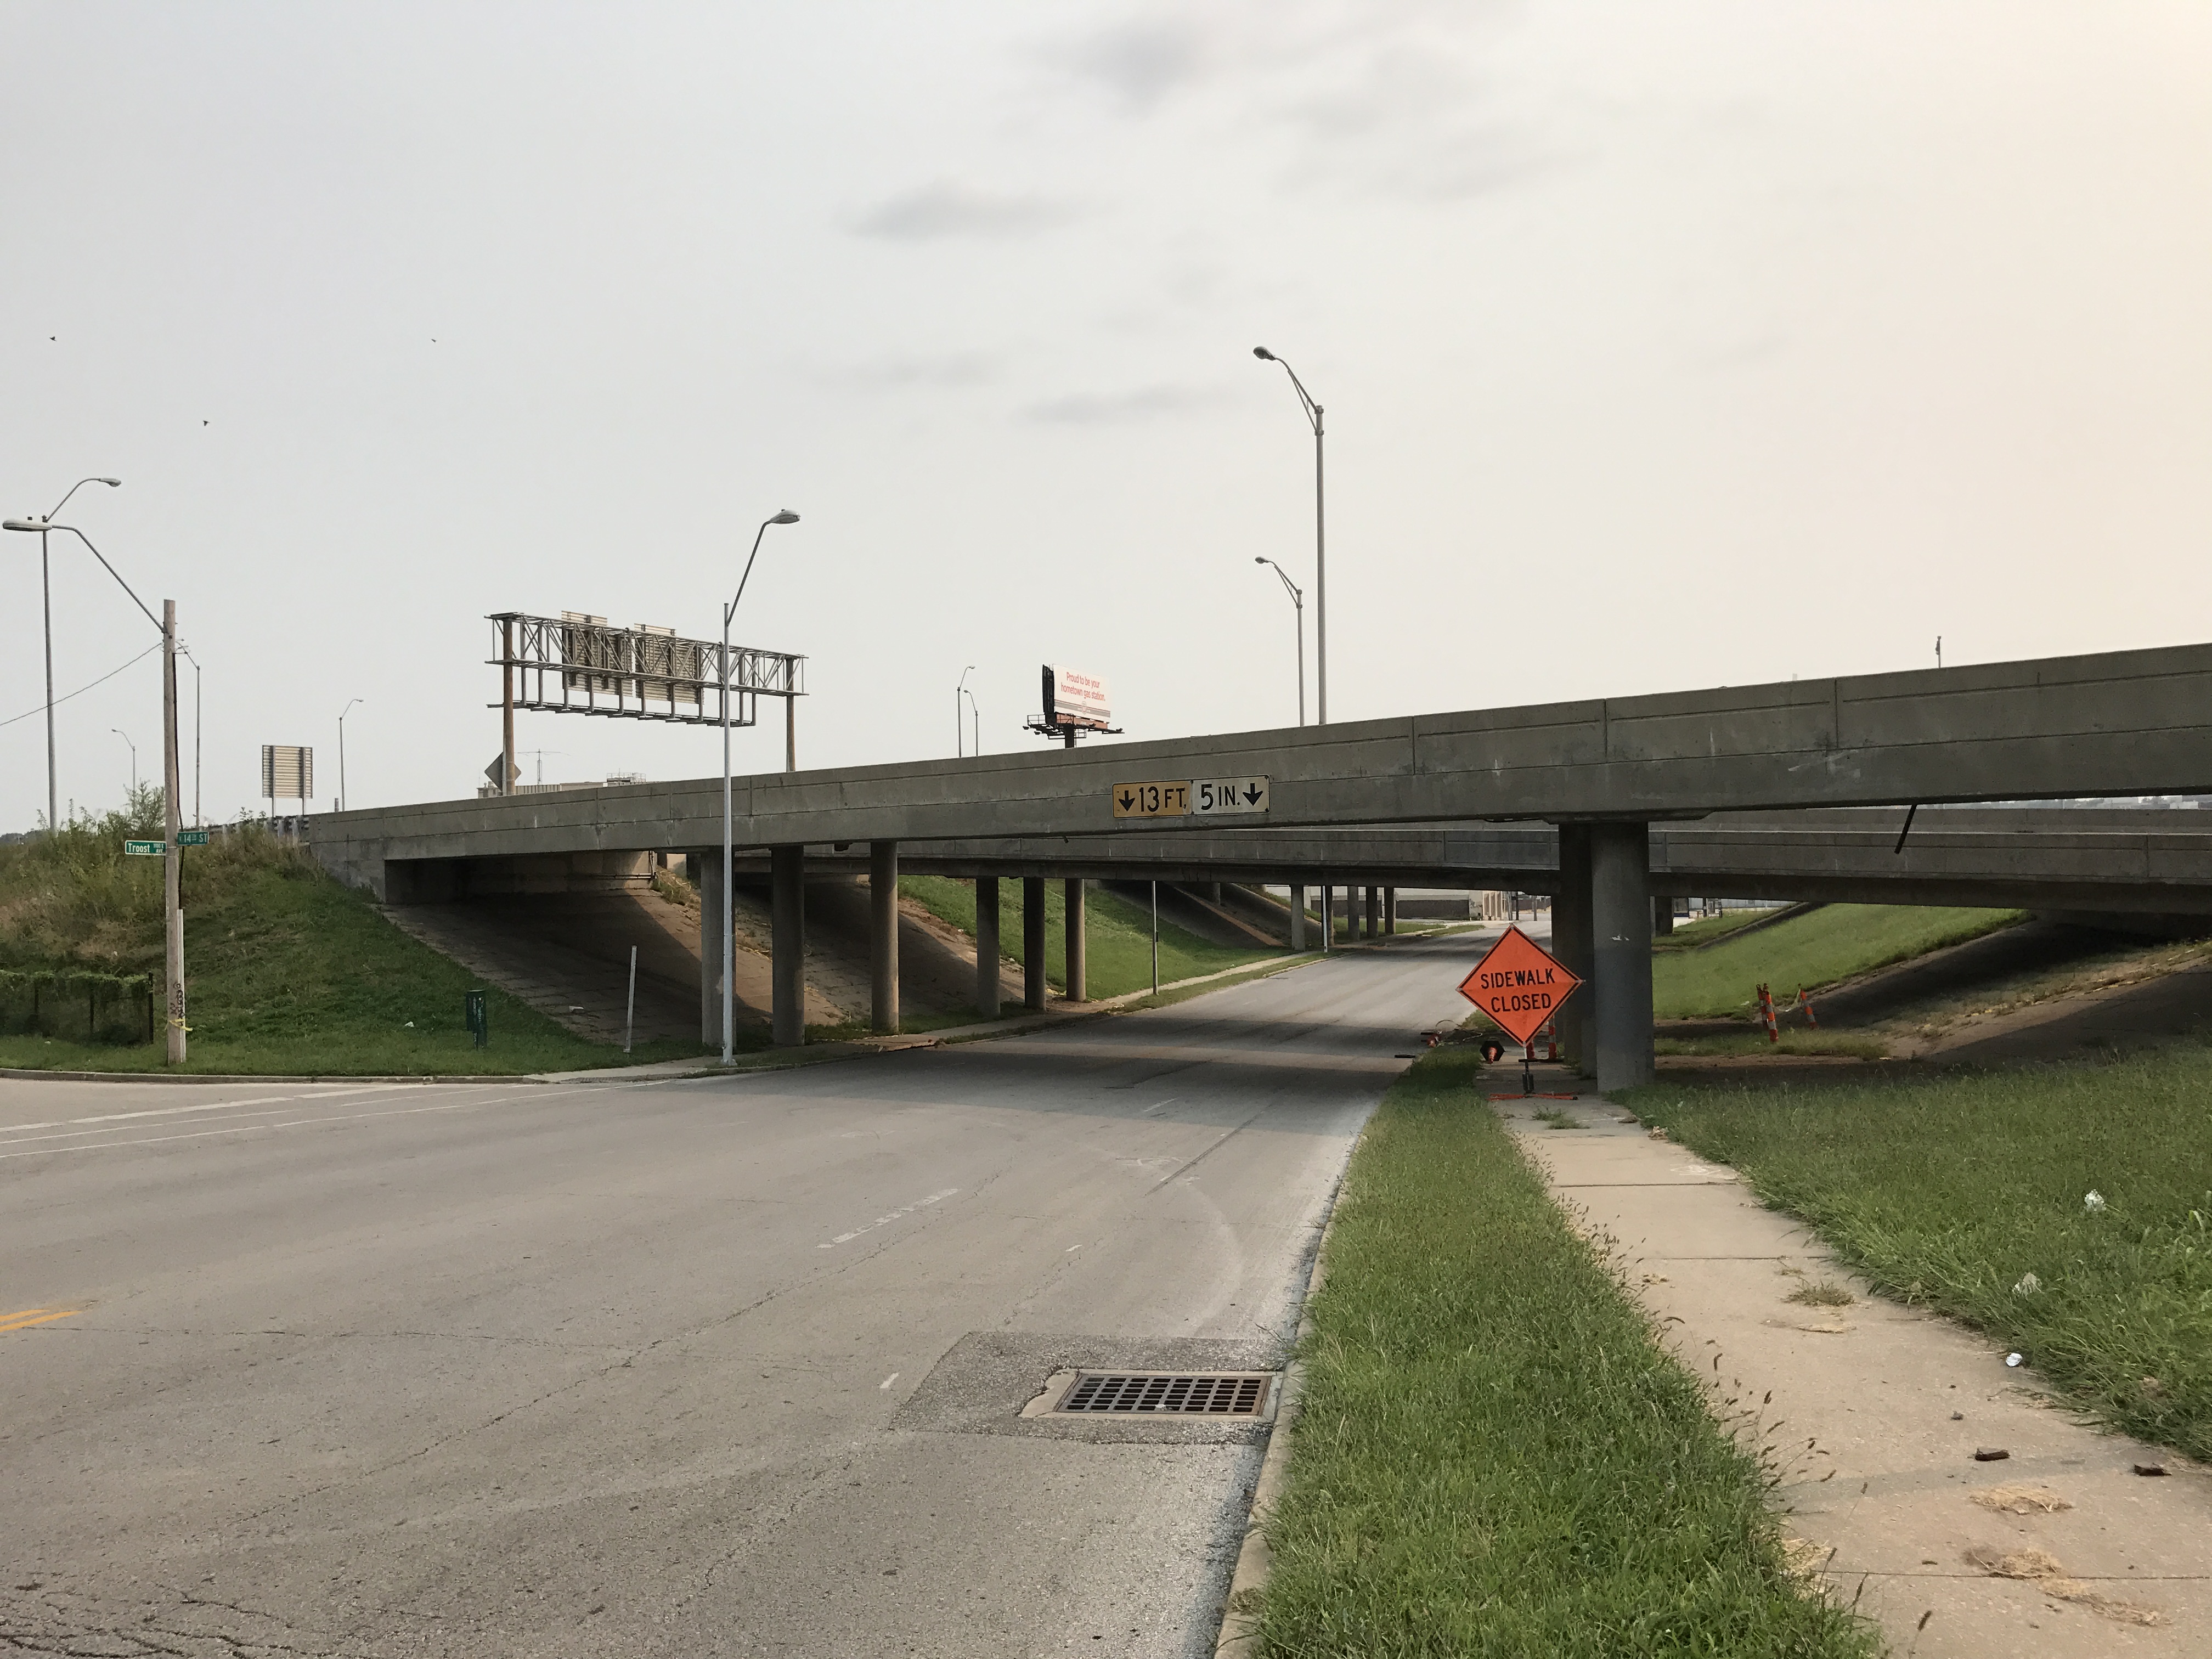
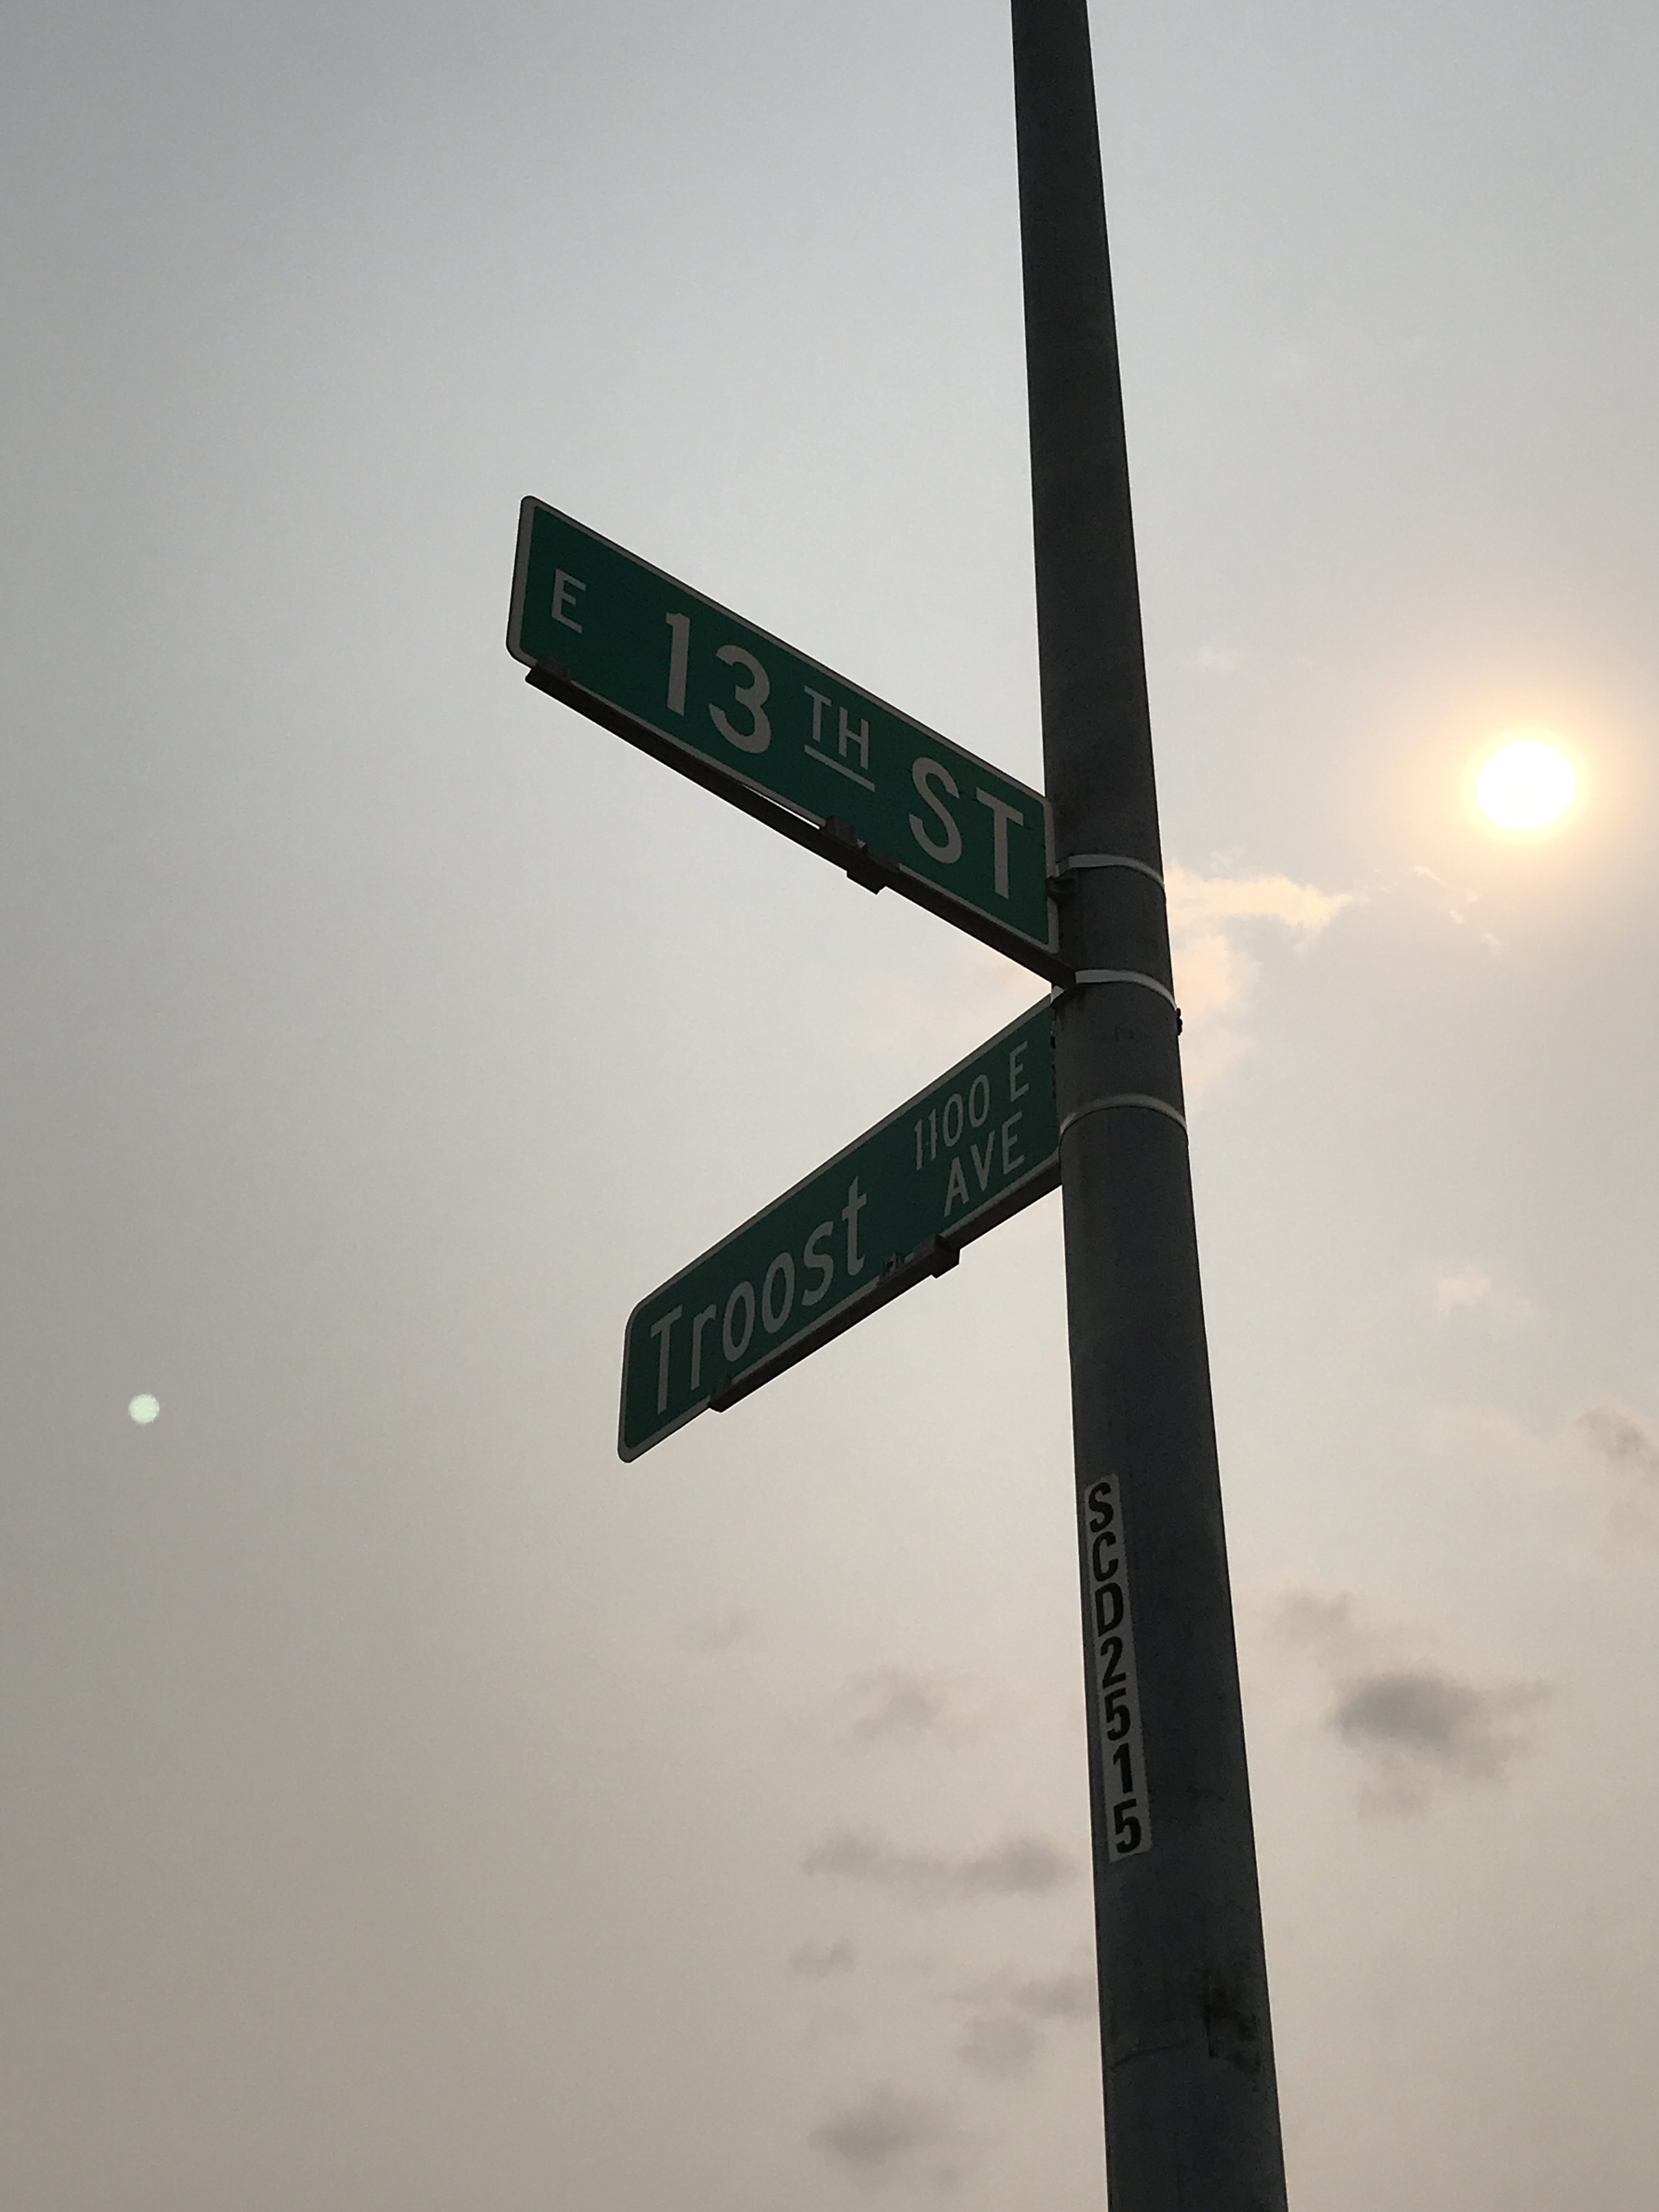
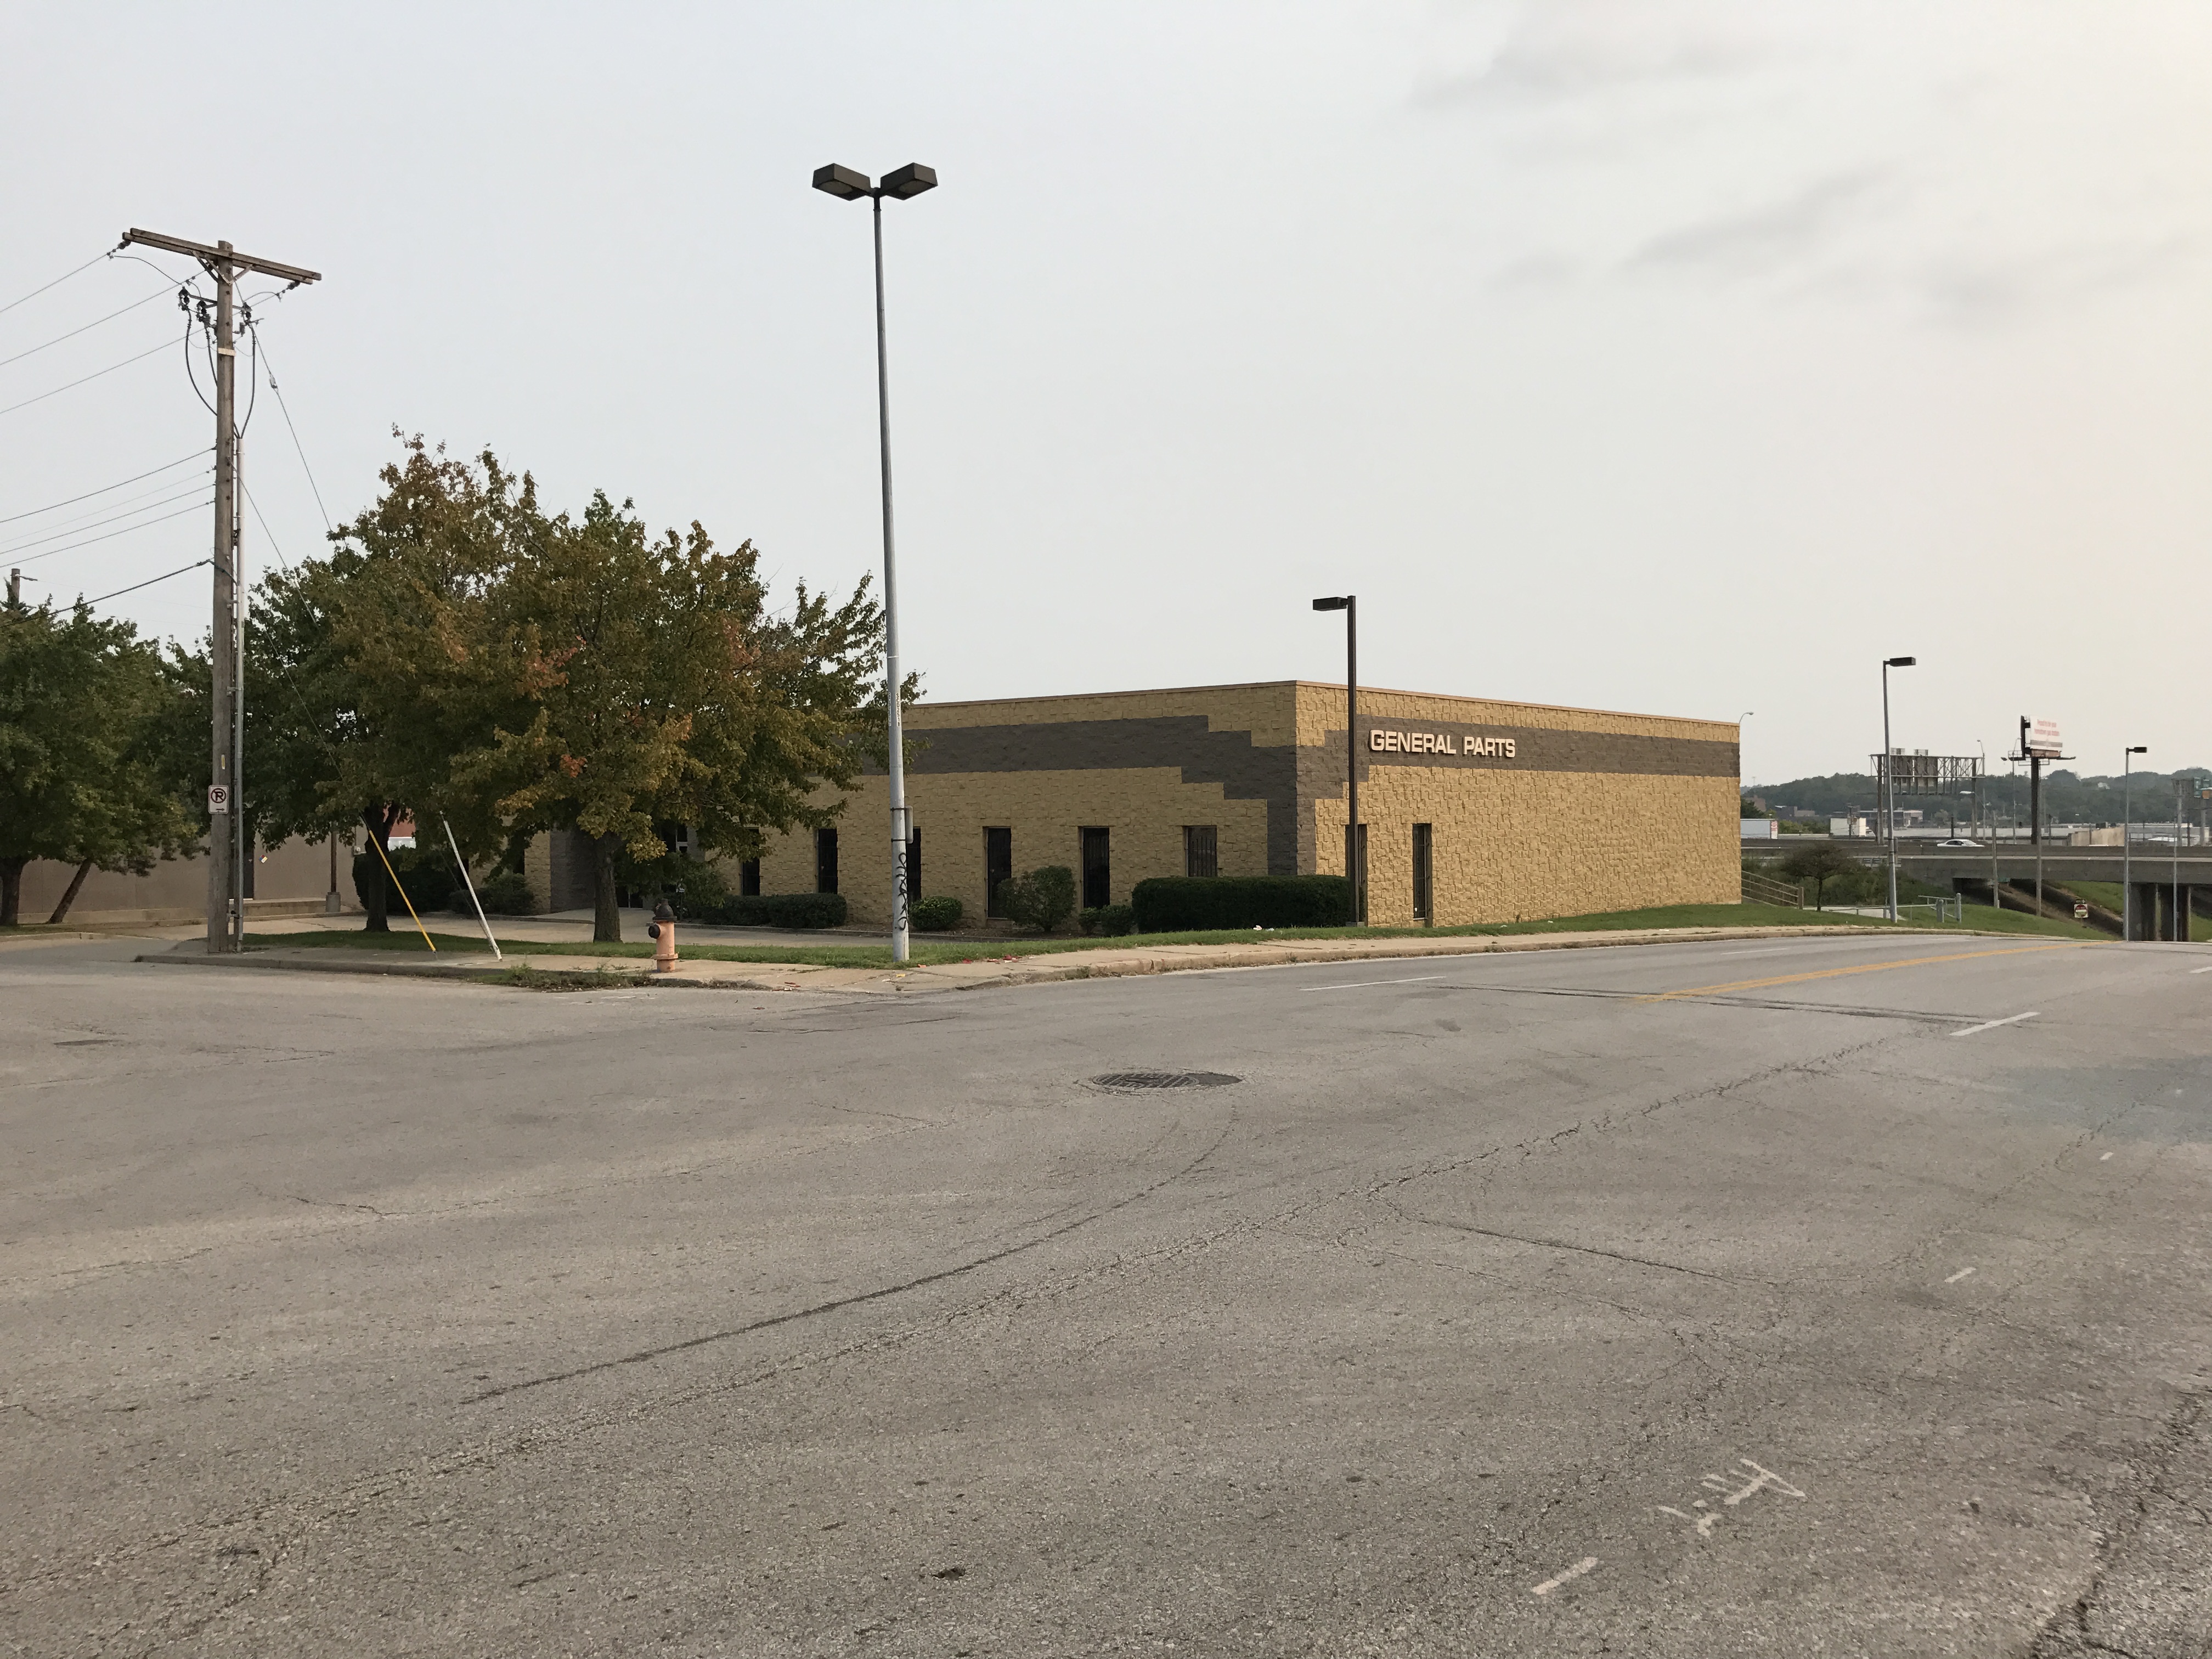
Area Between 72nd Terrace and 75th
I was given the area on Troost between 72nd terrace and 75th street to study. Looking into this area was very interesting and I learned a lot. The thing that I found most surprising while doing my research was just how much the area had been developed in a short amount of time. I included a picture of three figure-ground diagrams to show just how much the area has changed over the course of around ninety years. The figure-ground diagrams only show buildings directly on Troost. The figure-ground diagram on the far left is based on the earliest map I could find of my area. This map came from a 1925 Atlas of Kansas City and as the figure-ground diagram shows, there was only one building on my area of Troost during 1925. The figure-ground diagram in the middle is based on a 1950 Sanborn fire insurance map. This map shows that there was a lot of development on the east side of Troost in 25 years and that Kansas City was expanding. The final figure-ground diagram on the right represents my area currently and is based off observations I made and google maps. This final figure-ground diagram shows that there has been a good amount of development on both sides of Troost. Another interesting thing I found is that some of the buildings still stand from 1950. One of which is “The Firehouse Southside Activity Center” which is currently closed, but the 1950 Sanborn map has the building marked on it as a firehouse. A current picture of the firehouse is also included.
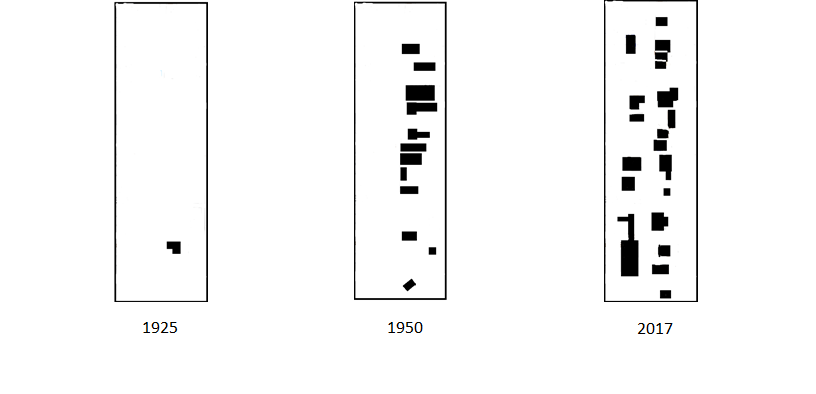
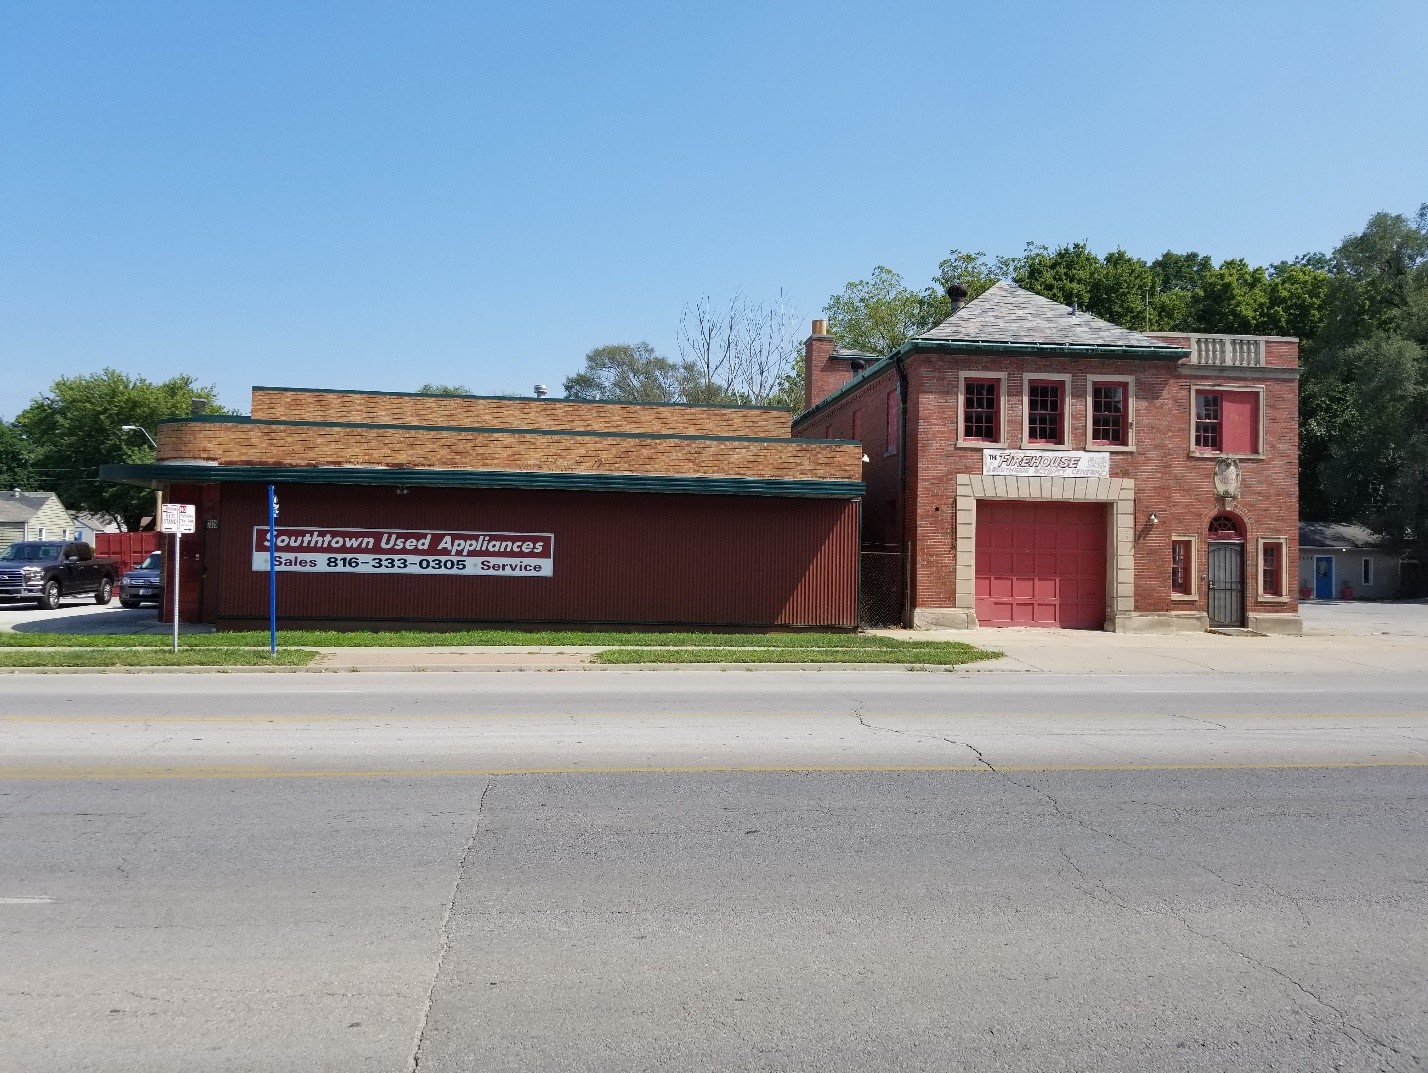
61st and Meyer Blvd

The area I was assigned was 61st and Meyer blvd. The earliest map I could find for it was the 1925 atlas, therefore I drew that nothing was there before, it was more than likely just an empty lot. The street was very narrow and it’s one of the main traits that characterized the area because it made it easily navigable. The biggest alteration was that the number of buildings in the area more than tripled throughout the time
Another Semester, New Researchers
Posts below date from Fall 2016’s UPD 260 class that researched Prospect Avenue. Posts above will document Fall 2017’s UPD 260 class’s research along Troost Avenue.
Swope Parkway to E 50th and Prospect Ave
The census data supports that there has been use of restrictive and deeds planning tools to create racialize space in figures one, two, & three revealing across all three years, covering 60 years total, a progression of physical segregation. Starting with using the 1950 survey as base, because tracts 76 and 77 reveal a population that is a heterogeneous demographic mixture and in 2000 to 2010 primarily a minority homogeneous population with a median income on a average of $10,000 less than in 1950. The 2010 median house values in the tract 76 and 77 sunk on an average of $10,000 less than the 1950 median house values and only matches one third of the $135,000 median house value of Kansas City in 2010. With that in comparison, the median house values of tracts 76 and 77 in 1950 averaged out to $69,307 about $8,000 above the 1950 median house value for Kansas City. In conclusion, tracts 76 and 77 seem they were subjected to the use of planning tools that create racialized space because if they weren’t the population should reflect diverse demographics and the rise of property values near the median of the entirety of Kansas City’s house value using the1950 census data as a base standard when residential segregation was not at its peak yet. (Gotham, 2002)
-Stephen Pociluyko
11th St -13th St and Prospect
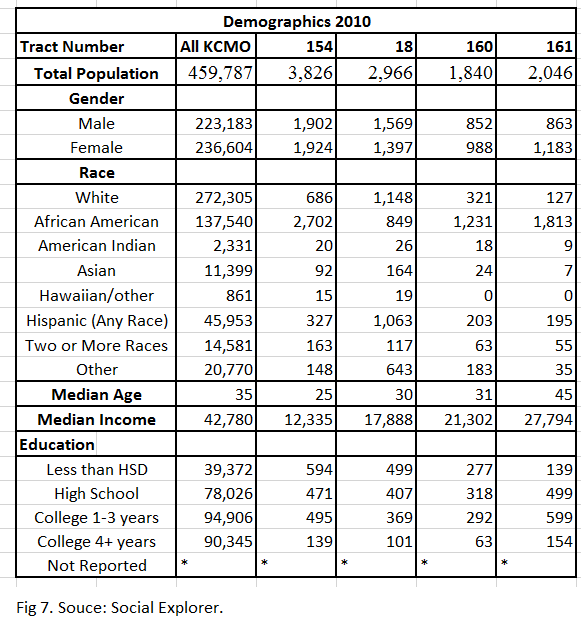
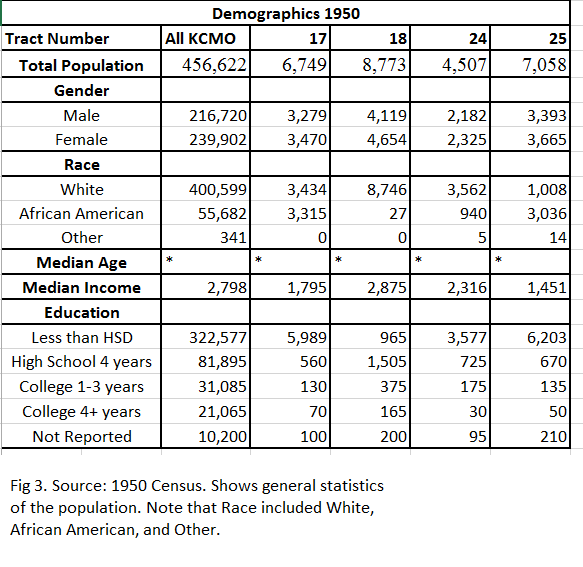
Overall, my area typically had a lower income, lower housing values, higher housing vacancy, and lower levels of education than Kansas City. The income gap between greater KC and my area widened throughout the years. By 2010, one of my tracts had a median income of less than $13,000. When the rent increased and the incomes decreased, I noticed higher levels of housing vacancy. I noticed an increase in education over the years, though it still remained less than in KC. The population shifted in my tracts from being more even with race to being mostly African American in most areas. My tract numbers changed, so the four tracts listed in each table represent roughly the same areas.
Census Analysis from Truman Rd. to 18th Street along Prospect Avenue
The Census data that I found for this area ,prominently showed growth through the years of 1950 , 2000 and 2010. When I compared the census data from 2010 for this area to that of the entire Kansas City metro in 2010 the rates where lower for the Prospect area . Rates of home owner occupation,housing value ,and income were much lower in the Prospect area . The racial make up of the census tracts from Truman road to 18th street along Prospect changed throughout the three years . In 1950 ,the number of White and Black residents was almost even. By 2000 the majority of residents ethnicity had shifted to prominently Black with very few Whites. In 2010, Black residents were still the majority of the population in the Prospect area. Compared to the over all Kansas City population in 2010 the tracts for this area in 2010 had a much larger number of Black residents .The census data for Prospect avenue from Truman road to 18th street shows that this area lowered in value and changed in racial demographics compared to that of the entire Kansas City metro in 2010 .
Information for two blocks North of Independence Ave and on either side of Prospect
The two blocks I have been studying are North of Independence Ave and on either side of prospect. Digging up data has shown various trends for the area and Kansas City in general. The two graphs shown show how the rent and house prices have steadily gone up in a similar way over the years.
Other data, not necessarily correlating to the graphs, shows how the white population for the census block that my two blocks are located in, has diminished over the years. In 1950, the population was completely white. In 2000, the white population only made up 38.1%. City wide, in 1950 the white population was 87.4%, and in 2000, the citywide white population was 62.5%. It’s interesting to notice how the particular area my blocks are in has grown substantially more multicultural than the city overall.