All posts by Antonio Panetta

Census Report of Area Between 72nd Street and 75th Terrace

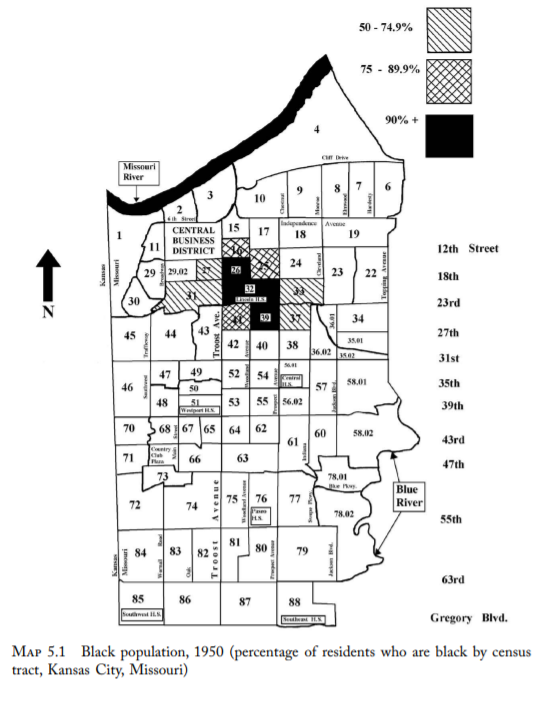
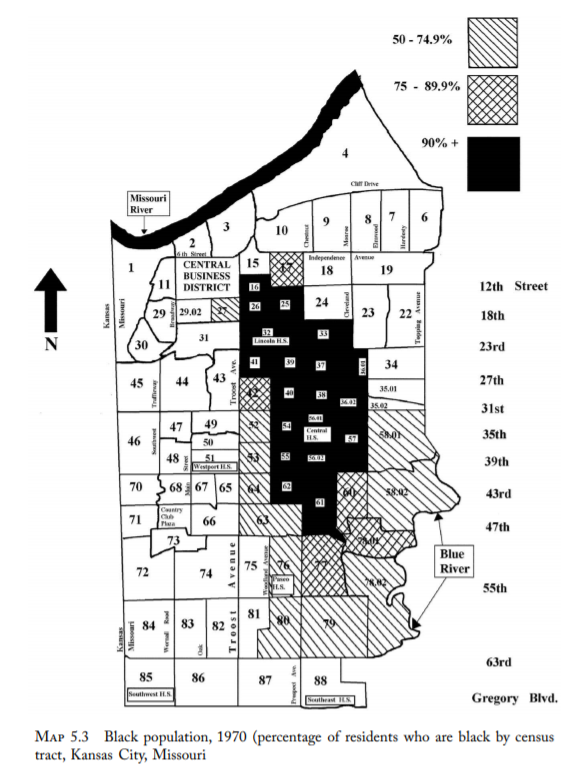
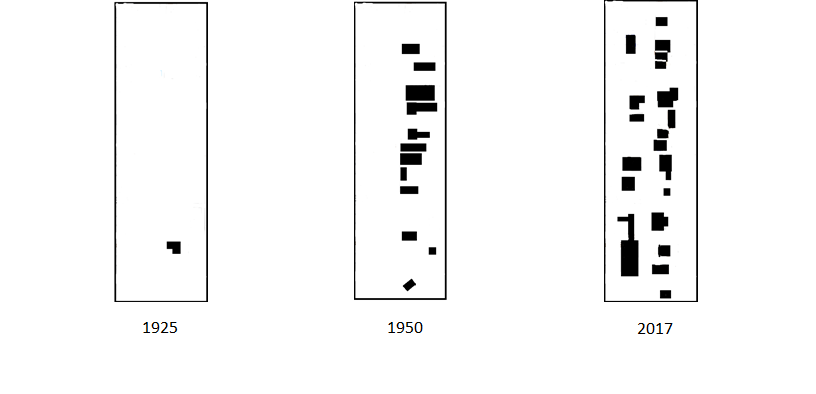
For my census project I was tasked at exploring the different demographic variables for the areas between 72nd street and 75th terrace. To do this I looked at census tracts 90 and 91 for Jackson County in Kansas City for the years 1950, 2000, and 2010. Census tract 91 shows information for blocks west of Troost Avenue and 90 represents areas east of Troost. Upon exploring information from the US Census Bureau and American Community Survey, I found some very interesting information. The most interesting thing that I found was the segregation of the African American population east of Troost and how it could not really be seen in 1950 for my area, but was very visible by 2000. The first picture shown in this post shows that segregation of the African American population was happening in Kansas City by 1950, but that it had not quite reached 72nd street yet. The second picture shows Kansas City in 1970 and how segregation had expanded. Although not yet to 72nd street, these two pictures show how racial division was following Troost and expanding rapidly. By 2000 segregation would have reached my census tracts. In fact in 2000, census tract 90 was around 88% African American and around 8% white, while census tract 91 was almost 77% white and only around 19% African American (United States Census Bureau (2000). Social Explorer, Jackson County Missouri Census Tract 90 & 91. Retrieved From https://www.socialexplorer.com/tables/C2000/R11508552). I thought it was very interesting to learn when segregation became present in my area and the other demographic variables that were affected by segregation.

Source: Gotham, K. F. (2014). Race, Real Estate, and Uneven Development : the Kansas City Experience, 1900–2010. Retrieved from http://ebookcentral.proquest.com
Gotham, K. F. (2014). Race, Real Estate, and Uneven Development : the Kansas City Experience, 1900–2010. Retrieved from http://ebookcentral.proquest.com

Area Between 72nd Terrace and 75th

I was given the area on Troost between 72nd terrace and 75th street to study. Looking into this area was very interesting and I learned a lot. The thing that I found most surprising while doing my research was just how much the area had been developed in a short amount of time. I included a picture of three figure-ground diagrams to show just how much the area has changed over the course of around ninety years. The figure-ground diagrams only show buildings directly on Troost. The figure-ground diagram on the far left is based on the earliest map I could find of my area. This map came from a 1925 Atlas of Kansas City and as the figure-ground diagram shows, there was only one building on my area of Troost during 1925. The figure-ground diagram in the middle is based on a 1950 Sanborn fire insurance map. This map shows that there was a lot of development on the east side of Troost in 25 years and that Kansas City was expanding. The final figure-ground diagram on the right represents my area currently and is based off observations I made and google maps. This final figure-ground diagram shows that there has been a good amount of development on both sides of Troost. Another interesting thing I found is that some of the buildings still stand from 1950. One of which is “The Firehouse Southside Activity Center” which is currently closed, but the 1950 Sanborn map has the building marked on it as a firehouse. A current picture of the firehouse is also included.