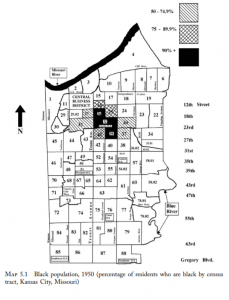
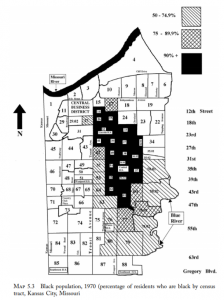
For my census project I was tasked at exploring the different demographic variables for the areas between 72nd street and 75th terrace. To do this I looked at census tracts 90 and 91 for Jackson County in Kansas City for the years 1950, 2000, and 2010. Census tract 91 shows information for blocks west of Troost Avenue and 90 represents areas east of Troost. Upon exploring information from the US Census Bureau and American Community Survey, I found some very interesting information. The most interesting thing that I found was the segregation of the African American population east of Troost and how it could not really be seen in 1950 for my area, but was very visible by 2000. The first picture shown in this post shows that segregation of the African American population was happening in Kansas City by 1950, but that it had not quite reached 72nd street yet. The second picture shows Kansas City in 1970 and how segregation had expanded. Although not yet to 72nd street, these two pictures show how racial division was following Troost and expanding rapidly. By 2000 segregation would have reached my census tracts. In fact in 2000, census tract 90 was around 88% African American and around 8% white, while census tract 91 was almost 77% white and only around 19% African American (United States Census Bureau (2000). Social Explorer, Jackson County Missouri Census Tract 90 & 91. Retrieved From https://www.socialexplorer.com/tables/C2000/R11508552). I thought it was very interesting to learn when segregation became present in my area and the other demographic variables that were affected by segregation.

