Kansas City’s census tract 54, which encompasses 31st to 35th, from Woodland to Prospect, has delineated the same boundaries from 1950 to the present. The demographic transformations of this area, however, have been far from consistent. To illustrate, in 1950, Kansas City’s urban core had experienced considerably higher population density than the present. According to figure 1, the 1950 Census recorded a total population of 5,397 (U.S. Census Bureau, 1950). Within the tract’s area of .25 square miles, this equals a population density of 22095.99 per square mile. Likewise, the racial makeup of the tract bears no resemblance to its present state. Tract 54 saw a 99.6% white population to a .4% black population (U.S. Census Bureau, 1950). Additionally, the 1,880 housing units in 1950 was far higher than ensuing decades.
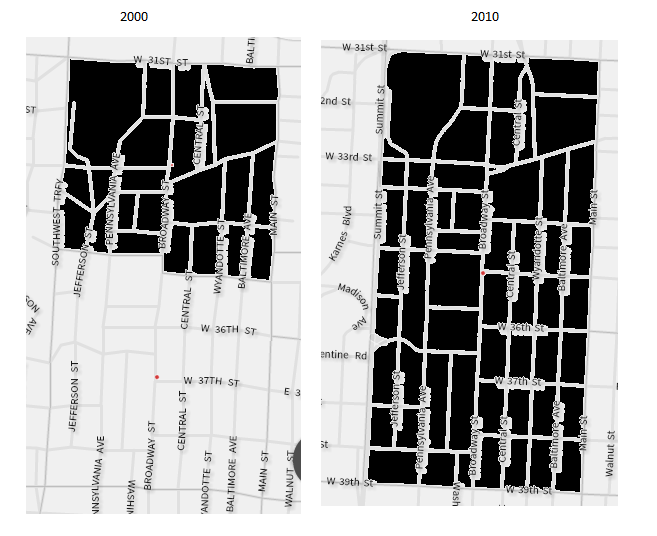
When cross-referencing the 1950 census with data from 2000, the social, cultural, and political contexts readily offer perspective to the demographic shifts. For example, from 1950 to 2000, tract 54 saw total population fall to 1,230 (U.S. Census Bureau, 2000). In perspective, this reflects a drop in population density by around 23%. Seen in figure 2, the racial breakdown of the tract inverted to 95.4% black to 3.2% white (U.S. Census Bureau, 2000). From the mid-nineteenth century to the change of the millennium, the tract saw a mass exodus of the white population, along with a significant quotient of density.
Data displaying educational attainment further reflects the racial and socioeconomic rifts between those who fled to the suburbs and those who settled in tract 54. As shown in figure 2, over 41% of the overwhelmingly black population has not completed high school or equivalency (U.S. Census Bureau, 2000). Disinvestment in public resources, perhaps a function of the hemorrhaged Jackson County tax base (among many other factors) to surrounding suburban communities, has contributed to the difficulties of the area.
The 2010 census data again shows a decline in the tract’s population and density. As seen in figure 3, the total population has fallen to 903 with a population density of 3,622 per square mile (U.S. Census Bureau, 2010). Additionally, the number of housing vacancies has risen to 230, against the available 588 housing units (U.S. Census Bureau, 2010). Compared with the 2000 census, more whites and individuals self-identified as “other” or “two-or-more-races” occupy the tract.
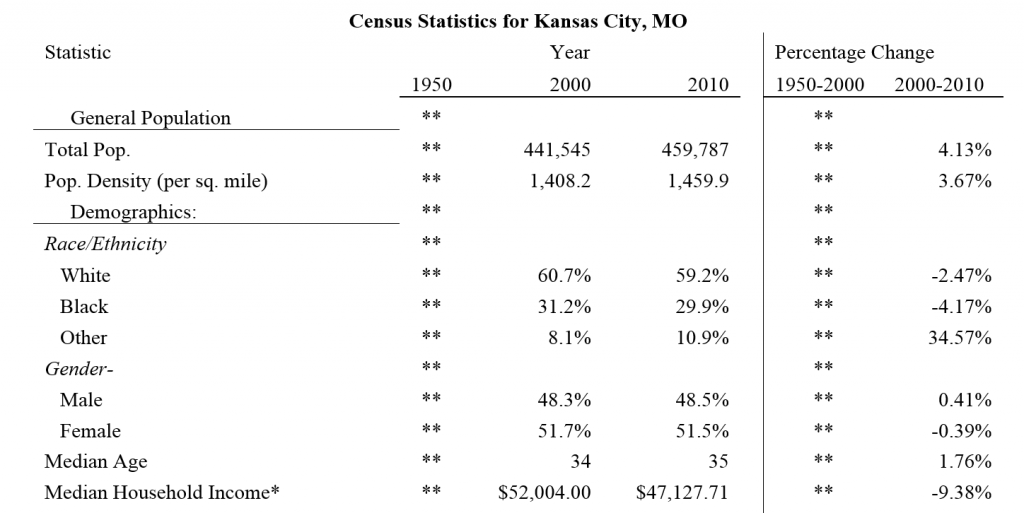
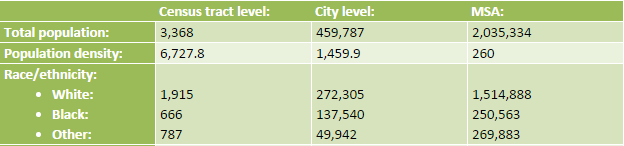
Conversely, the inner city census tract stands in stark contrast to the Metropolitan Statistical Area. The suburban sprawl of the metro brings the total population density down to 260 per square mile. Thus, the population density of the urban tract is over 14 times denser than the MSA in aggregate. Seen in figure 4, the MSA shows a 78.5% white to 12.5% black ratio (U.S. Census Bureau, 2010). The concentration of the black community in the urban core is shocking when compared to the MSA as a whole. Also, with a median household income of over $50,000 per year, the MSA is over twice the income of the urban tract. Lastly, the MSA shows over 20% of the populating holding bachelor’s degrees, compared with the 0% of tract 54 from the 2010 census. Hence, the data show that the urban tract is denser, poorer, less educated, and more intensely racially segregated when compared to the MSA in aggregate.
2010 Census
Monthly Archives: November 2015
paseo and wayne
One of the really unique and interesting things about the look and setting of this area is that it is almost entirely dominated by large apartment buildings, such as apartment complexes or high-rise apartments. Since 2010, 64 % of people pay rent. Not much has changed since the 1950s with many of the original buildings have been used as hotels and not individually owned. It has always been a low rent area with the monthly rent since 2010 being $565.00. Many of the residences in this area are relatively historic, built no later than 1939, and in some cases, quite a bit earlier.
Linwood Blvd: Elmwood Ave to Chelsea Ave
Over the 60 year span this two block stretch remained within census tract 58.01. Originally an 80% white middle class neighborhood, it is now a 90% black neighborhood that has seen consistent drops in the real median household income as well as population.

These, aside from real median household income, are opposite of the trends that the broader Kansas City and Metro statistical areas were following.
That being said, even though both areas have seen a decline in real median household income the income of census tract 58.01 is less than half that of the greater Kansas City area.
*All currency statistics have been adjusted for inflation to a base year of 2013
Linwood Benton BLVD to Benton BLVD
My census tract of study was number 56. It is situated to the East of Prospect AVE. The blocks over the last 100 years have changed dramatically. While gathering census population information, I noticed the huge difference in population from 1950 to 2000. With events such as they great migration of WWI and WWII, foolish acts of planned segregation occured. My particual census tract went from a population of 8,600 people to 1,800. This is drop in people and hurts the neighborhoods of the eastside. With little population now, it is difficult to build a tax base for essential things such as basic infrastructure. Sidewalks were cracked and dangerous to walk on. Housing was abandoned and ready to be torn down. I would assume we all experienced a similar situation in our research.
The tract that I was assigned to find the census reports was 56.01. On this tract it included my blocks: S Benton Avenue to Montgall Avenue. For the census of 1950 the tract 56.01, it included more than 90% of white people, and 50 years later these numbers decreased and only had about 5% of white people. This occured because the white people moved out to the suburbs, and the African Americans moved into houses that were affordable for them. For the census of the year 2000 African Americans were around 90% of the population. Ten years later it has not changed much. The only difference is that the number of vacant houses grew, so the population density decreased.
Tracts 47 and 167
The tract encompassing the stretch of Linwood Boulevard from Main Street to Wyandotte Street has undergone many changes over time. Census Tract 47 contained these streets in 1950 and 2000. The tract was bordered by 31st St to the north, 35th St and Armor Blvd to the south, Summit St and Southwest Trfy to the west, and Main St to east. In 2010, however, the tracts were redrawn, and Tract 47 combined with Tract 48 to the south, creating the new Tract 167. The southern border of the new tract stretched to 39th St. This was the most dramatic change that the census tracts underwent during the time, and it makes before and after comparisons difficult. The population almost tripled, and the demographic balance changed dramatically. The white population was 15% more of the population than before the redistricting, and the percentage of Hispanic/Latino population took a 18% dive. However, despite all this, there were actually more people of color after the redistricting before- the white population just tripled.
Chelsea Avenue
I chose to work on census tract 58.01 and my block is at Chelsea avenue between E 31st street and Linwood Blvd. This section of town has become a predominantly black neighborhood in a 50 year span. While analyzing the data from the 1950 census tract I also noticed that it was a period of growth among the white people that lived in this area and employment was at its highest, which is no longer the case.
Race in Census Tract 47
When reviewing Census records from 1950, 2000, and 2010, the population difference by race in census tract 47 – which contains the blocks from Jefferson Street to Broadway Boulevard along West 33rd Street – begins with a dramatic imbalance and displays the unevenness in Kansas City’s racial composition as the years go by.
In 1950, census tract 47 was a predominantly white area with 4,970 white residents and only 63 African-American residents. When viewing the numbers city-wide, Kansas City had 400,599 white residents within its city limits compared to only 55,682 African-American residents. To put these numbers into perspective, Kansas City in 1950 had over eighty percent of its population comprised of white residents.
In 2000, the great population divide between white residents and African-American residents at the census tract and city level is less drastic than in 1950. In census tract 47, there are 500 white residents and 202 African-American residents. At the city-wide level, Kansas City housed 254,471 white residents and 136,921 African-American residents. No longer are white residents eighty percent of the city’s population, but this data still displays a lack of evenness in racial composition.
In 2010, the population numbers of white and African-American residents remain unequal. At the census tract level, white residents held 1,915 spots in the population and African-Americans totaled 666 residents. City-wide, white population exceeded African-American population by over 100,000 people. However, the most sobering racial population numbers come from the metropolitan statistical area data. As can be seen in the data table below, at the MSA level, African-Americans were outnumbered by whites by over a million people – precisely 1,514,888 white residents and 250,563 African-American residents.
 2010: Population and racial composition numbers compiled from Census data
Census Data Analysis: Linwood Boulevard in Tract 54
Census tract 54 includes the stretch of Linwood Boulevard from Park Ave to Wabash Ave. It’s bordered to the north by 31st Street, to the south by 35th Street, to the west by Woodland Avenue, and to the east by Prospect Avenue. In 1950, it was populated by residents living in both single family and multi-family dwellings. Public buildings included stately churches, apartments, and the Ivanhoe Masonic Temple, among others. Looking at Figure 1 below, you can see that this small pocket of Kansas City was a densely populated community at 22,096 people per square mile.
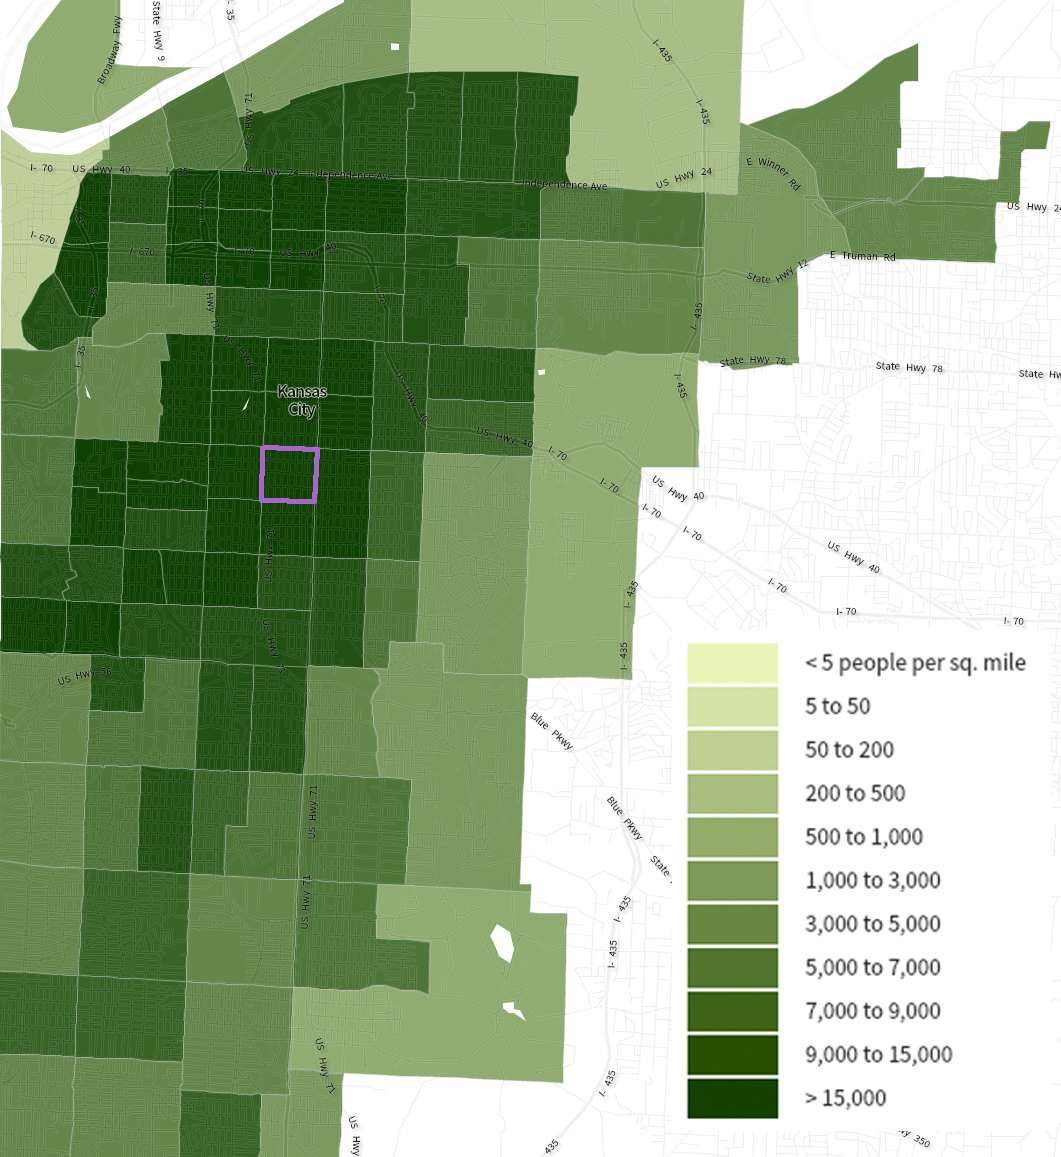
The above map gives us an idea of population density, but U.S. Census Bureau statistics provide more detailed data on the people inhabiting this tract. In 1950, it had 5,397 residents and was about 1% of the city as a whole. When we look at variations over the course of sixty years, there is a consistent downward trend in census tract 54’s population. The 2010 census revealed a population at only 17% of its 1950 level. In contrast there has been little change in the entire city population: the 2010 count stands at 99% of its 1950 level. See Figure 2, below:
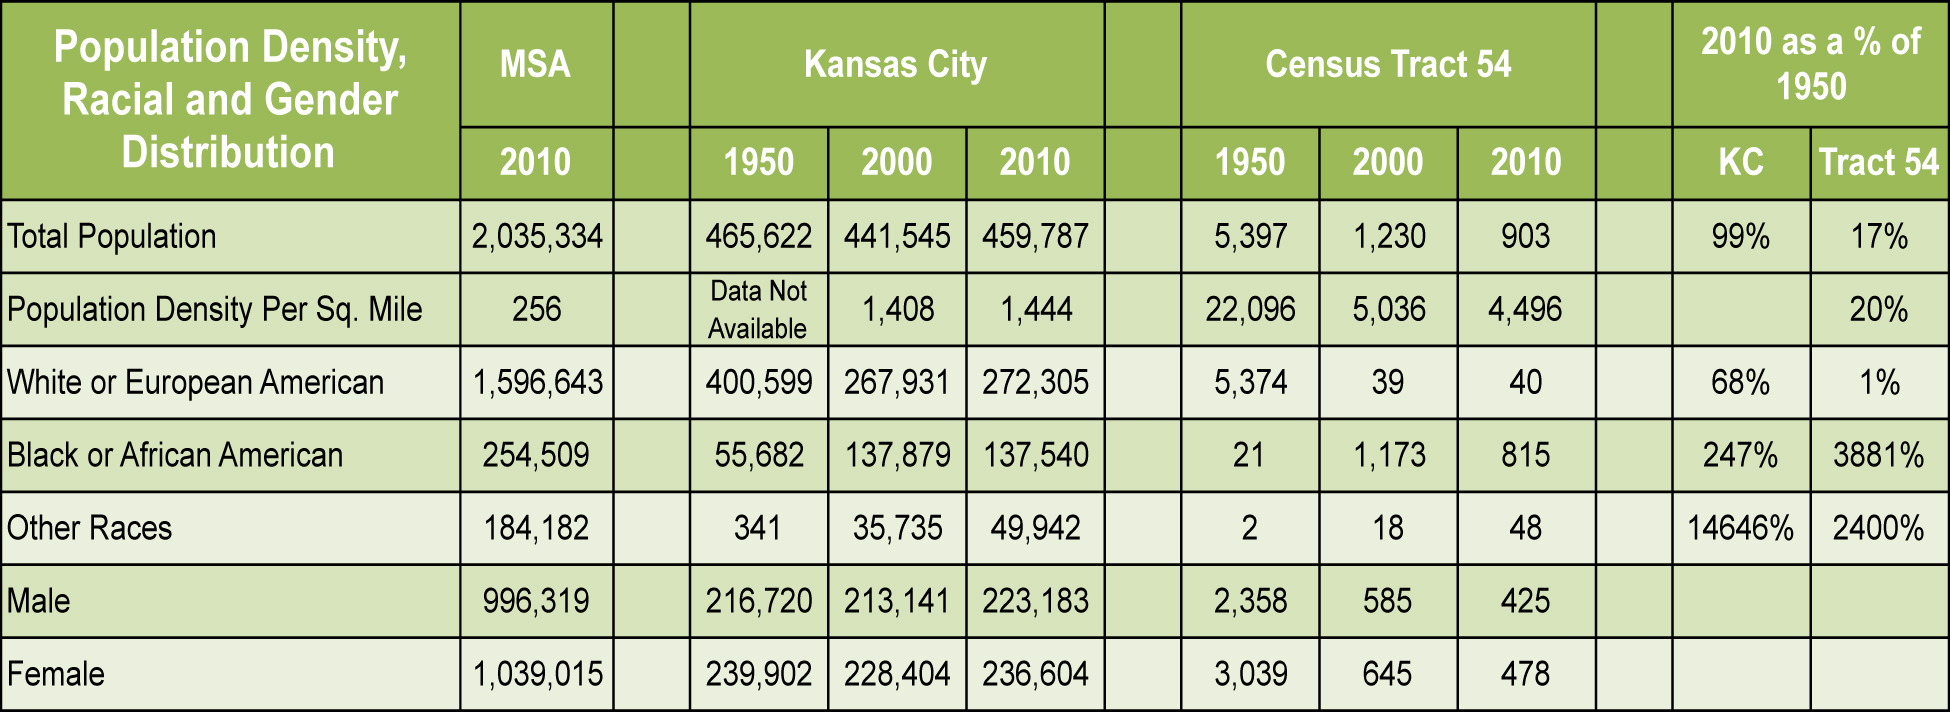
As Figure 2 shows, census tract 54 was racially homogeneous in 1950, with 99% of the population identifying as white and less than 1% black. This trend of a white majority and a black minority is completely reversed by 2010, with the white population reduced to 1% of its 1950 level and the black population increased almost forty-fold of its 1950 level.
Since the entire city’s white population in 2010 is 68% of its 1950 level, and in the metropolitan statistical area whites outnumber blacks more than 6 to 1, we can conclude that the changes in census tract 54 are not aligned with the shift in the racial makeup of Kansas City as a whole or the surrounding MSA. With such a sharp turnaround in both population and racial makeup, we must look at historical events to gain insight into what led to these changes.
Racist housing policies began to take shape prior to the 1950’s with the use of block busting, threats of violence toward blacks, developers and community builders constructing suburban subdivisions with racially restrictive covenants, and redlining. Race relations in Kansas City were tumultuous in the 1960’s and continued to be tense throughout the rest of the twentieth century.
A second factor that may have contributed to the decline of neighborhoods and thus the population was the 1968 riots following the death of Dr. Martin Luther King. Portions of Prospect Avenue, which runs along the eastern border of census tract 54, suffered property damage during the riots. This led to deteriorated homes and businesses that have never recovered.
The controversy surrounding the new “Southern Midtown Freeway” was a third factor that affected tract 54. The SMF project threatened to displace thousands of residents and businesses. It was eventually built as a smaller, parkway-style system that we know in its current form as Highway 71 / Bruce R. Watkins Drive. Highway 71 cuts directly through tract 54.
Broadway to Wyandotte
In comparing the data for the tract/s to the data found for Kansas City, Missouri as a whole, I feel that the year 2000 had the most significant differences. First, the data shows that the population density per square mile is much lower for the entirety of Kansas City compared to tracts 47 and 48. The proximity of tracts 47 and 48 to the urban center is important in this comparison, as it can be noted that they are in a very central location. Second, the average household income appears to be notably higher for the whole city than the two noted tracts, with about $32,000 averaged between the tracts and $49,194 for Kansas City. And third, the percentage of renter-occupied housing for the whole of Kansas City is about half, comparatively, of that found in tracts 47 and 48.
From this collective data, I believe it can be rationally determined that suburbanization has had a strong impact on Kansas City and its urban core. From studying tracts in a centralized location and comparing them to the much larger city, we can clearly see the effects of urban sprawl.
Big Changes in Tract #57
The aspect of the area of tract 57 (containing the Linwood blocks from Cleveland Avenue to Indiana Avenue) that shows the most change is the race/ethnicity range. In 1950, according to the U.S. Census, the area was entirely an all-white community. There were no reported non-white persons. Of the white persons, 134 were foreign-born, but all from predominately white countries. This reflected the city-wide statistics, though a bit more to the extreme side. In the overall Kansas City Census, the total number of white persons was 400,599, while only 56,023 non-white persons were reported. Fifty years later, the total population of Kansas City showed 267,931 white persons, 137,879 black or African American persons, and 10,780 persons of other races. The 2010 census reflected similar numbers.
In tract 57, however, the most drastic change is shown in regards to the white and nonwhite populations. As previously stated, the area in 1950 was completely white, with absolutely nonwhite persons living in the area. In just 50 years, the whole area switched from entirely white to predominately Black and African American. By 2000, there were only 35 white persons living in the area, and over 2,500 nonwhite persons in the tract.
As I’ve shown in the graph below, this change continued into 2010, with no white persons reported to be living in the tract. Around 98% of inhabitants were reported as Black or African American, and 42 persons (less than 2%) were reported as other races.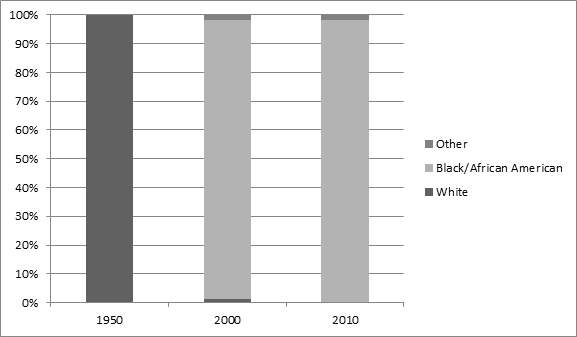
Kensington Ave to Elmwood Ave Demographic and Income Change
I found Social Explorer very interesting in how it compiled data over the years. I was especially interested in how my census tract has changed over the course of 60 years. What used to be a mostly all white middle class suburb of Kansas City, Missouri evolved into a mostly all African American community who are struggling to make it financially. In 1950, most families lived on $3,500 income in this census tract. Most, if not all were white, and had middle income jobs. The rest were the working class, mostly black, and made half as much as the middle income occupants. In 1950, there were 1200 households which were occupied and most of the occupants had owned their homes. We see a dramatic change in the 2000 census. Most of the population in this census tract were African American. Although the population had gradually declined since the 1950’s, African Americans represented over 90% of the population. However, their incomes did no better and most residents were living in poverty. In 1950, a middle income would equate to $35,000 per household in this census tract. In 2000, the average household income in this census tract was only $17,500, half the value 50 years ago. Economically, things did not go better off for the residents living in this census tract. Home ownership fell and residents relied more on renting month per month. In 2010, the population continued to decline and with that more homes were becoming vacant. Occupied housing fell from 1,040 to 849 in a matter of ten years. Home ownership fell as well from 476 homes to 356 in ten years. Overall, housing continued to decline in this census tract as more residents continued to move out in this area. It seems that it is a continuing trend not only in this census tract but also in the surrounding city.
Interesting how time changes things…
It was interesting to see how time had changed the face of the block, and the dominant race changed over 50 Years. The population density seemed to be at its height in 1950. The census tract had a population of 6,353, giving a population density of 23,435 per square mile. In the following years the residents of the block definitely started to change, and the density decreased majorly. In 2000, the population had fallen to 1,258. I’m assuming there must have been some sort of White Flight because the block went from being 99.3% white and 0.5% black in 1950, to 47.4% white and 41.2% black in 2010 and finally 46.1% black and 43.2% white.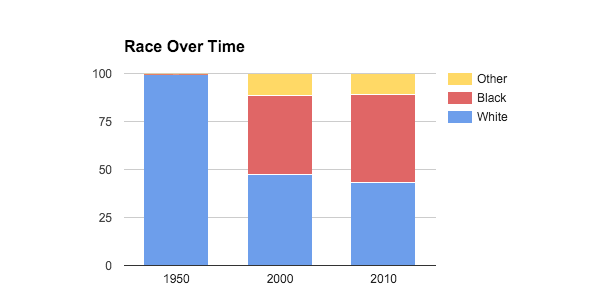
It’s interesting to note that the amount of people who had attained a bachelor’s degree increased from 2000 to 2010, but this didn’t not affect the overall median income, and it actually decreased. The median income in 1950 was $20,653, $35,693 in 2000, and $26,646 in 2010.The value of the houses seemed to change drastically yet the median rent remained more constant. In 1950 the median housing value was $49,121 and rent was $341. Then in 2000 the value increased quite a bit with the house values averaging at $101,416 and rent of $582. Then as the median house value rose to $155,800 in 2010, the average rent actually decreased to $539.
Cleveland to Myrtle Avenue
The racial make up of the avenue changed dramatically in the area, as was probably the case for most of the block groups. In 1950, 100% of my block group was white. By 2010, 100% were black. It is a dramatic statement on the intense segregation still affecting Kansas City today.
There was a large increase in vacant housing in the area. There was some in 1950, but I would argue that housing had just not been sold yet. The large number of vacant homes in 2010 are much more than just unsold homes. These are abandoned homes, condemned homes, homes for sale, homes for rent, etc. It still speaks to the issue of decreasing population coupled with an increasing vacant housing stock.
Karnes Blvd to Jefferson St.
The blocks from Karnes Blvd to Jefferson St. were located in two different census tracts. Karnes Blvd to Summit St is located in census tract 46, and Summit St. to Jefferson St. is located in census tract 47 which later changed to 167. The population of this area has greatly decreased from 1950 to 2010, which my be partially due to the building of the Metropolitian Community College at Penn Valley campus. The area remained predominantly white with small increases of blacks and other races throughout the years. Also, blacks and whites reiding in these areas earned a higher median income than whites in Census Tract 46 in 2000.
Population by Race and Gender
| 1950 | Census Tract 46 | Census Tract 47 | Total |
| Total Population | 4,266 | 5,034 | 9,300 |
| Population Density | 6,452.20 | 21,782.32 | 10,422.80 |
| Male | 1,899 | 2,151 | 4,050 |
| Female | 2,367 | 2,883 | 5,250 |
| White Alone | 4,117 | 4,796 | 8,913 |
| Black Alone | 23 | 63 | 86 |
| Other Alone | 1 | 1 | 2 |
| 2000 | Census Tract 46 | Census Tract 47 | Total |
| Total Population | 2,645 | 1,071 | 3,536 |
| Population Density | 3,728.3 | 4,634.3 | 3,963.0 |
| Male | 1,280 | 630 | 1,910 |
| Female | 1,185 | 441 | 1,626 |
| White Alone | 1,912 | 618 | 2,530 |
| Black Alone | 212 | 210 | 422 |
| Other Alone | 254 | 141 | 395 |
| 2010 | Census Tract 46 | Census Tract 167 | Total |
| Total Population | 2,501 | 3,368 | 5,869 |
| Population Density | 3,779.7 | 6,727.8 | 5,049.5 |
| Male | 1,267 | 2,008 | 3,275 |
| Female | 1,234 | 1,360 | 2,594 |
| White Alone | 1,901 | 2,122 | 4,023 |
| Black Alone | 361 | 682 | 1,043 |
| Other Alone | 119 | 346 | 465 |
*Social Explorer; 1950, 2000, 2010 Census Tracts
Median household income in 1999 Dollars
| 2000 | Census Tract 46 | Census Tract 47 | Total |
| All Households | $33,500 | $20,701 | $29,134 |
| White Alone Household | $31,867 | $21,836 | $29,368 |
| Black Alone Household | $56,094 | $11,912 | $15,797 |
| Other Alone Household | $50,781 | $20,729 | $34,111 |
*Social Explorer, 2000 Census Tract
Michigan Avenue to Garfield Avenue (Tract 54)
In 1950 the total population was 5,397 with a population density of 22,095. Out of those 5,397 people, about 99.574% were white, 0.389% were black, and only 0.037% were other races/ethnicities. Out of all of these people, 43.691%, or 2,358 were male, while 56.309%, or 3,039 were female. Looking at the population as a whole, the median income was $2,641, with majority only attaining a high school diploma. Looking at the population as a whole, the median income was $2,641, with majority only attaining a high school diploma.
In 2000 there was a noticeably large drop in population from 1950, with total population being 1,230 with a density of 5,039.9. Out of the 1,230 people who lived in the area, 1,173 were black, or 95.366%, leaving only 39 white (3.171%) and 7 of other ethnicities (0.005%). Out of the residents, 585 (47.561%) were males averaging about 34 years in age, and 645 (52.439%) were female averaging about 35 in age. This area had 620 housing units, which is a pretty large drop from 1950, but still has a large renter occupation, with 302 being rented out with a $387 median rent, but there are more housing units owned (207).
In 2010 there was a decrease in total population from 2000 with there now being 1,120 with a density of 4,496.4. The majority is still black, with 901 (80.375%), leaving only 220 white (19.625%). There is a slight change in the gender average, with the males growing about 2% from 2000, but still with a fairly even split with 557 males and 564 females. The median income inflated slightly, with it now being $24,464, but the majority still only attained a college degree.
Linwood Census Analysis
There was a lot of interesting information from the different census years. The things that I found most dramatic was the change in racial makeup and the changes in educational attainment.
Over 11,000 white citizens left my area between 1950 and 2000, over 97% of the white population. In 1950, white citizens made up over 98% of the population in the area. In 2010 they were less than 11%.
Overall educational attainment has increased with the greatest increases coming from those who attended college less than 4 years. Although the status doesn’t indicate whether they graduated from a 2-year program or dropped out before obtaining their degree, this trend is very positive for the area. The increase has been over 10% from 1950 to 2010.
W. 33rd St. to Karnes Blvd. Census Analysis
W. 33rd Street to Karnes Boulevard is analyzed through the United States Census Tract 46. This tract extends east to Summit Street and west to State Line Road. The southern border is at 39th Street while the northern border is at 31st street. One substantial statistic to note is that in 1950, 99.5% of the area’s population was white. Only 0.4% of the population was black which showed the extreme segregation in the city at this time. Thankfully, when we hit the year 2010, the numbers have become more acceptable with over 14% of the population being black and 76% white. I believe that the influx of minorities probably happened due to “white flight” in the 1950s and 1960s.
Flora to Highland
One thing struck me more than anything else during this project.
In 1950, the US census recorded one person in all of tract 52 was neither white or black. One single person was different from anyone else in the area. 99.25% of his or her neighbors were white, another 0.73% of people were black, and there is one Other. What this project has taught me that these aren’t just numbers on a website or maps in a library, they’re people and places, these blocks have stories. So much of Urban Planning seems to be about the big picture, but it’s important to be reminded of the importance of one: one block in one year to one person whose name I’ll never know.
Tracy to Flora (KCMO), Tract 52
Tract 52, as identified by the United States Census Bureau, in Kansas City Missouri is approximately a 42-block radius situated on the southern side of historical Linwood Boulevard. Over the past 50 years this tract has experienced intense change.
In 1950 the population in Tract 52 exceeded 6,500 people and consisted of 99% whites and .98% African Americans (Figure 3, Table 2). Within only about 50 years the population became completely inverted. Figure 1, Table 2 shows that in 2010 the population was 87% African American and only 6% white.
The average tenant in Tract 52 could expect to pay about $46 per month for rent in 1950 (or $454.57, 2015 Dollars), about $4 above the city average (Figure 3, Table 3). The average rental price was $281 in 2000 (or $31.06, 1950 Dollars) (Figure 2, Table 3) and fell to $263 in 2010 (Figure 1, Table 3).
Approximately 54% of the residents in Tract 52 own their home in 2010(Figure 1, Table 3), in comparison to about 26% of residents in 1950 (Figure 3, Table 3).
Only 54% of Tract 52 had earned their high school diploma in 1950 (Figure 3, Table 2); that is in comparison to 77% of the 2010 population (Figure 1, Table 2).
The median household income in Kansas City, according to the Metropolitan Statistical Area, is $45,656 but only $23,047 for Tract 52.
Figure 1 – 2010
Table 1 – General Population
| Total Population: | 1221 |
| Population Density: | 4901.1 |
Table 2 – Demographics
| Race/Ethnicity: | |
| Gender: | 493 Males, 728 Females |
| Average Age: | 35.1 years old |
| Average Income: | $25,130 |
| Highest Level Education: | Considering only the 729 persons over the age of 25.
Less than high school diploma: 166 High school graduate: 563 Completed some college: 323 Earned Bachelors Degrees: 68 Earned Masters or Doctorate: 0 |
Table 3 – Housing
| # of Housing Units: | 726 |
| Occupancy Status: | Vacant: 171
Owner Occupied: 195 Tenant Occupied: 360 |
| Median Home Value: | Rental Rate: $263 Sales Price: $72,200 |
| GINI Index: | .53 |
| Median Household Income: | $23,047 |
Figure 2 – 2000
Table 1 – General Population
| Total Population: | 1483 |
| Population Density: | 5977.6 |
Table 2 – Demographics
| Race/Ethnicity: | |
| Gender: | 798 Males, 685 Females |
| Average Age: | 35.5 years old |
| Average Income: | $32,116 |
| Highest Level Education: | Considering only the 947 persons over the age of 25.
Less than high school diploma: 390 High school graduate: 557 Completed some college: 244 Earned Bachelors Degrees: 29 Earned Masters Degree: 218 Earned Doctorate Degree: 6
*Please note I am aware these numbers do not add up but these ARE the figured given by the Census Bureau. |
Table 3 – Housing
| # of Housing Units: | 641 |
| Occupancy Status: | Vacant: 131
Owner Occupied: 171 Tenant Occupied: 357 |
| Median Home Value: | Rental Rate: $281 Sales Price: $62,100 |
Figure 3 – 1950
Table 1 – General Population
| Total Population: | 6,531 |
| Population Density: | 26,323.96 |
Table 2 – Demographics
| Race/Ethnicity: | |
| Gender: | 2,869 Males, 3662 Females |
| Median Age: | 35-64 years old |
| Median Household Income: | $2,705 |
| Highest Level Education: | Considering only the 4,785 persons over the age of 25.
No education: 35 Attended Elementary & Middle School only: 1,305 Attended some high school: 3,320 High School graduate: 2,585 Completed some college: 930 Earned Bachelors Degrees or more: 350 Not reported: 160 |
Table 3 – Housing
| # of Housing Units: | 2,604 |
| Occupancy Status: | Vacant: 116
Owner Occupied: 542 Tenant Occupied: 1,946 |
| Median Home Value: | Rental Rate: $46.89 Sales Price: $6,308 |
| Homes w/o Refrigeration Systems: | 10% |
| Homes w/o Efficient Heat Source: | 5% |
| Homes w/o bathroom: | 627 |
| Median Household Income: | $2,705 |
Info Source: (Social Explorer)