Category Archives: Kansas City

Education Among Predominately Black Community Lags Behind

Poverty and education are incredibly linked to one and other. One can directly determine the other in most cases. In the Graph, it shows the educational attainment for 4 blocks along Troost, tracts 86 and 91 on one side and 87 and 90 on the other. From this figure, we see that on the side with 86 and 91 have a high educational attainment, with the majority having at least a bachelors degree or masters. The other two show a very different story, with the majority having a high school diploma, if that. It is not surprising that the less educated side is the side that almost half the population is impoverished. It is also not surprising that this side is 88% African American. This is yet another ripple in a long history of social injustice and is a huge indicator of the negative feedback loop which is this community.


Swope Parkway to E 50th and Prospect Ave

census-data-and-figures

The census data supports that there has been use of restrictive and deeds planning tools to create racialize space in figures one, two, & three revealing across all three years, covering 60 years total, a progression of physical segregation. Starting with using the 1950 survey as base, because tracts 76 and 77 reveal a population that is a heterogeneous demographic mixture and in 2000 to 2010 primarily a minority homogeneous population with a median income on a average of $10,000 less than in 1950. The 2010 median house values in the tract 76 and 77 sunk on an average of $10,000 less than the 1950 median house values and only matches one third of the $135,000 median house value of Kansas City in 2010. With that in comparison, the median house values of tracts 76 and 77 in 1950 averaged out to $69,307 about $8,000 above the 1950 median house value for Kansas City. In conclusion, tracts 76 and 77 seem they were subjected to the use of planning tools that create racialized space because if they weren’t the population should reflect diverse demographics and the rise of property values near the median of the entirety of Kansas City’s house value using the1950 census data as a base standard when residential segregation was not at its peak yet. (Gotham, 2002)

-Stephen Pociluyko

Census information for 21st to 24th on Prospect Ave

1950 2000 2010-msa 2010

When looking at the census’ data for 1950, the first thing I noticed was that there are four tracts that make up my blocks; tract 32, 33, 39, and 37. In two of the four tracts there are a very small number of white populations as compared to black on the tracts west of prospect. Redlining was starting to happen more often in this area, as noted in my first paper. “In the late 1940s home owners associations were trying to keep “blacks” out of “whites” neighborhoods. One of the ways that this was accomplished was by the association raising money to buy houses that used to be owned by blacks or who will rent to blacks.

The census data for 2000 shows a huge loss in population when compared to fifty years previous. White flight appears to be an issue when you look at the drastic change of the number of white population in all four tracts

Looking at the 2010 MSA for Kansas City shows that there is a large population in this area, almost 2 million people. The population of whites is more than six times that of the black population is Kansas City.

2010 shows a slight increase in three of the four census tracts, the fourth tract 32 which became tract 166 has a sizeable population increase. Tract 32 had a small increase in white population while the other three saw large numbers return. However, the white population is nowhere near where it was in the 1950s in tract 33 and 37.


Race in Census Tract 47

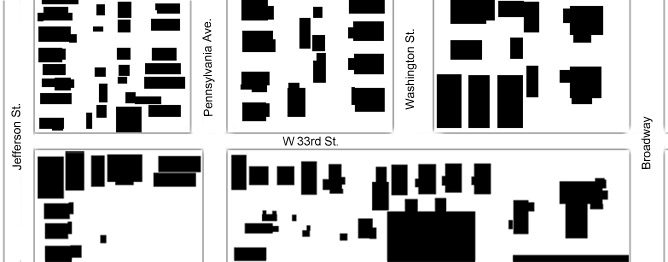
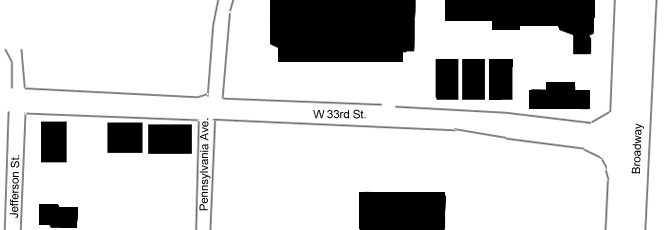
When reviewing Census records from 1950, 2000, and 2010, the population difference by race in census tract 47 – which contains the blocks from Jefferson Street to Broadway Boulevard along West 33rd Street – begins with a dramatic imbalance and displays the unevenness in Kansas City’s racial composition as the years go by.

In 1950, census tract 47 was a predominantly white area with 4,970 white residents and only 63 African-American residents. When viewing the numbers city-wide, Kansas City had 400,599 white residents within its city limits compared to only 55,682 African-American residents. To put these numbers into perspective, Kansas City in 1950 had over eighty percent of its population comprised of white residents.

In 2000, the great population divide between white residents and African-American residents at the census tract and city level is less drastic than in 1950. In census tract 47, there are 500 white residents and 202 African-American residents. At the city-wide level, Kansas City housed 254,471 white residents and 136,921 African-American residents. No longer are white residents eighty percent of the city’s population, but this data still displays a lack of evenness in racial composition.

In 2010, the population numbers of white and African-American residents remain unequal. At the census tract level, white residents held 1,915 spots in the population and African-Americans totaled 666 residents. City-wide, white population exceeded African-American population by over 100,000 people. However, the most sobering racial population numbers come from the metropolitan statistical area data. As can be seen in the data table below, at the MSA level, African-Americans were outnumbered by whites by over a million people – precisely 1,514,888 white residents and 250,563 African-American residents.

UPD CENSUS 2010 - blog post
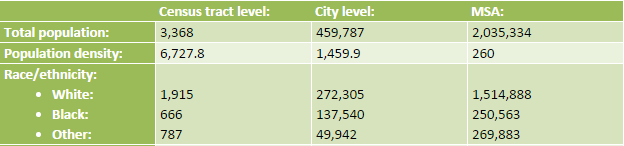
2010: Population and racial composition numbers compiled from Census data

Jefferson Street to Broadway Boulevard

My assigned area is a portion of West 33rd Street to the beginning of Linwood Boulevard. The type of uses that currently characterize the area are primarily mixed use. There are commercial businesses on both the North and South sides of my blocks – such as Browne’s Irish Marketplace on the corner of West 33rd Street and Pennsylvania Avenue and Sheng Chinese restaurant on the corner of West 33rd Street and Broadway Boulevard – but there are also a small number of residential apartment buildings.

One major change that I observed when researching these blocks was the dramatic decrease in density that occurred in the area from 1950 to present day. In 1950, a number of residential homes lined the streets. In 2015, these homes no longer exist and have been replaced with parking lots on both the North and South sides of West 33rd Street.

A figure-ground diagram of Jefferson St. to Broadway Blvd. displaying conditions in 1950
A figure-ground diagram of Jefferson St. to Broadway Blvd. displaying conditions in present day.
A figure-ground diagram of Jefferson St. to Broadway Blvd. displaying conditions in present day

Holmes to Campbell

Researching Linwood Boulevard helped me gain an overall understanding of how Cities change of Time. There were new streets built, streets widened and streets renamed. The density of my are fluctuated, buildings were built, and then destroyed, sometimes replaced by new buildings other times by bare parking lots. It seemed that there was a theme of reusing buildings with a new purpose. Some houses became places of businesses and a gas station became a tire repair store. This section Linwood seemed to be at its height in 1950, there were more residential buildings and businesses, and over the years the block slowly died down. It was interesting to see how new streets formed, new buildings were built, older buildings were re-purposed and buildings like the Seventh day Adventist Church that ceased to exist.

The most historic building on the blocks is the Kansas City Athenaeum. The Kansas City Athenaeum was formed in 1894 by joining several women’s groups together. The members of the group formed as a way for women to receive a college level education in subjects such as art, music, literature, science, and economics. The group was also very active in civic and charitable events. Their building was completed in 1914, and remains in use today.

The block tells an interesting story and I only uncovered the surface. I would like to more of the details about the buildings that cease to exist. I wonder what their stories are? Perhaps sometime I’ll have to eat at that Texas Tom’s as well.

Athenaeum
Kansas City Athenaeum
1950 Sanborn Map
1950 Sanborn Map