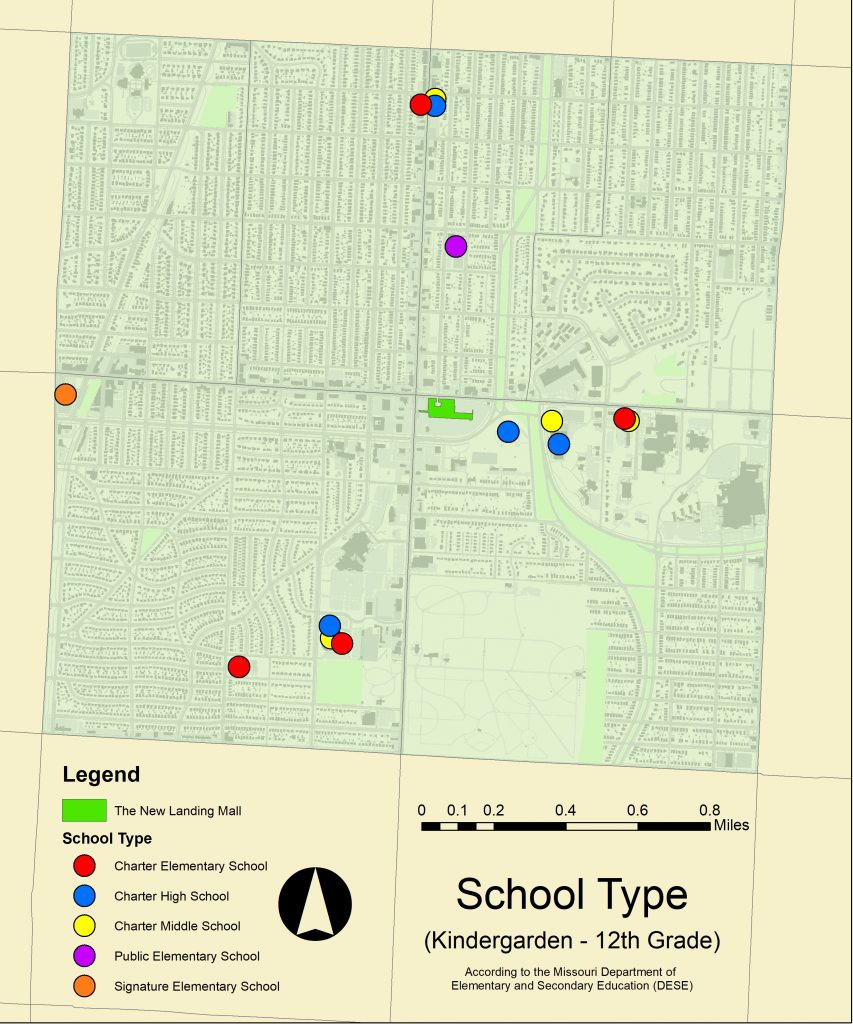
There are 14 schools within our six-census-tract study area. These schools currently enroll over 4,500 students and employ almost 500 staff. Of the two of the 14 schools that are run by Kansas City Public Schools (KCPS), only one is a regular ‘public’ school – Troost Elementary School. The other is a magnet school, or a “Signature” school, as deemed by KCPS – Border Star Montessori. The rest of the area’s schools are charter schools. There are four elementary, middle and high schools each. Interestingly enough, these charter schools appear to have clustered into three distinct areas. One of which is just east of the Landing site.
School Type Map – Jackson County Census Tracts 80-83, 86 & 87. Source: Jared Islas, 2019.
The below GIF shows how the students per square mile have changed over time in our census tracts. The most identifiable trend is that the census tracts east of Troost have declined since 1990 at a much more drastic rate than those west of Troost. West of Troost, only Tract 82 went down since 1990 (and only by 6 students per square mile). Tracts 83 and 86 have both increased their student density since the 1990 census.
School Aged Population (Students per Sq. Mi.) – Jackson County Census Tracts 80-83, 86 & 87. Source: Jared Islas, 2019.
Note: This should be a .gif file
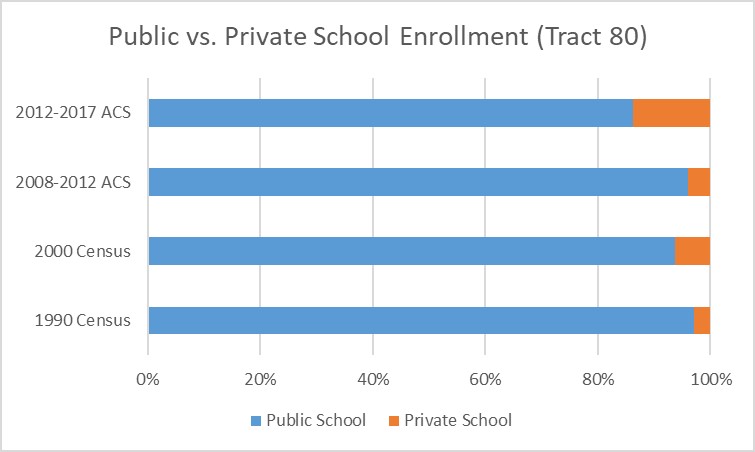
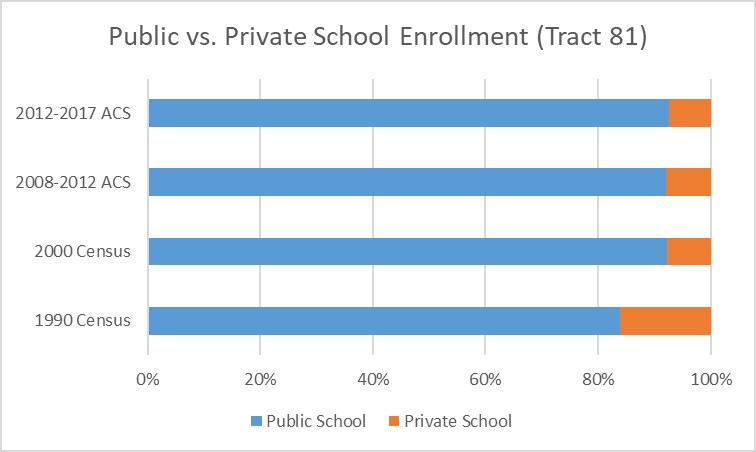
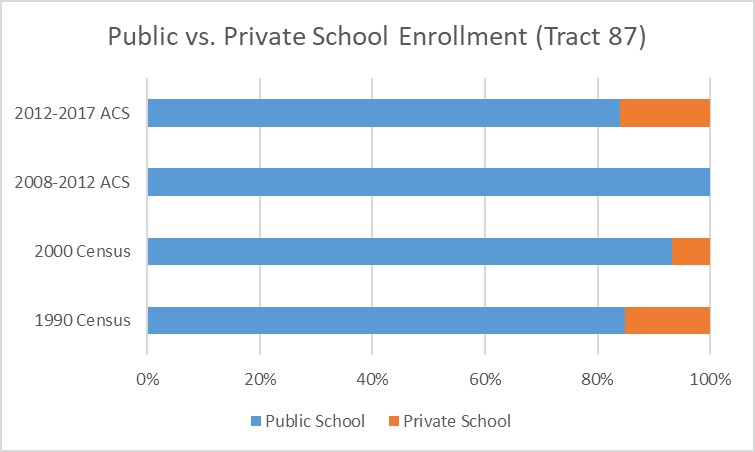
Census Tracts 80, 81 and 87, which are east of Troost, have all had majority public school enrollment since the 1990s.
Public vs. Private School Enrollment – Jackson County Census Tract 80. Source: Jared Islas, 2019. Public vs. Private School Enrollment – Jackson County Census Tract 81. Source: Jared Islas, 2019. Public vs. Private School Enrollment – Jackson County Census Tract 87. Source: Jared Islas, 2019.
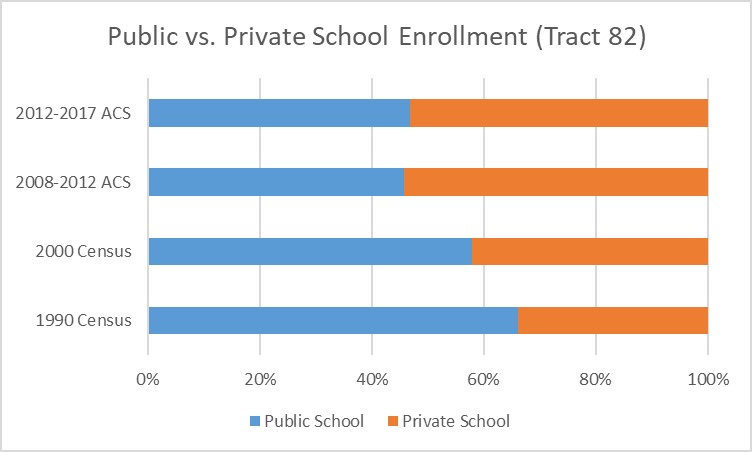
Census Tracts 82, 83 and 86, which are west of Troost, have had less of a consensus when it comes to public vs. private school enrollment. Tract 82, has seen the most consistent split over time. Most recently, this tract has seen a 50-50 public-private school split.
Public vs. Private School Enrollment – Jackson County Census Tract 82. Source: Jared Islas, 2019.
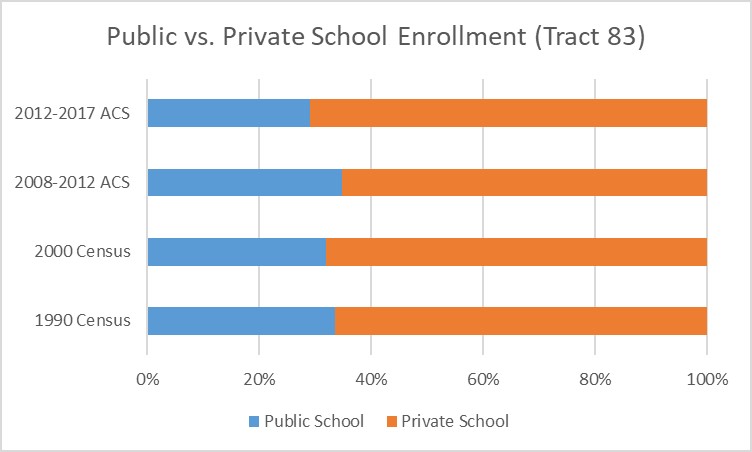
Tract 83 has seen a consistent 65% private school enrollment rate over the tracking period.
Public vs. Private School Enrollment – Jackson County Census Tract 83. Source: Jared Islas, 2019.
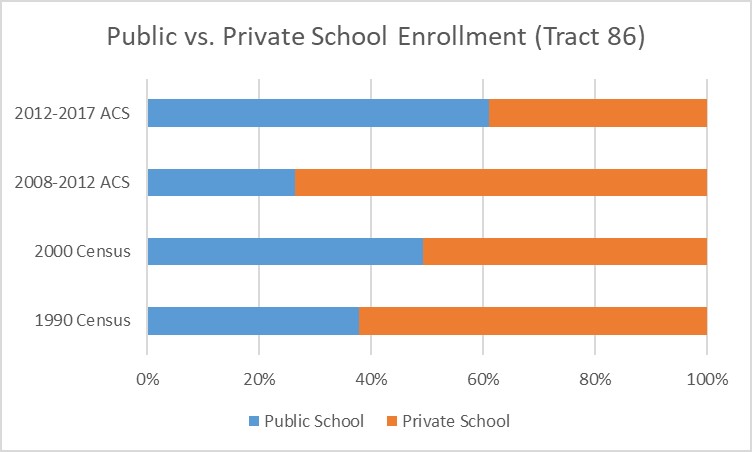
Finally, tract 86 has oddly gone back and forth with their public-private school enrollment.
Public vs. Private School Enrollment – Jackson County Census Tract 86. Source: Jared Islas, 2019.
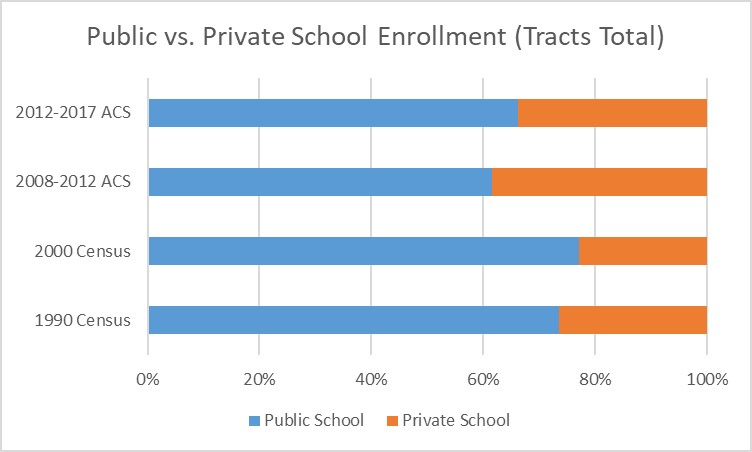
The students in our study area, which is all six census tracts discussed above, looks to be and have been mostly public school students since the 1990 Census.
Public vs. Private School Enrollment – Jackson County Census Tracts 80-83, 86 & 87. Source: Jared Islas, 2019.
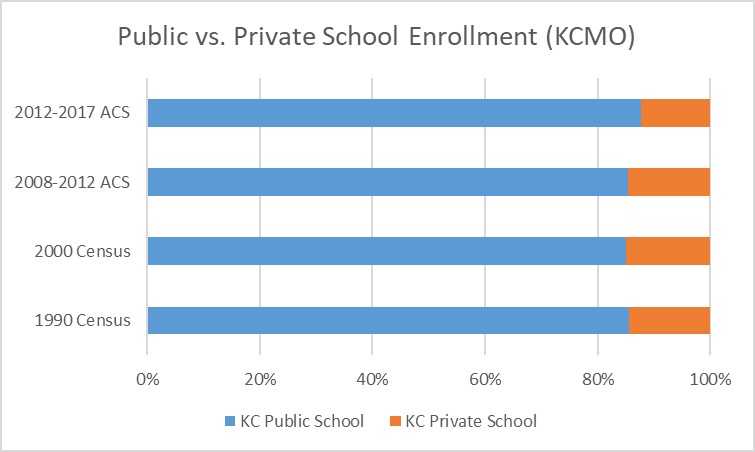
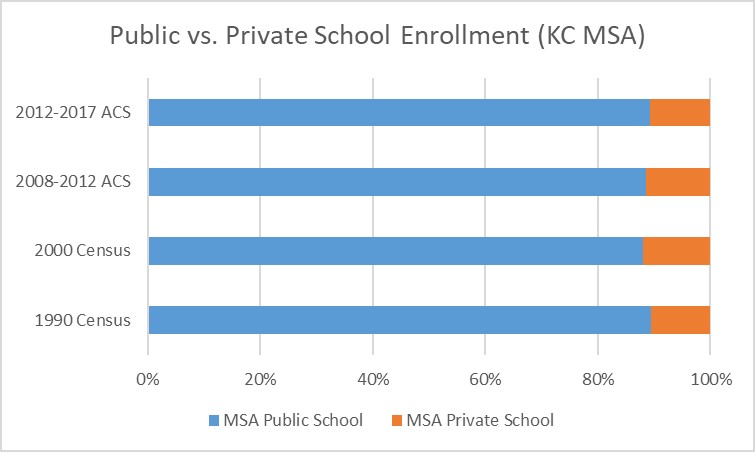
Comparatively, our total tract area is much like Kansas City, Missouri and the KCMO/KCK Metropolitan Statistical Area (MSA) in that the majority of students are enrolled in public school.
Public vs. Private School Enrollment – Kansas City, Missouri. Source: Jared Islas, 2019.
Source: US Census American Community Survey 5 Year Data 2013-2017.
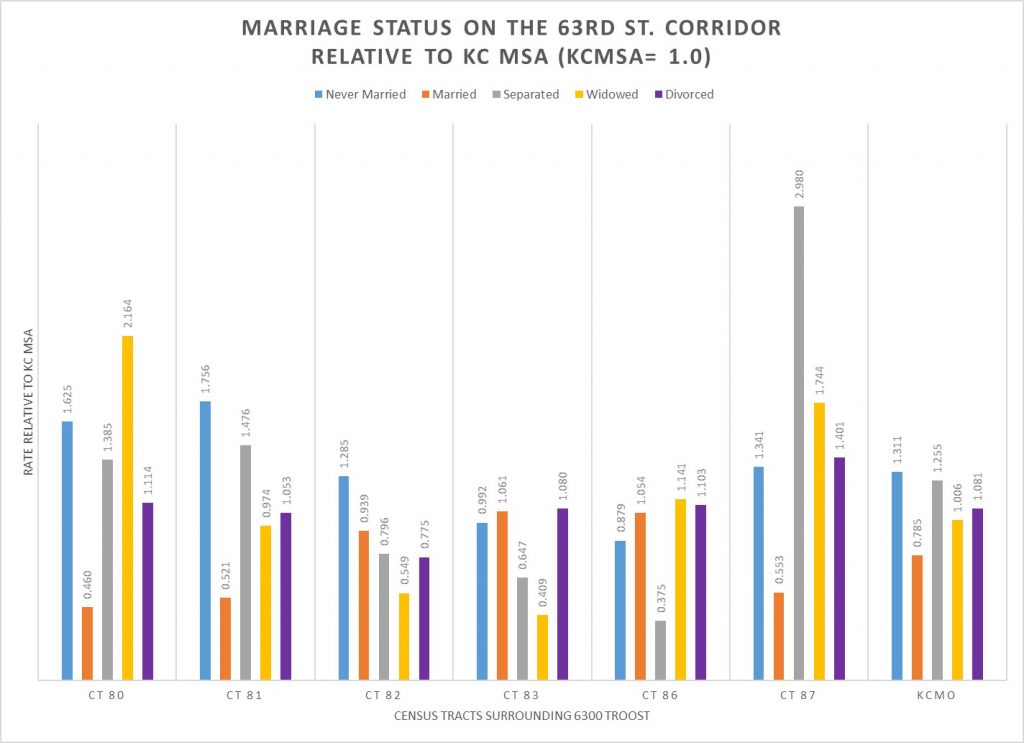
Is there geographic variation in the marital status of the population in Kansas City? Yes, this graph shows that marital status varies across the census tracts surrounding the Landing Site on the 63rd Street Corridor. Census tracts 80, 81 and 87 all have a lower rate of marriage than both the City of Kansas City and a much lower rate of marriage than the Kansas City Metropolitan Area. Perhaps the most surprising data are the high rates of marital separation and widowhood in tracts 80 and 87. Note that the marriage rate in Kansas City is substantially less than the rate in the Kansas City Metropolitan Area.
How do you read the data in the chart? All of the data are from the US Census American Community Survey 5 year tabulation of data from 2013 to 2017. Data on the number of poeple age 15 and older by marital status were downloaded from the Census site. Then rates were calculated by comparing the proportion in the tract and in Kansas City, MO to the rate for the Kansas City Metropolitan Area. The rates for the KC MSA are equal to 1. The indexed marriage rate of .460 for Census Tract 80 means that the rate in that census tract is 46% of the KC MSA rate. This means that the number of married people in this tract is less than half what you would expect applying the metro wide average. The 2.164 rate of widowhood in Census Tract 80 means that there are 216.4% more widows in this tract.
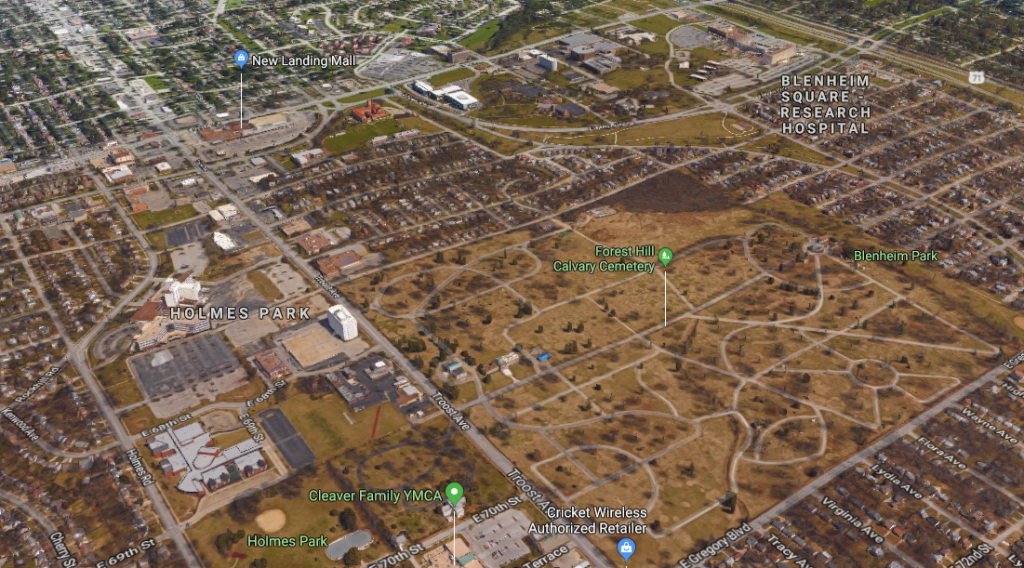
With time comes change. Looking at census data from 1990 to the most recent American Community Survey (ACS) from 2013-2017 changes in population are evident. I looked at the 6 census tracts surrounding the Landing Mall, tracts 80-83, 86, & 87. Slight transformations have occurred within the 6 tracts over the last 30 years. The Landing Mall is located in census tract 87 and has maintained its low population density over the years. Forest Hill Calvary Cemetery and Research Medical Hospital each takes up a quarter of the land on tract 87 which explain why this tract is continuously shown in the lightest blue in figures 1-4. The most dramatic changes are seen between figure 1 and figure 4. Tracts 80 and 86 went from a deep teal to 2 shades lighter indicating lost in population density.
Figure 1. Population Density (per sauare mile) 1990 for census tracts 80-83, 86, & 87 created by Cristina Aurich 02/2019
Figure 2. Population Density (per square mile) 2000 for census tracts 80-83, 86, & 87 created by Cristina Aurich 02/2019
Figure 3. Population Density (per square mile) 2010 for census tracts 80-83, 86, & 87 created by Cristina Aurich 02/2019 2010
Figure 4. Population Density (per square mile) 2013-2017 for census tracts 80-83, 86, & 87 created by Cristina Aurich 02/2019
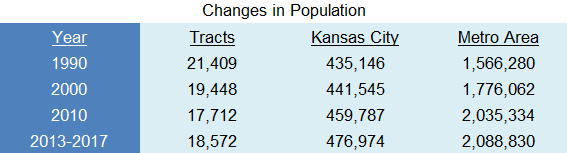
Table 1. Changes in Population comparison between census tracts (80-34, 86, & 87), Kansas City, and the Metropolitan area created by Cristina Aurich 02/2019
Table 1 displays the comparison in population in the 6 tracts of study, Kansas City, and the Metropolitan area. Kansas City and the Metropolitan area have been in parallel with each other and continue to grow in population. Whereas the 6 tracts of study have been steadily decreasing until recently. From 2010 to 2013-2017 Kansas City has seen almost triple the population growth, in less time, than it saw from 1990-2000. Though people have left the area of 63rd Street and Troost Avenue in the past, they are beginning to return. This is a good sign for redevelopment of the Landing Mall and future development of the surroundings.
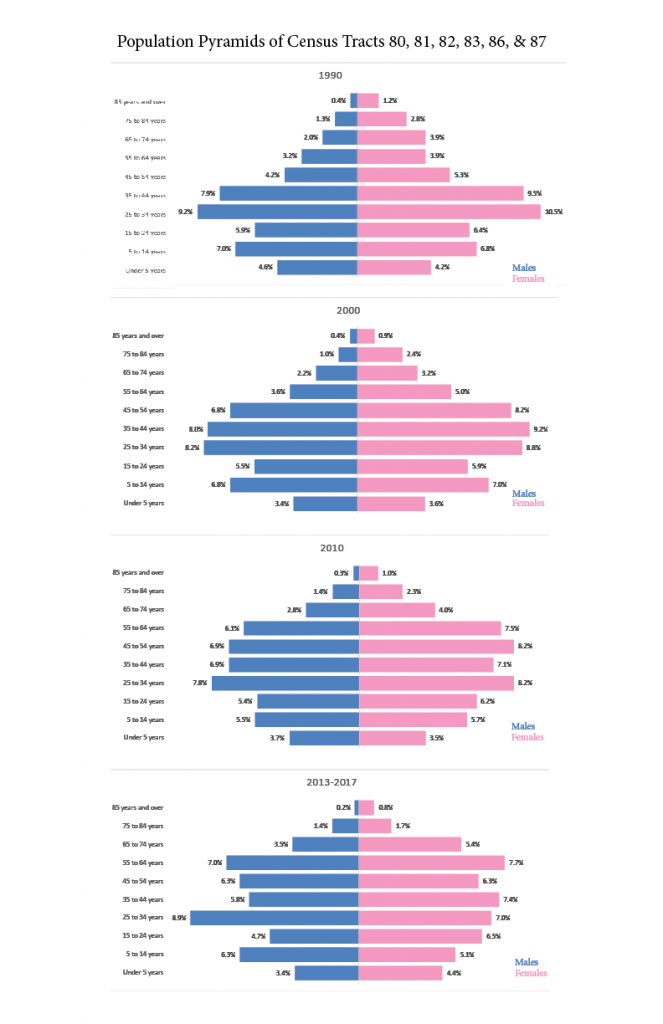
Figure 5. Population Pyramids for census tracts 80-83, 86, & 87 created by Cristina Aurich 02/2019
Figure 5 displays the age groups of the population living in the 6 study tracts. Looking at the pyramids, the highest number of population continues to lie within the age group of 25-34. However, looking at the population pyramids from 1990 and 2000, the population continued to grow to the next class causing the pyramid to swell towards the top. The newest population pyramids from 2010 and 2013-2017 show the population spread more evenly throughout the classes. The population of those living in the class of 65+ years has been growing since 2000, which is also a trend seen through the Metropolitan area.
Simply knowing the statistics of population and age in surrounding neighborhoods can lead to better planning. This is a tool that seems to be forgotten too often when planning with the people in mind.
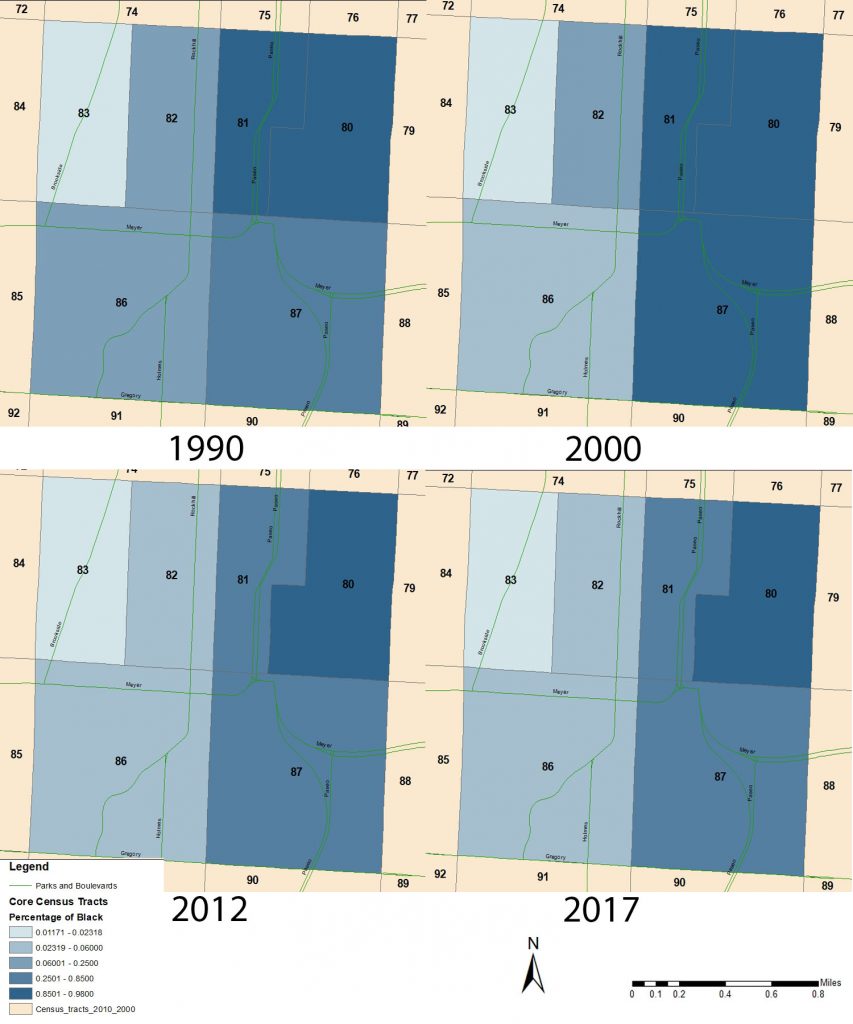
Figure 1. Collection of maps created in ArcGIS showing the percentage of the Black population in each census tract. The data was taken from Social Explorer.
Figure 1 paints two stories that are intertwined with the redevelopment of 63rd and Troost. The first is that of the geographical location of race in the specific study area as well as in Kansas City, MO as a whole. The racial distribution can be easily described as a function of Troost Avenue, which seems like a center dividing line across all four maps. Keeping the breakpoints consistent for each map, we are able to see that over the course of the last 30 years, little has changed in terms of east and west across Troost. All three census tracts west of Troost have consistently stayed below 25% in terms of the black population, in contrast, the percentages of the white population has stayed over 75%. Just a couple blocks over on the east side of Troost, the three census tracts have stayed over 70% black for at least the past 30 years. Since 2000, the percentage of the black population in these three eastern tracts has seen a bit of decrease. This decline in the black population can possibly be attributed to two things: the migration of the black middle class out of the inner city; and the trickling in of white alone, back across Troost. From the year 2000 to 2017, the census tracts east of Troost saw a 123% increase in the white alone population, even though the percentage of the black population still stays strong.
Figure 2. Graph showing the population by race in 2017, compared between census tracts west and east of Troost Avenue
The graph above does a good job of breaking down the race in the study area into two distinct categories based on geography. It further emulates the racial separation of across Troost Ave. A notable difference between 1990 and 2000 is the emergence of a new racial classification, two or more races. The result of this it seems has more impact on the census tracts west of Troost rather than east. Also, the only races predominantly found on the east side of Troost are black alone and American Indian alone.
Figure 3. Dot density map showing Hispanic status among census tracts, where one dot equals one person. Map created using ArcGIS, census data taken from Social Explorer
Figure 3 shows the concentration of residents that identify as Hispanic in the area surrounding the Landing. Census tract 86, has by far the larger Hispanic population. Most of this census tract is single-family residential homes under the Oak Meyer Gardens neighborhood association. Figure 4 clarifies a couple of things, like that even though there is a larger Hispanic population in tract 86, the proportion of Hispanic in the tract is still just over 8%. As well, the census tract 86 is closer demographically to Kansas City and its Metro area, than compared to any other census tract being studied.
Figure 4. Graph Showing the percentage of Hispanic population in 2017 compared across census tracts, the city, and metropolitan statistical area (MSA). Census Data taken from Social Explorer.
After examining this data, it becomes apparent that this specific census tract contains characteristics that attract the normal size Hispanic population. This could be the jobs directly available like the nearby medical center, or the housing stock and pricing available.
Figure 5. Map showing the Tenure by race, specifically the Black population. Yellow represents the percent of housing units with a black householder that is owner-occupied. Orange represents the percent of housing units with a black householder that is renter occupied. Data taken from American Fact Finder, ACS 2012-2017 Data.
The final demographic data that I will be analyzing is Tenure by Race. Figure 5 focuses on black alone population and the pie charts show the proportion of black householder housing units that are owner-occupied or renter occupied. Going back to the point made earlier about racial separation across Troost, this data follows the same pattern. In most of the census tracts except for tract 87, the majority of black households are owners instead of renters. Even though the black population in census tracts west of Troost, especially in 83, are below 30%, the majority are still owners and have an investment in the area. It is reasonable to state that homeownership is a form of investing and stakeholding in a given area, so in areas with higher ownership rates may show a higher rate of investment. On the other hand, high rates of ownership or rentership may be due to the pricing of housing in the census tract: a higher cost for housing may lead to higher rentership. Furthermore, ownership rates may be telling of the housing stock available and whether is worthwhile to invest.
Figure 6. Map showing the Tenure by race, specifically the white population. Yellow represents the percent of housing units with a white householder that is owner-occupied. Orange represents the percent of housing units with a white householder that is renter occupied. Data were taken from American Fact Finder, ACS 2012-2017 Data.
In figure 6, the race distinction is much more prominent geographically than in figure 6. The majority of white households west of Troost are owner-occupied when compared to figure 5, this may just mean that there are not all that many housing units occupied by renters west of Troost, to begin with. In the census tracts east of Troost, white households are almost exclusively white, which is the case in census tract 80. This may be because white households do not want to invest in the housing stock here, but at the same time, the lower number of whites that do live east of Troost may only be able to afford to rent the housing units over ownership.
A look into the educational demographics of the census tracts surrounding “The Landing”
Enrollment status
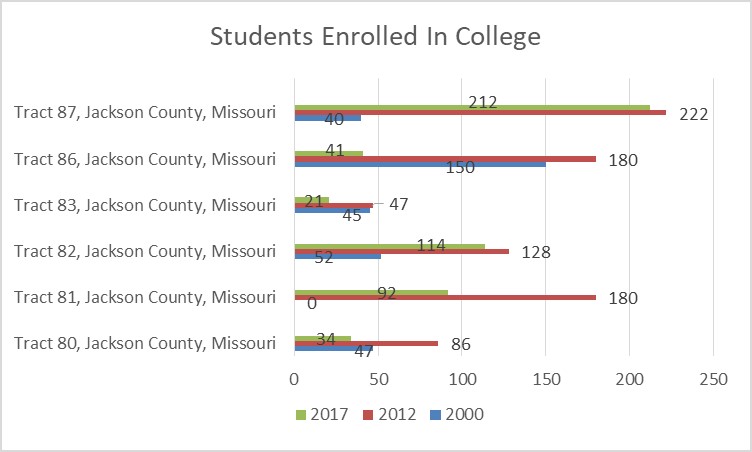
Looking into the past trends of people in the six surrounding census tracts of the 63rd street intersection it is apparent that there are plenty of people in the area striving for higher education. Represented in Table 1. below, there seemed to be a spike in college enrollment in 2012, where every tract followed a growth trend in that year.
Table 1. Created by : Logan Sours
Educational Timeline
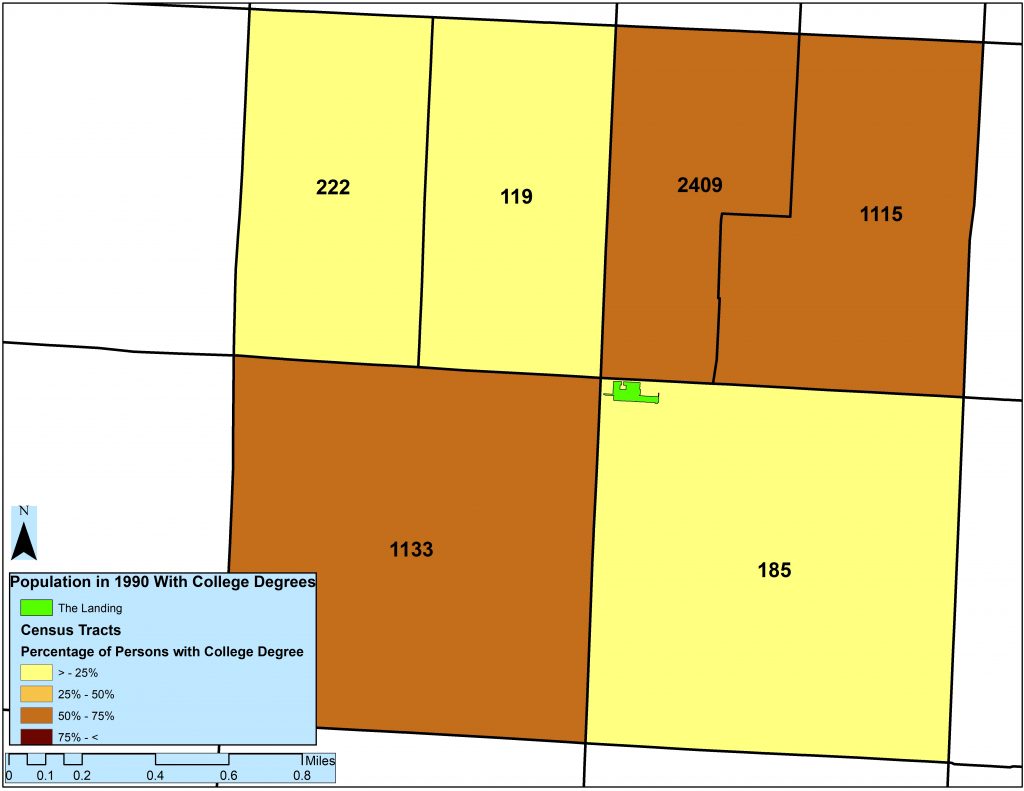
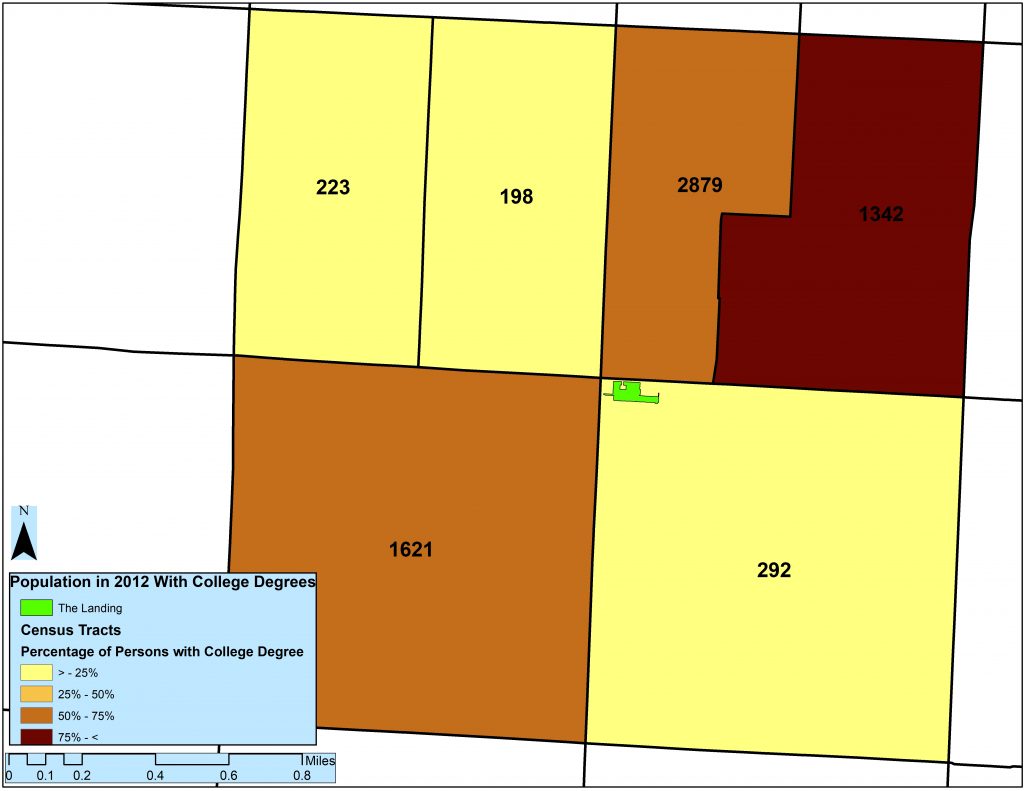
Map 1990 | Created by: Logan Sours Map 2000 | Created by: Logan Sours Map 2012 | Created by: Logan Sours Map 2017 | Created by: Logan Sours
As seen in the map compilation above, the census tracts have shown tendency to remain within the same classification. The only real change shown is in tract 80 crested above the 75% mark somewhere between 2000 and 2012. This is interesting because even as population may have changed, the same census tracts show he same change over time.
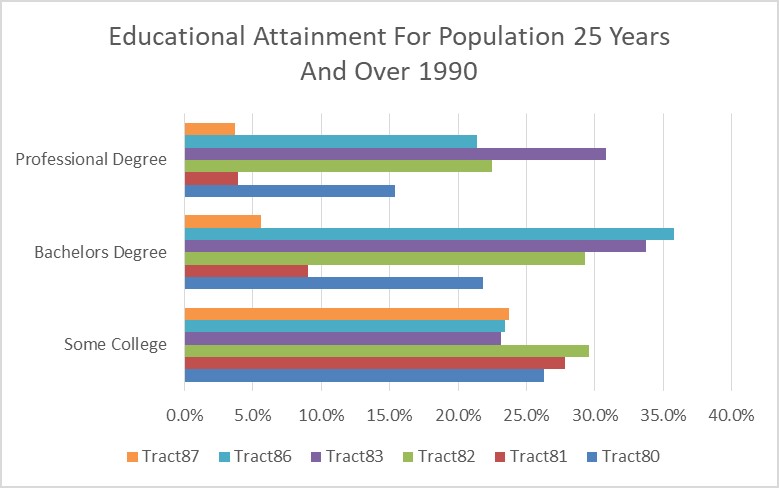
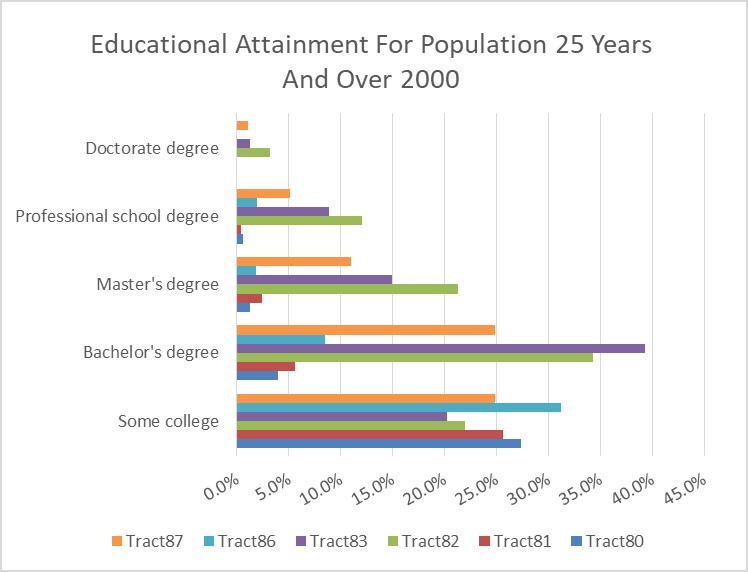
Table 2. Created by: Logan Sours Table 3. Created by: Logan Sours Table 4. Created by: Logan Sours Table 5. Created by: Logan Sours
The tables above show that there is a large amount of the population that has some higher education falls into the categories of some college of has obtained a bachelors degree. Another notable observation is that the census tracts that have higher numbers of people with degrees have lower numbers in the ” some college” area.
As a life long resident of the Kansas City Metro I have passed along this corridor countless times. My earliest memories of the area stretch back to my years attending grade school at the now closed Somerset Elementary. On field trips to the Kansas City Zoo we would often take the E. Gregory Blvd. to Cleveland Ave. route to our destination. Even at this early age I can remember how each neighborhood would change after crossing State Line, Wornall, Troost, and finally over 71. Before we even understood what a grid system was, commercial zoning, or of the impact of how the highways have affected the city, we knew where we were along the ride by the landmarks we saw.
View North East over Forest Hill Calvary Cemetery. Source
The landmark which informed us of being halfway to our destination was always Forest Hill Calvary Cemetery as we would superstitiously hold our breath and raise our feet as we drove past the massive two square miles of land. The enormous and beautiful space, located just south of the Landing Mall, is where some of Kansas City’s most well-known figures are laid to rest including Satchel Paige, Buck O’Neil and Joyce Cldye Hall.
In more recent years, I have come to know the area even more. Frequently visiting the shops and restaurants in Brookside and enjoying a delicious breakfast at Niece’s or when still inside Lutfi’s near the Citadel, the Distrikt Biskuit House. Above all, it has been the countless number times riding to and from school on the MAX along Troost to 85rd St where I have become most familiar with the area. Along this route over the course of the last two semesters I have seen area slowly transform with the construction of new buildings, the remodeling of old ones and small businesses come and go.
As the physical form of this area continues to change, its my opinion that the importance of this bus line will continue to stay the same. Nearly every day along this route, a stop a 63rd St. is almost guaranteed, rain or shine. This reflects the areas diversity in the chosen modes of transportation for the surrounding population. There is a heavy amount of automobile traffic, foot traffic, use of public transportation and marked bike lanes in the area. All of which should be a positive contribution towards the area’s economy.
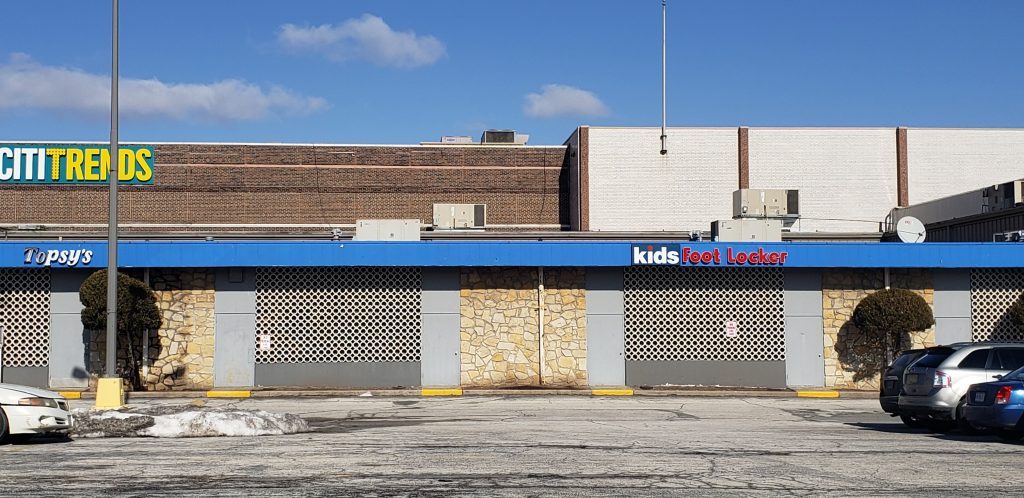
However, this diversity in
transportation is unfortunately matched by the atheistic materials which make
up the building and the signage used to advertise its existence to potential
consumers. Stone, brick, concrete, iron and more are wrap around the 130,000 square
foot building marking each new addition or renovation that has taken place over
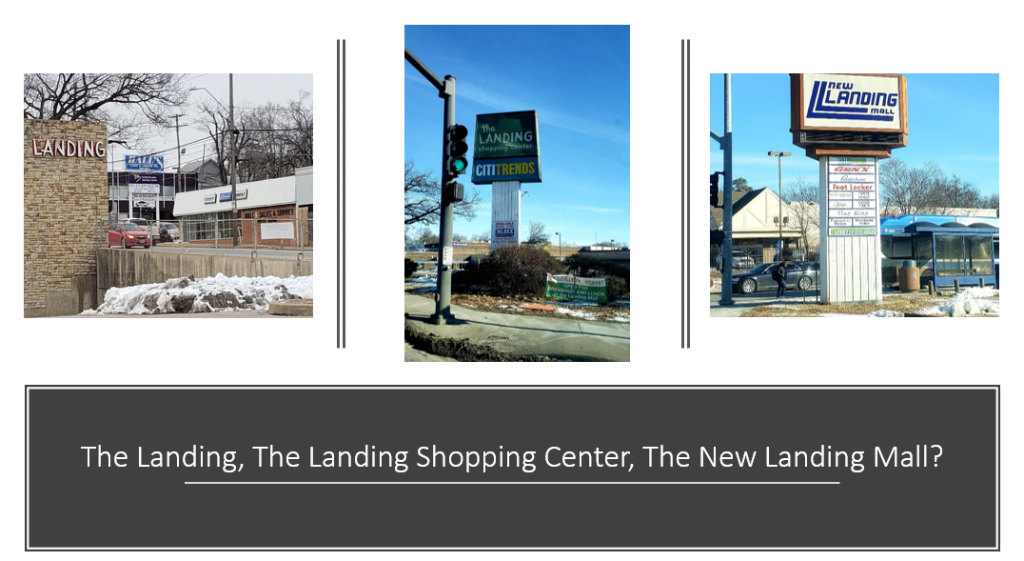
the years. This can also be seen in the signs for the Landing located at each
corner of the property. These two elements combined and the addition of the
mall’s lack of a clear and inviting entrance takes away any sense of arrival or
place.
This area of the corridor has great
potential to become a focal point for the diverse well-known neighborhoods that
surround it. There is a strong presence of resilient businesses within and around
the Landing Mall, diversity in the use of transportation, and several well-known
medical and educational institutions nearby. With these assets, it seems highly
feasible to once again transform the mall back into a landmark for the city and
the destination it once was.
When looking at housing unit data for the area surrounding The Landing, data was pulled for census tracts 80-83,86, and 87 to have a good amount of area around the site. Data was gathered for years 1990-2017 and included the Decennial Census Data and ACS 5-year estimates. When looking at the data, I thought the most useful information for us to know would be the vacancy numbers for housing units and the housing type. Majority of the homes were single family detached which then narrowed down my focus to vacancy.
I first looked at the number of housing units in total to see how they changed throughout the years. The above image should be a GIF but if it is not changing images the link has been included as well to download and watch it. I thought it would be interesting to first analyze how the neighborhood grew, which in relation to Kansas City, Missouri, it grew at a comparable rate.
When looking at the vacant units and especially the change over time, appears to be growing more and more vacant. Because of this, I decided to look at the percent vacant to get a clear numerical image of where our census tracts really are. Doing so has shown an increase in vacancy over time as the number of housing units has decreased.
Vacancy
Units in Total
Percent Vacant
1990
700
9,037
7.7%
2000
518
8,751
5.9%
2012
995
8,826
11.2%
2017
1,147
8,894
12.8%
Seeing as I did only look into the housing units and the occupancy status based on housing, it would be interesting to conduct a further analysis of occupancy considering all structures in these tracts. All in all, I think we have an opportunity with the site to create something to bring families back into the area and decrease the amount of vacancy and possibly increase the amount of structures. If the demand can be created then we can produce the necessary neighborhood units to supply the people with what they need.
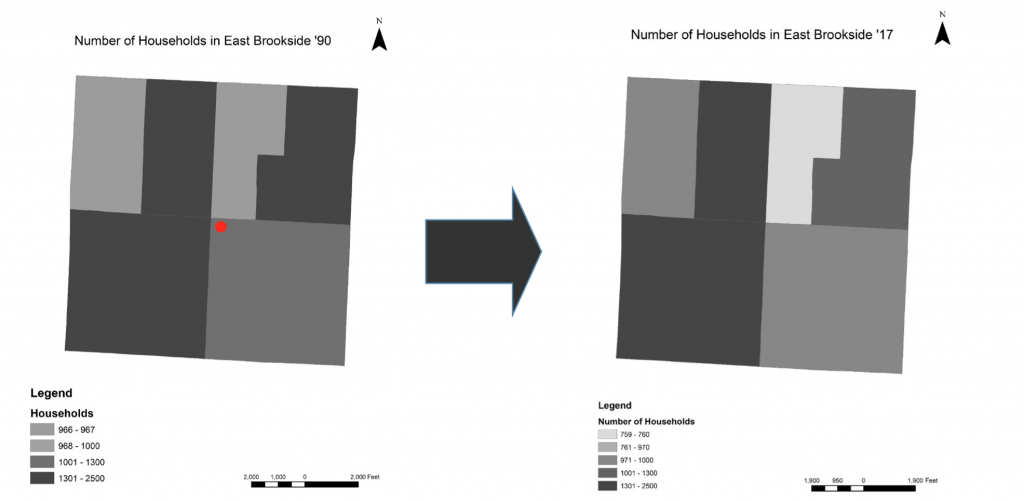
Map showing Household change from ’90 to ’17 in tracts surrounding the landing shown in red.
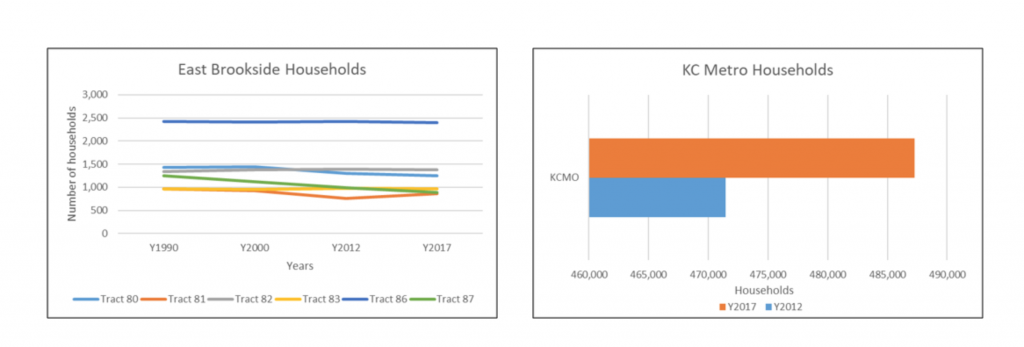
Looking at the data from KC and the surrounding tracts of the Landing has led to a few findings of Household, Family type, and families. In all, the tracts we see a steady decline in households, about 8% since 1990.
Household change of individual tracts compared to KC Households.
This is in contrast with KC (see above bar graph) which has had a net increase of households. One tract, 87, has had over a 29% decline. This means that there are less people net in the area along with the placid increase of new homes.
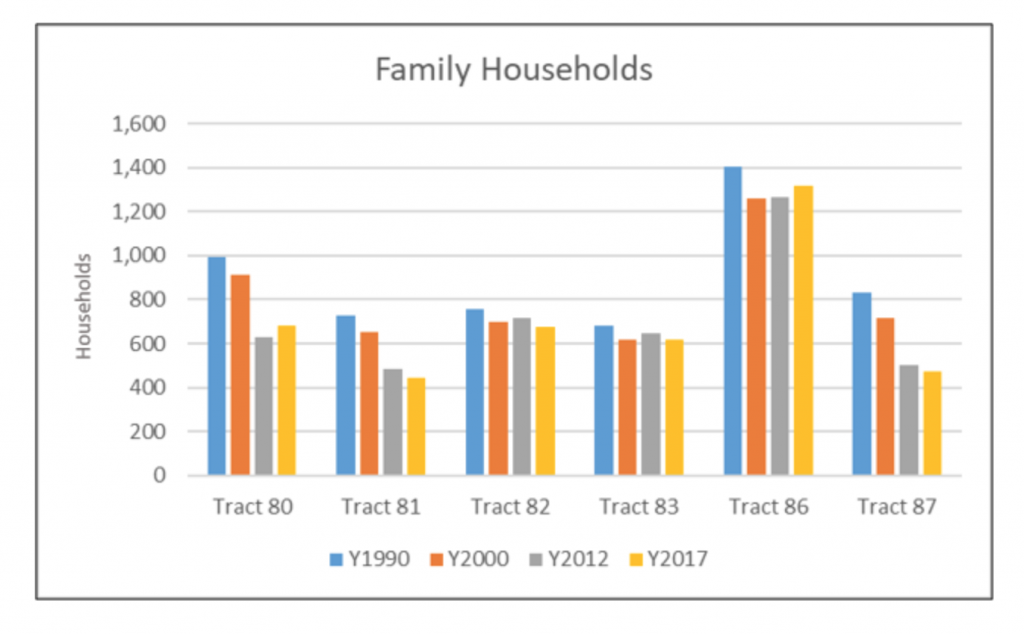
Family Households shown by tract.
The second category was families. This group is in major decline, seeing a negative drop of 23% along with married families and other families down 20% and 36%, respectively. KC, for comparison, have had an increase of over 1%. This could mean that there are more single people, or less couples having children or getting married.
Non family households was interesting, having almost a double increase in each category (nonfamily, Male and Female Households). This proves the thery that there are more single people or non-married families moving in. This could be because of the low income or lack or oppritunities.
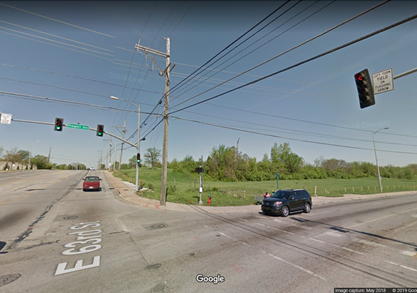
Figure 1. Image of the intersection of 63rd and Prospect NW taken from Google StreetView, May 2018
Introduction
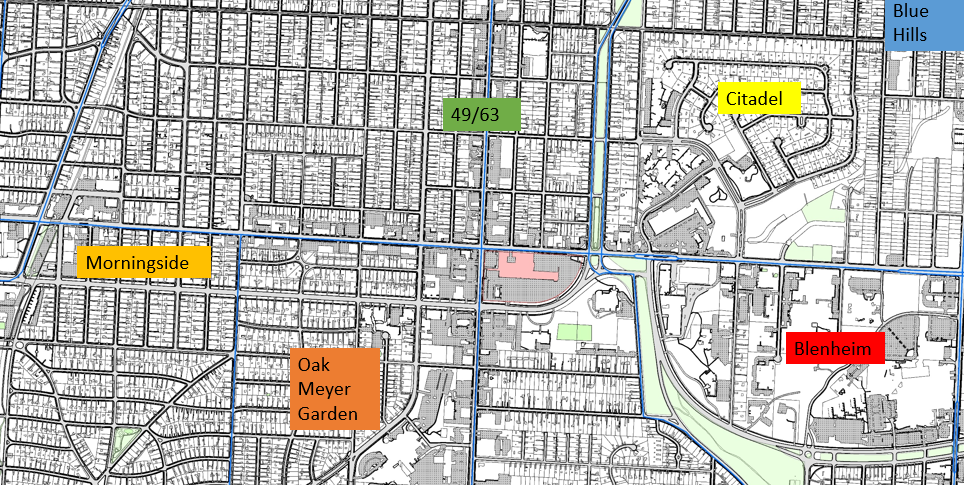
At the easternmost edge of the 63rd Street Corridor study area lies the intersection at Prospect Avenue, another major commercial corridor running north to south through the heart of KCMO. Prospect has been and is set to improve upon its distinction as a major transport thoroughfare with the addition of the Prospect MAX (http://www.kcata.org/transit-initiatives/prospect_max) similar to the bus route that runs along Troost Avenue. The specific intersection has also gone through a lot over the past two decades, but with its close proximity to many institutional land uses like hospitals, the area will not stop to grow and change. I will look at how the particular area from Euclid to Prospect has evolved since 1925 from single family detached homes to major transport and medical center.
1925
Figure 2. Figure-Ground from 1925 based on Tuttle, Ayers, and Woodward 1925 Atlas of Kansas City and its Environs
To start, I will look at how the area approximately looked 95 years ago. Figure 1 shows an image that seems almost reversed when looking at a figure-ground of the area in 2019. Most of the development for these bounds had only occurred in the southeasternmost portion of the Blue Hills neighborhood (which stretches northward to Swope Pkwy and is bounded by Paseo and Prospect). There existed only single-family detached housing on the inner streets and some commercial buildings along 63rd street and some on Prospect, including the gas station on the Northeast part of the 63rd and Prospect intersection. The large swath of what appears to be empty land to the West is the Blue Hills Golf course, which was founded in 1912 and moved in 1963. The current development and morphology of the area in 1925 saw a continuation of single family detached housing across 63rd southward, as well as more commercial buildings along 63rd and Prospect. The 1925 atlas also shows that it was JC Nichols, famous residential and commercial developer based in Kansas City, that owned the land bordering 63rd and Prospect at the Southwest corner. This ownership stretched west along 63rd to Brooklyn and South along Prospect to 65th Street. So the area was recognized as early as 1925 as an area with strong potential for development.
1963
Figure 3. Figure Ground of area in 1963, information taken from historicaerials.com
By the time the Great Depression struck most of the parcels had been filled out in the blocks shown, the rest were built in the building boom following WWII and are found mostly along Brooklyn. More commercial buildings had been built since 1925 like the one at the northwest corner of 63rd and Prospect. A couple larger buildings had sprung as well, based on typology, most likely commercial or office buildings built post- World War II. This was right around the same time that the Blue Hills Golf Club decided to move to a different location, which opened up an opportunity for development in the area. Just south of the map, what would become the Research Hospital and Medical Center had opened its 521-bed hospital at Meyer and Prospect. The hospital would become a major job center for KCMO and hopefully lead the continued development of the area.
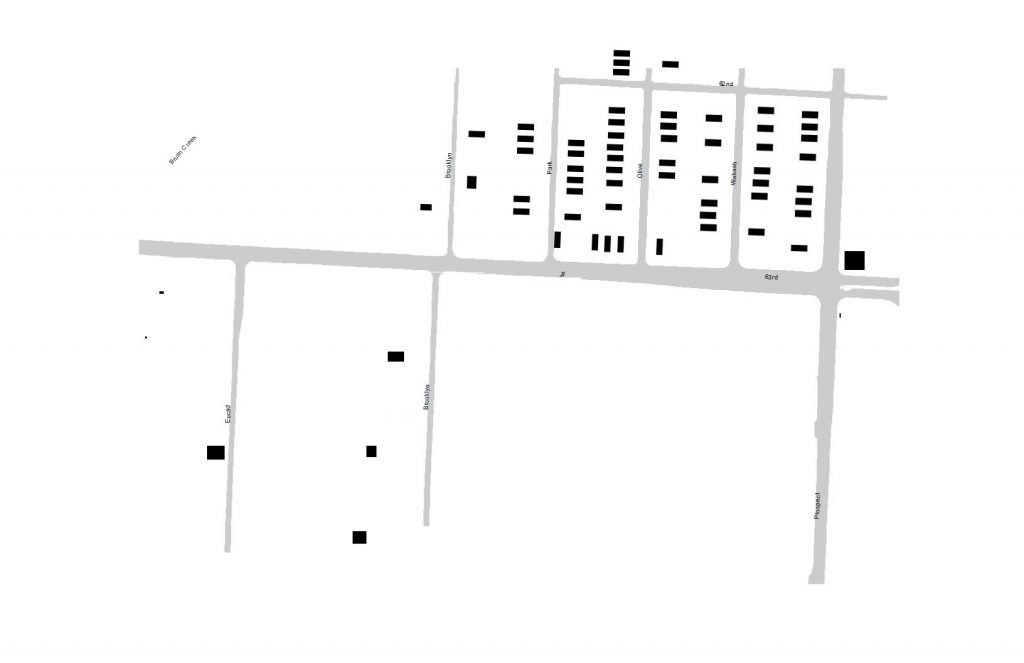
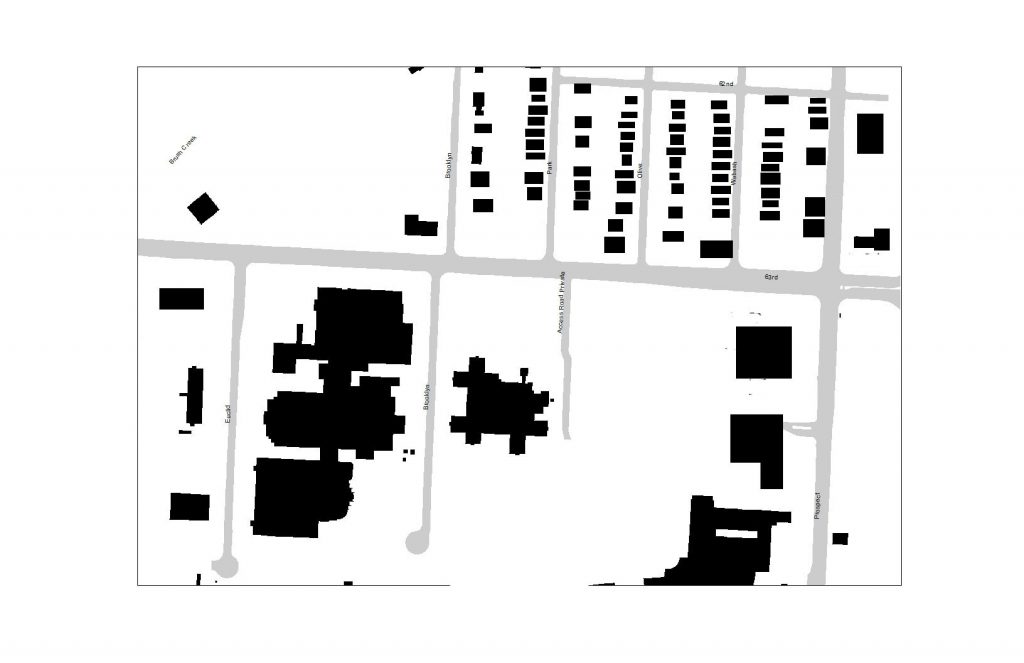
1990
Figure 4. Figure Ground showing area in 1990, information and aerial taken from Google Earth.
1963 showed the extent to which there would be residential development in the area, but the 1990 figure-ground shows the magnitude of the Research Hospital and Medical Center mentioned in 1963. By 1990, the area had seen development of seemingly all land uses except residential. The commercial buildings at almost all corners of 63rd and Prospect had continued to stay and as you move west down 63rd development had been rampant. This starts with a new psychiatric research center apart from the expanding hospital complex and medical center. To the west of this is the AT&T Data Center that also increases job employment in the area. At the edge of the image are two buildings that may have been commercial but today are either gone or have changed land use. The long and narrow building facing Euclid Avenue at the edge of the figure is most likely in 1990 as it is today, the Victoria arms apartments. South of where the golf course used to be and just north of 63rd by Euclid, sits a Metro Patrol Division station that was built in 1977 and was demolished in 2010.
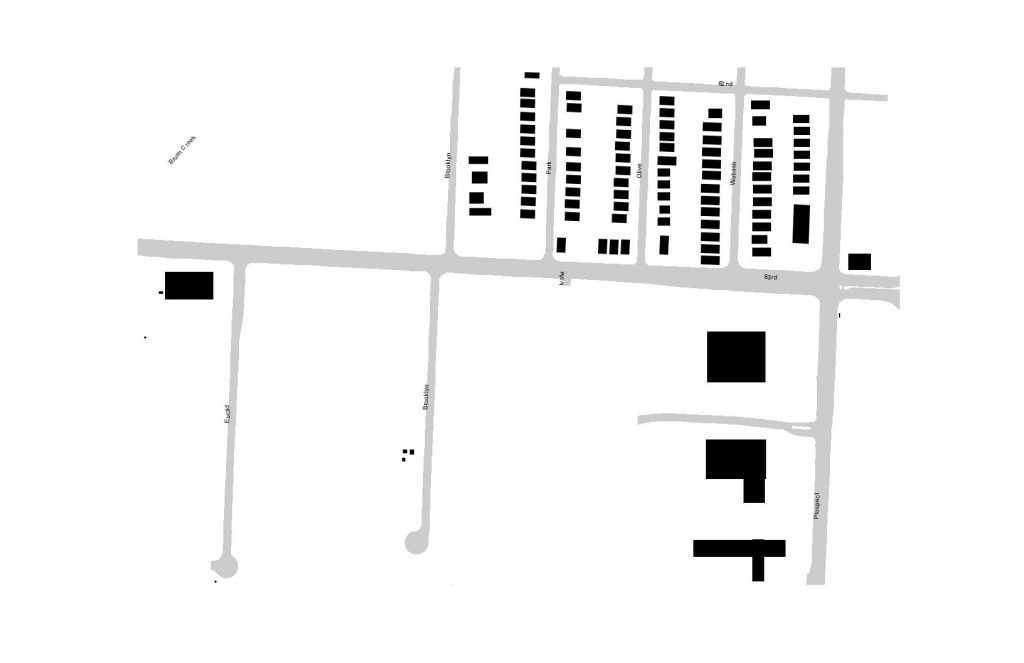
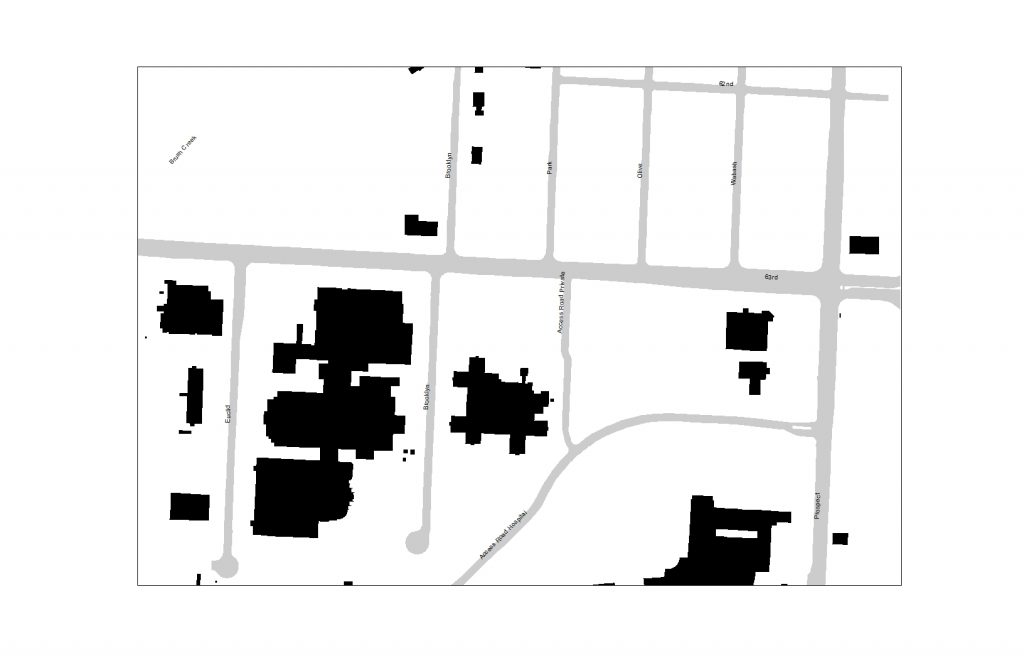
2019
Figure 5. Figure Ground of the area, information taken from KCMO Parcel Viewer.
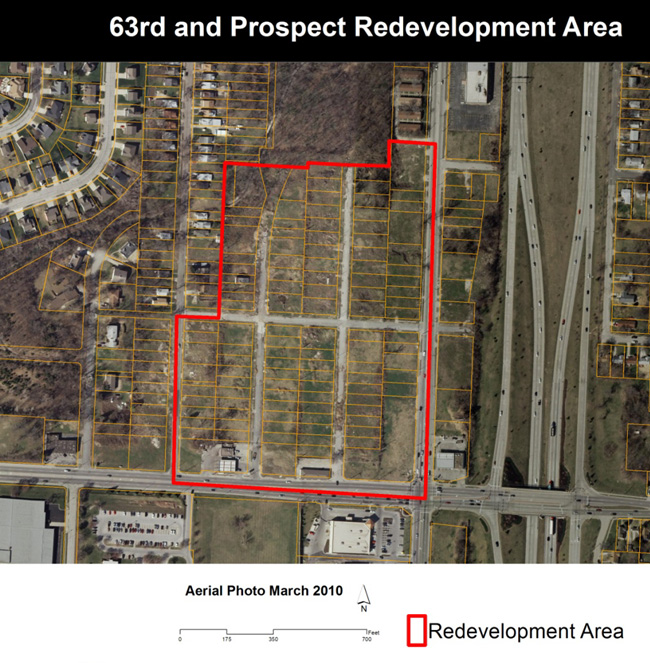
In the last 20 years, this section of the 63rd street corridor has experienced quite a change. In 2005, a 12-year long effort by the Native Sons and Daughters of Kansas City to establish a park at the burial site of Daniel Boone Morgan came to fruition. The park is 14. 64 acres and acts as a great spot for lunch as well as honoring the past (https://kcparks.org/places/daniel-morgan-boone-park/). One of the most visible changes, however, is one of much devastation that started with the area of 63rd and Prospect’s determination of blight and the subsequent Health Midwest Partnership for Change plan tax increment financing project that includes the 63rd and Prospect redevelopment area, as well as adjacent areas (Karash, 2002).
In 2003, the Community Development Corporation of Kansas City, or CDC-KC, a non-profit, made and implemented a plan for the TIF and redevelopment area along with the Land Use and Development Plan adopted for the 63rd street corridor in 2002. The plan was going to cost $103 million and included 250,000 square feet of retail space and over 300 new housing units. The CDC-KC was granted money through federal funds to buy up and demolish all of the older homes for the redevelopment project titled: Citadel Plaza. The demolition of about 140 homes all built before the 1970’s took about three years until the summer of 2006 when concerns about asbestos contamination halted the demolition (Dillon and Horsley, 2006). No asbestos inspections had taken place before the demolition of the homes, as well nothing happened to contain the asbestos. As the demolition process went on, there were also many occurrences of illegal dumping (at one point upwards of 20 truckloads). In August of 2006, the health department of Kansas City confirmed that samples of the area tested positive for asbestos, both above and below ground (Dillon, 2006). After state and federal lawsuits, the city finally reached a settlement in 2012 and clean up started in early 2014. In 2015, the cleanup was completed and in 2016, the city started, like it did in 2014, to market the area to developers and hoped for bids to redevelop the site. This included a redevelopment plan from DRAW Architecture firm.
This area of the 63rd street corridor is significant in both historical and contemporary terms. It is an important node of institutional and transportation activity. The potential for the area is through the roof as well as its impacts on the rest of the corridors (63rd Street and Prospect Avenue) as it continues to evolve.
References
Karash, Julius. “Prospects along 63rd -Development project adds $1 million in – federal funds.” Kansas City Star, 23 January 2002. Accessed 10 February 2019.
Dillon, Karen and Horsley Lynn. “Asbestos concern delays project – KC officials halt work on Citadel Plaza so that inspectors can examine health issues.” Kansas City Star, 14 June 2006. Accessed 10 February 2019.
Dillon, Karen. “Anatomy of an urban hazard – Asbestos now permeates rubble near 63rd and Prospect. City could have prevented the situation by following its own ordinances.” Kansas City Star, 8 August 2006. Accessed 10 February 2019
Horsley, Lynn. “Kansas City trying again after troubled path to development for 63rd and Prospect.” Kansas City Star, 22 September 2016. Accessed 10 February 2019
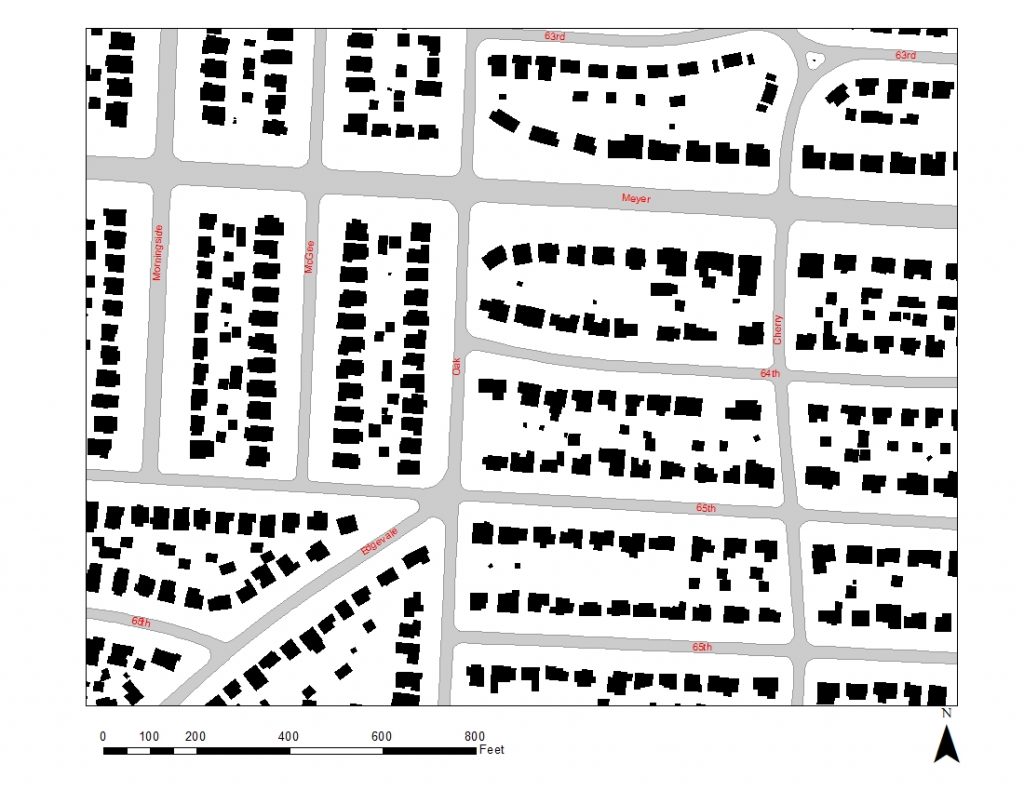
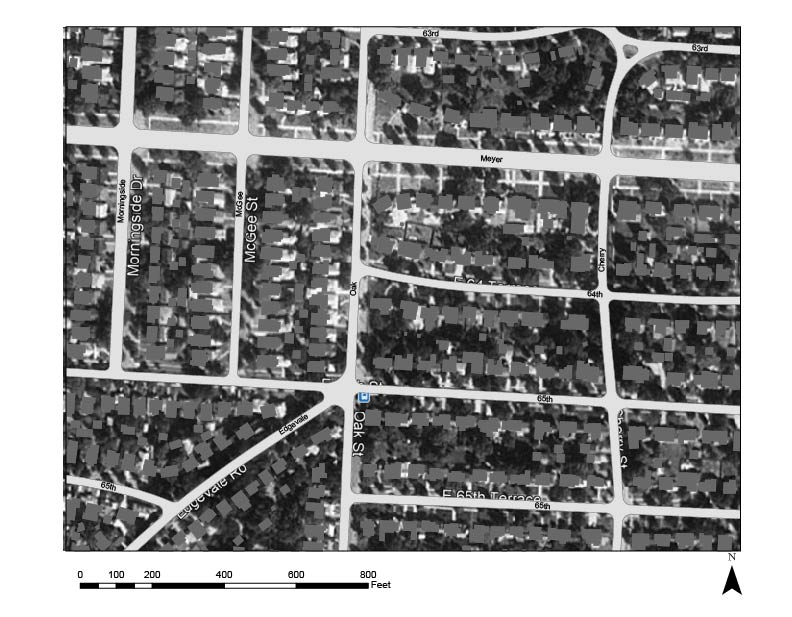
The area of land around Oak Street between Morningside and Cherry has remained relatively unchanged in the last 60 years. When we look back to the 1920’s, however, we can see a significant difference in the density of housing and retail buildings. Today, this area is mostly comprised of larger, single family homes and a few smaller retail businesses. There are lots of trees that offer considerable shade.
Figure 1. Present day (2019) figure ground diagram of Oak Street, between Morningside and Cherry.
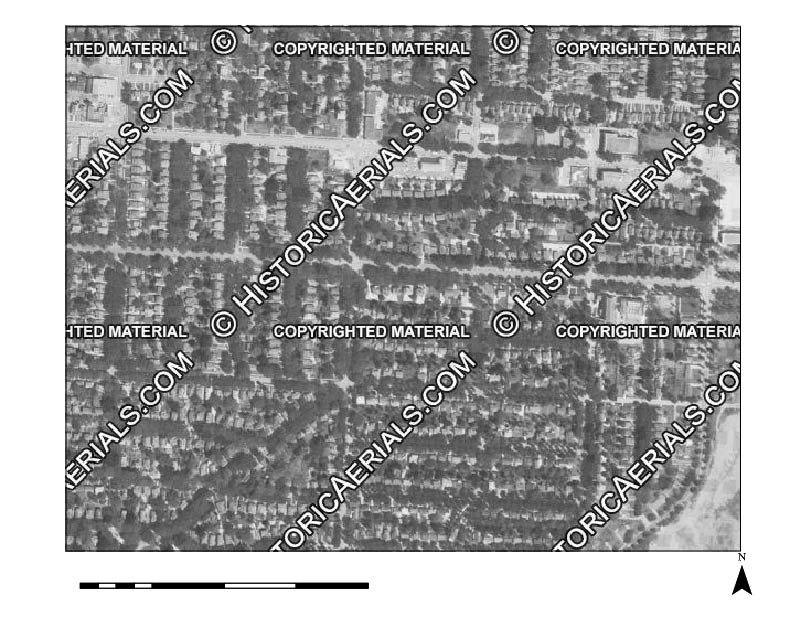
1991
There seems to be little or no change in this area since 1991.
Figure 2. 1991 aerial photo with figure ground diagram overlay
1963
Again, we see that in 1963, this particular neighborhood, existed relatively the same as it does today in terms of the buildings and street layout.
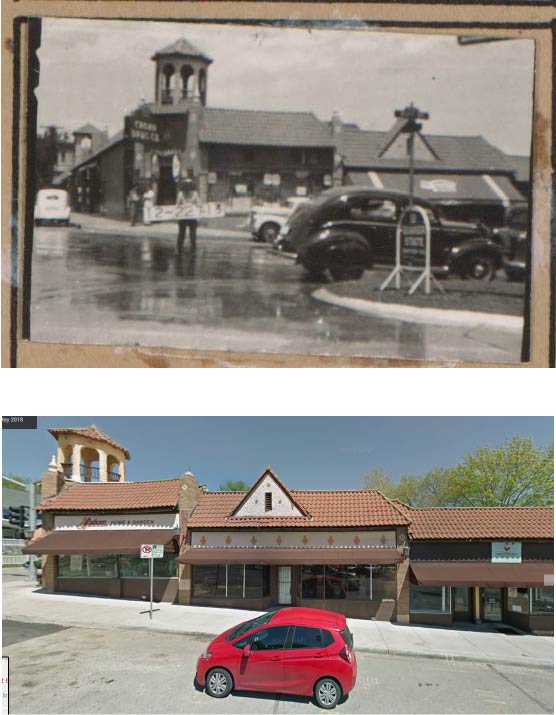
Several houses and small business remain almost exactly today as they were in 1940, according to the 1940 tax assessor photographs.
Figure 4. Brookside shops, at Oak and 63rd St.
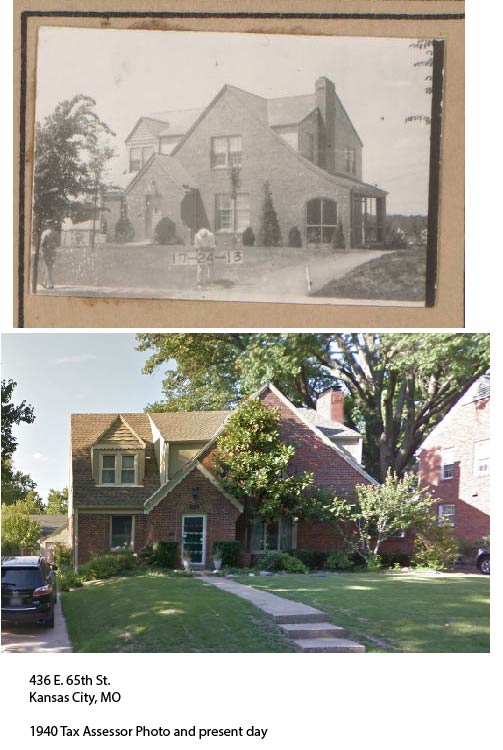
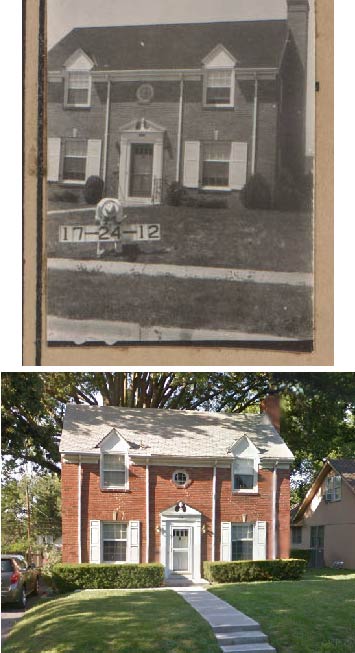
1940 Residences
Figure 5.Figure 6 . 440 E. 65th St. 1940 Tax Assessor photo and present day
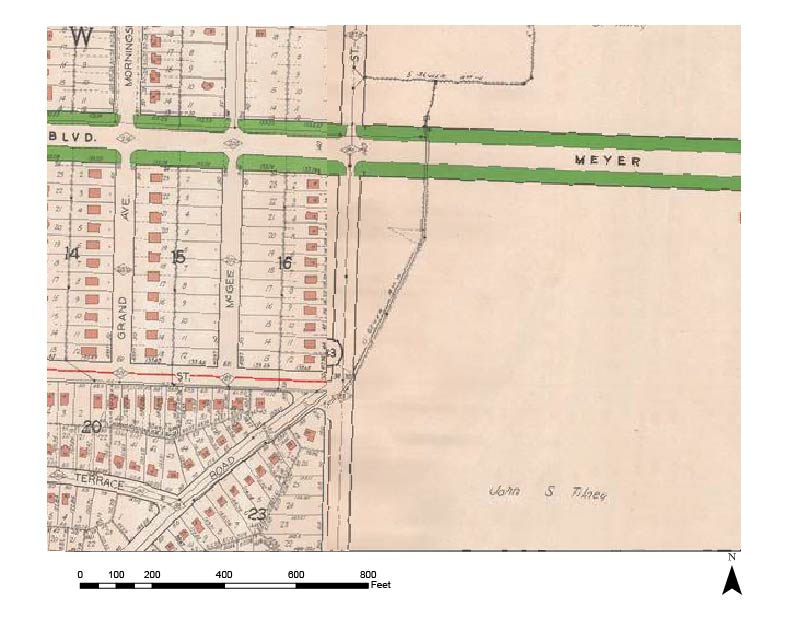
1925
When we look back to the year 1925, however, we can see significant changes in the landscape and development. The area east of Oak Street was largely wide-open, undeveloped space owned by a Mr. John S. Tilney. There were no housing units on either side of McGee Street. It is noteworthy to mention that in 1925, the section of Morningside Street between Meyer Blvd and 65th St. was named Grand Ave.