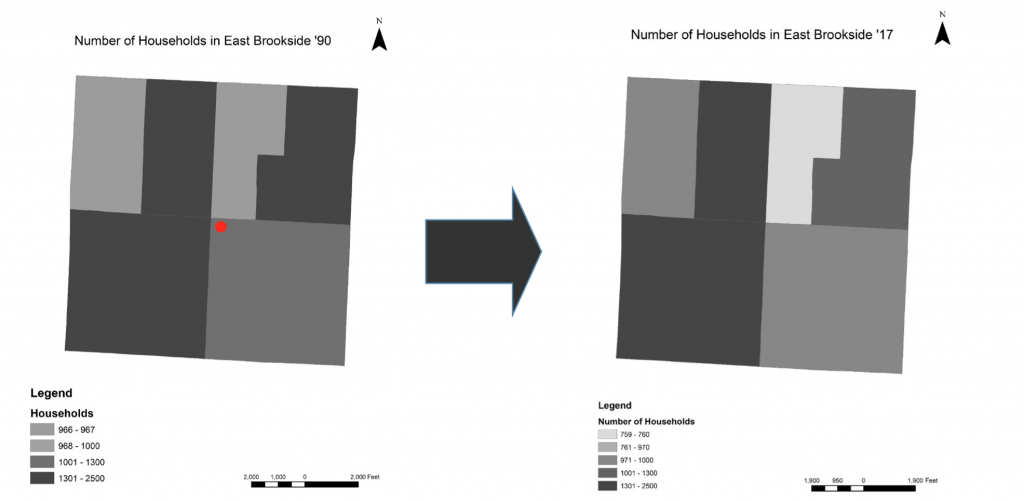
Looking at the data from KC and the surrounding tracts of the Landing has led to a few findings of Household, Family type, and families. In all, the tracts we see a steady decline in households, about 8% since 1990.
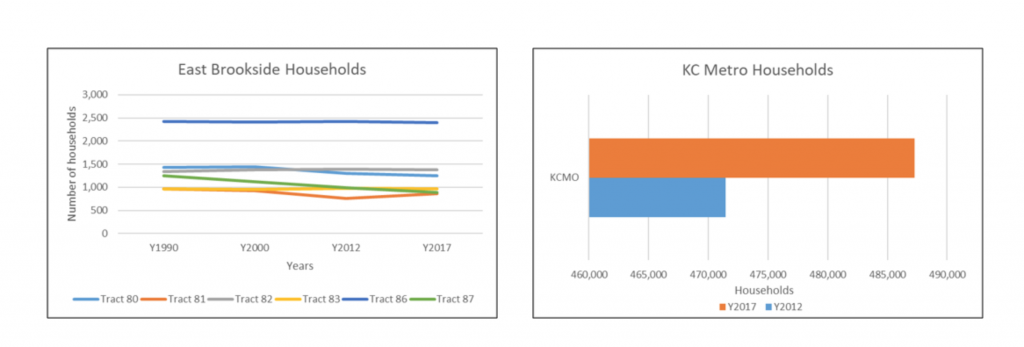
This is in contrast with KC (see above bar graph) which has had a net increase of households. One tract, 87, has had over a 29% decline. This means that there are less people net in the area along with the placid increase of new homes.
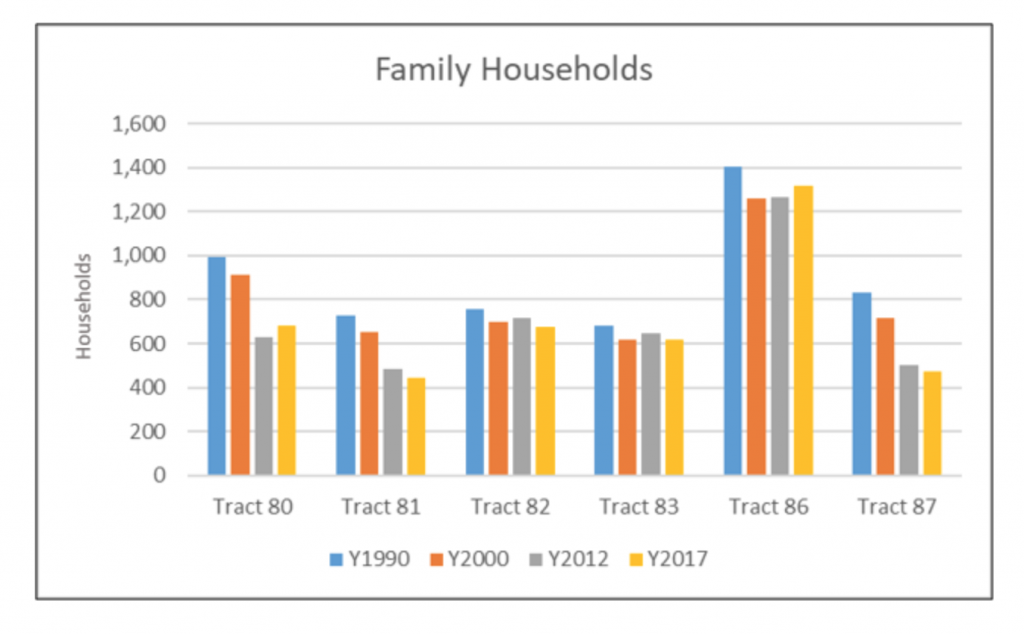
The second category was families. This group is in major decline, seeing a negative drop of 23% along with married families and other families down 20% and 36%, respectively. KC, for comparison, have had an increase of over 1%. This could mean that there are more single people, or less couples having children or getting married.
Non family households was interesting, having almost a double increase in each category (nonfamily, Male and Female Households). This proves the thery that there are more single people or non-married families moving in. This could be because of the low income or lack or oppritunities.