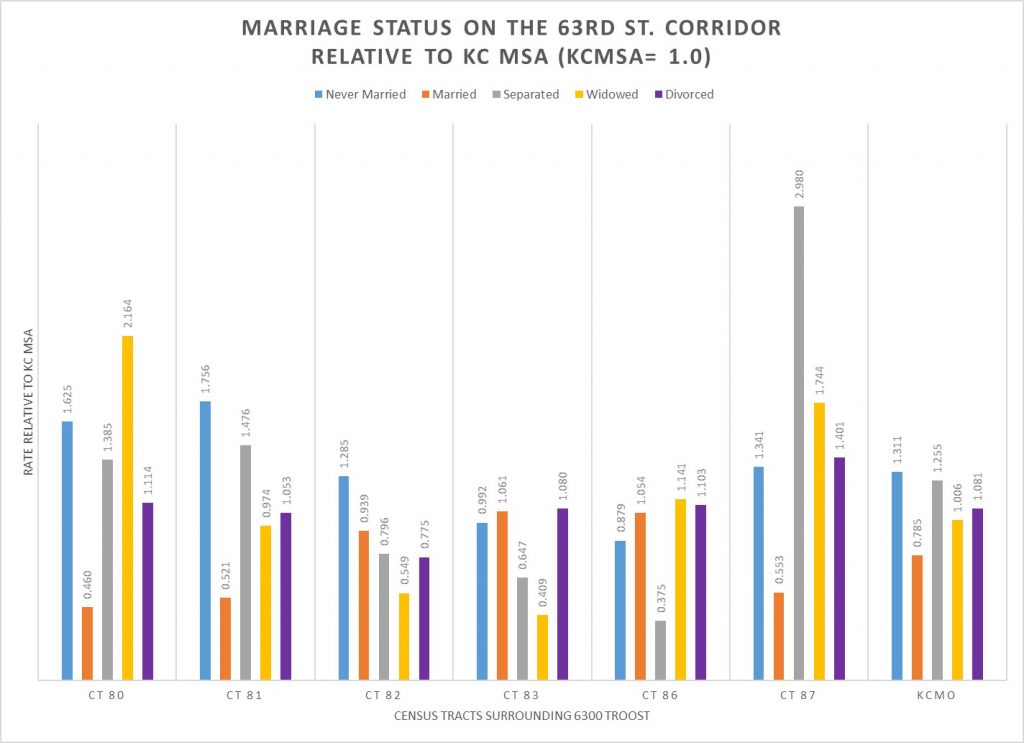
Is there geographic variation in the marital status of the population in Kansas City? Yes, this graph shows that marital status varies across the census tracts surrounding the Landing Site on the 63rd Street Corridor. Census tracts 80, 81 and 87 all have a lower rate of marriage than both the City of Kansas City and a much lower rate of marriage than the Kansas City Metropolitan Area. Perhaps the most surprising data are the high rates of marital separation and widowhood in tracts 80 and 87. Note that the marriage rate in Kansas City is substantially less than the rate in the Kansas City Metropolitan Area.
How do you read the data in the chart? All of the data are from the US Census American Community Survey 5 year tabulation of data from 2013 to 2017. Data on the number of poeple age 15 and older by marital status were downloaded from the Census site. Then rates were calculated by comparing the proportion in the tract and in Kansas City, MO to the rate for the Kansas City Metropolitan Area. The rates for the KC MSA are equal to 1. The indexed marriage rate of .460 for Census Tract 80 means that the rate in that census tract is 46% of the KC MSA rate. This means that the number of married people in this tract is less than half what you would expect applying the metro wide average. The 2.164 rate of widowhood in Census Tract 80 means that there are 216.4% more widows in this tract.