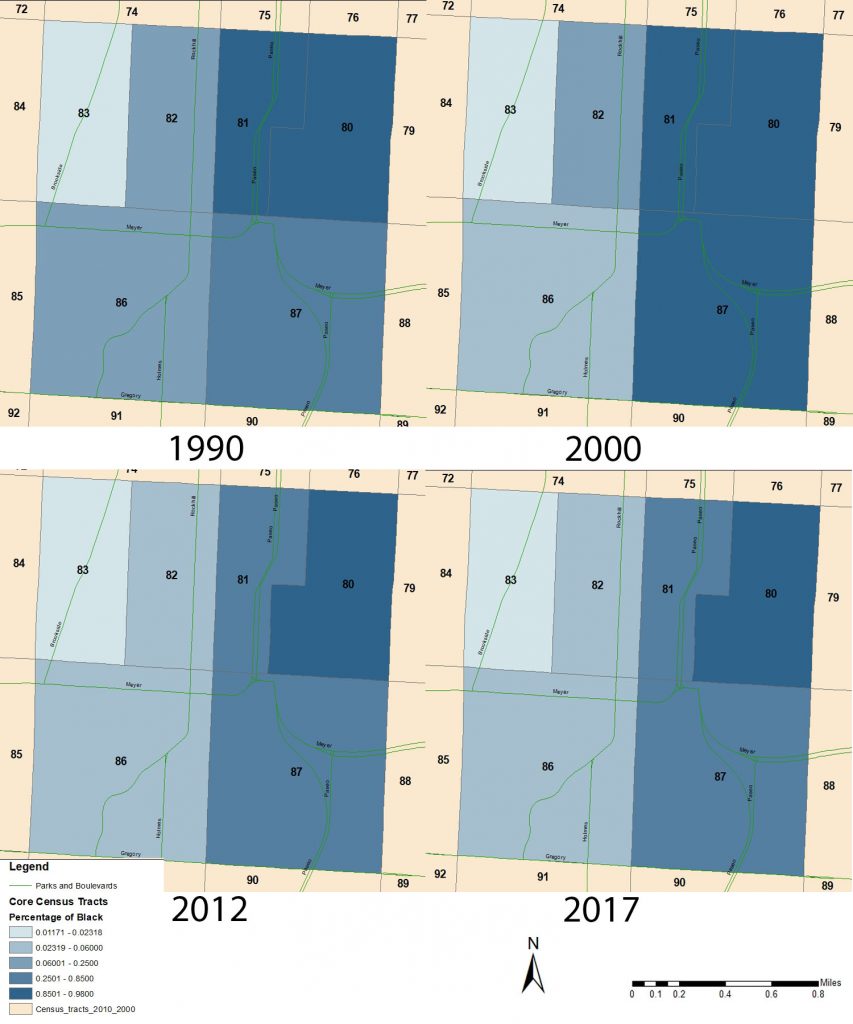
Figure 1 paints two stories that are intertwined with the redevelopment of 63rd and Troost. The first is that of the geographical location of race in the specific study area as well as in Kansas City, MO as a whole. The racial distribution can be easily described as a function of Troost Avenue, which seems like a center dividing line across all four maps. Keeping the breakpoints consistent for each map, we are able to see that over the course of the last 30 years, little has changed in terms of east and west across Troost. All three census tracts west of Troost have consistently stayed below 25% in terms of the black population, in contrast, the percentages of the white population has stayed over 75%. Just a couple blocks over on the east side of Troost, the three census tracts have stayed over 70% black for at least the past 30 years. Since 2000, the percentage of the black population in these three eastern tracts has seen a bit of decrease. This decline in the black population can possibly be attributed to two things: the migration of the black middle class out of the inner city; and the trickling in of white alone, back across Troost. From the year 2000 to 2017, the census tracts east of Troost saw a 123% increase in the white alone population, even though the percentage of the black population still stays strong.

The graph above does a good job of breaking down the race in the study area into two distinct categories based on geography. It further emulates the racial separation of across Troost Ave. A notable difference between 1990 and 2000 is the emergence of a new racial classification, two or more races. The result of this it seems has more impact on the census tracts west of Troost rather than east. Also, the only races predominantly found on the east side of Troost are black alone and American Indian alone.
Figure 3 shows the concentration of residents that identify as Hispanic in the area surrounding the Landing. Census tract 86, has by far the larger Hispanic population. Most of this census tract is single-family residential homes under the Oak Meyer Gardens neighborhood association. Figure 4 clarifies a couple of things, like that even though there is a larger Hispanic population in tract 86, the proportion of Hispanic in the tract is still just over 8%. As well, the census tract 86 is closer demographically to Kansas City and its Metro area, than compared to any other census tract being studied.

After examining this data, it becomes apparent that this specific census tract contains characteristics that attract the normal size Hispanic population. This could be the jobs directly available like the nearby medical center, or the housing stock and pricing available.
The final demographic data that I will be analyzing is Tenure by Race. Figure 5 focuses on black alone population and the pie charts show the proportion of black householder housing units that are owner-occupied or renter occupied. Going back to the point made earlier about racial separation across Troost, this data follows the same pattern. In most of the census tracts except for tract 87, the majority of black households are owners instead of renters. Even though the black population in census tracts west of Troost, especially in 83, are below 30%, the majority are still owners and have an investment in the area. It is reasonable to state that homeownership is a form of investing and stakeholding in a given area, so in areas with higher ownership rates may show a higher rate of investment. On the other hand, high rates of ownership or rentership may be due to the pricing of housing in the census tract: a higher cost for housing may lead to higher rentership. Furthermore, ownership rates may be telling of the housing stock available and whether is worthwhile to invest.
Figure 6. Map showing the Tenure by race, specifically the white population. Yellow represents the percent of housing units with a white householder that is owner-occupied. Orange represents the percent of housing units with a white householder that is renter occupied. Data were taken from American Fact Finder, ACS 2012-2017 Data.
In figure 6, the race distinction is much more prominent geographically than in figure 6. The majority of white households west of Troost are owner-occupied when compared to figure 5, this may just mean that there are not all that many housing units occupied by renters west of Troost, to begin with. In the census tracts east of Troost, white households are almost exclusively white, which is the case in census tract 80. This may be because white households do not want to invest in the housing stock here, but at the same time, the lower number of whites that do live east of Troost may only be able to afford to rent the housing units over ownership.