Category Archives: Analysis

How do the Districts and Neighborhood s surrounding UMKC affect the development of Campus ? : Existing Conditions Analysis

By: Maryam Oyebamiji

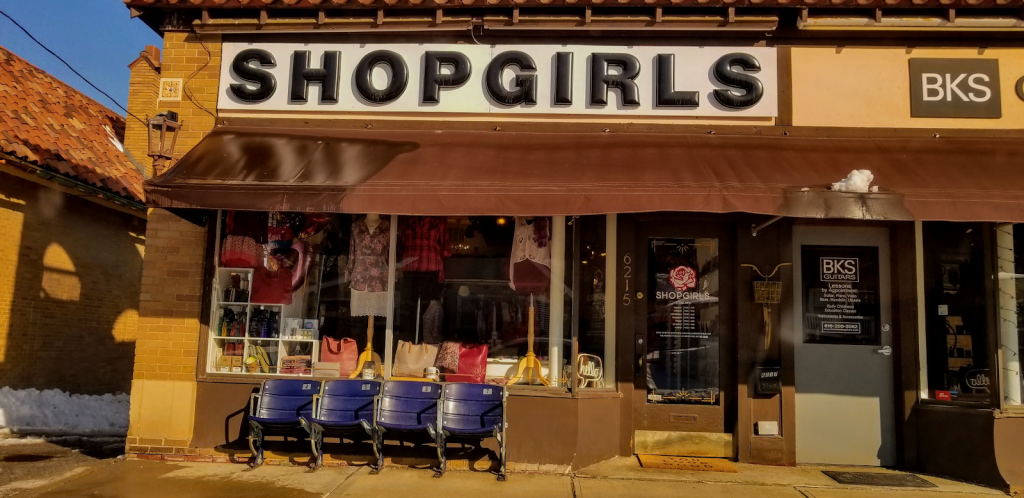
The University of Missouri-Kansas City (UMKC) is located in a diverse urban environment with a variety of neighborhoods and districts surrounding it. The development of campus is certainly influenced by the surrounding districts and neighborhoods, and vice versa.

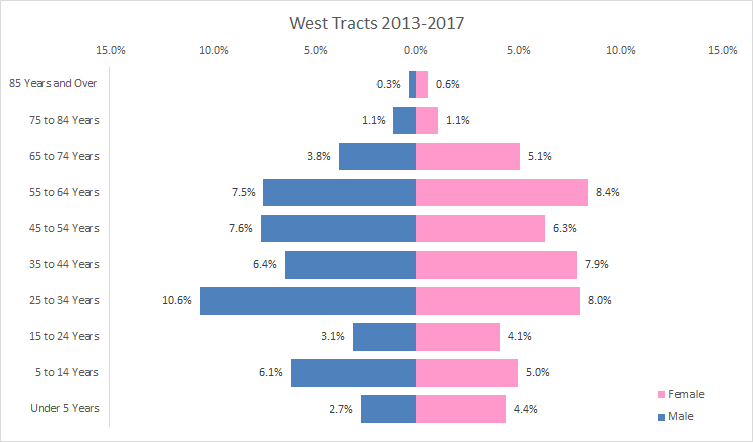
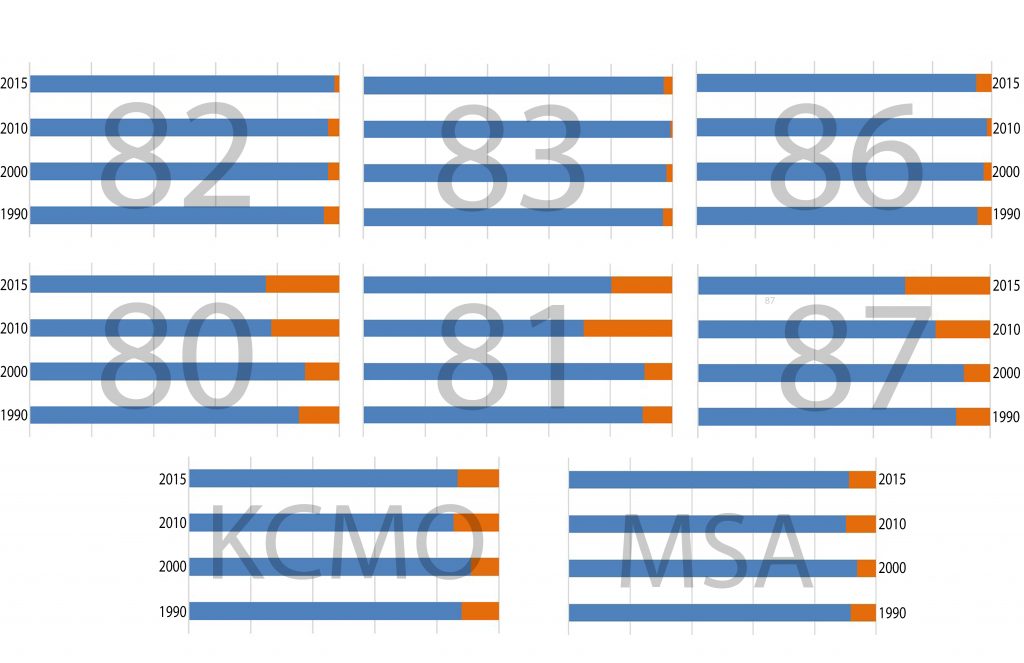
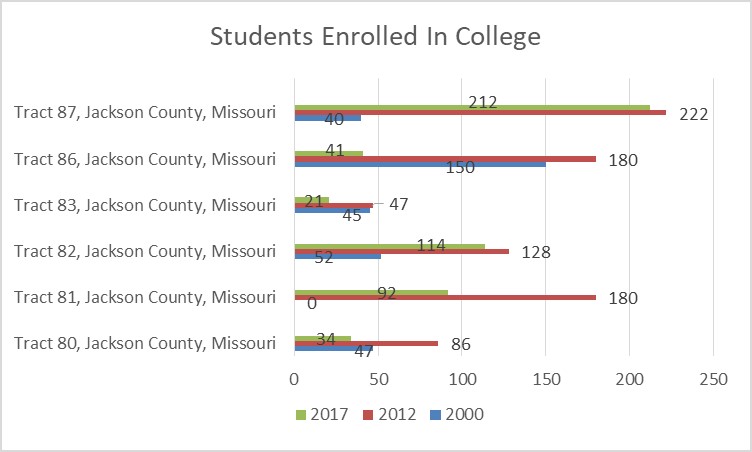
One way in which the surrounding neighborhoods affect the development of campus is through their demographics and socioeconomic status. UMKC has a diverse student body, and the surrounding neighborhoods can provide opportunities for students to connect with different cultures and backgrounds. However, if the surrounding neighborhoods are economically disadvantaged, it may be more difficult to attract students and faculty to the area.

Additionally, the safety and security of the surrounding neighborhoods can have an impact on the development of campus. If the neighborhoods are perceived as unsafe, it may be more difficult to attract students and faculty to the area, and the university may need to invest in additional security measures.

On the other hand, the development of campus can also have an impact on the surrounding neighborhoods. UMKC has made efforts to partner with nearby neighborhoods to promote economic development, improve infrastructure, and enhance community engagement. The university has also played a role in revitalizing the surrounding area, such as through the creation of the UMKC Innovation Center and the redevelopment of the historic Brookside neighborhood.

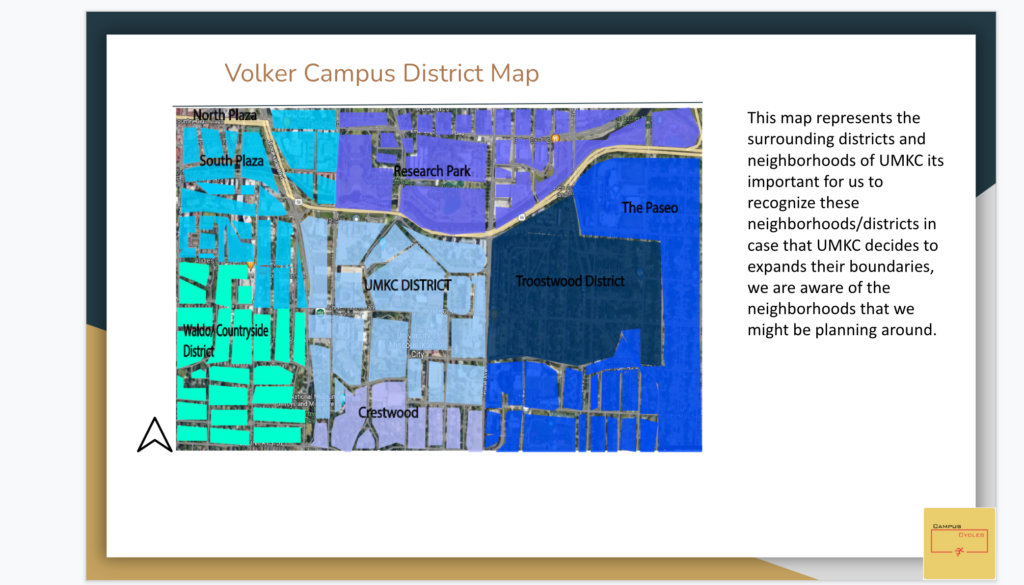
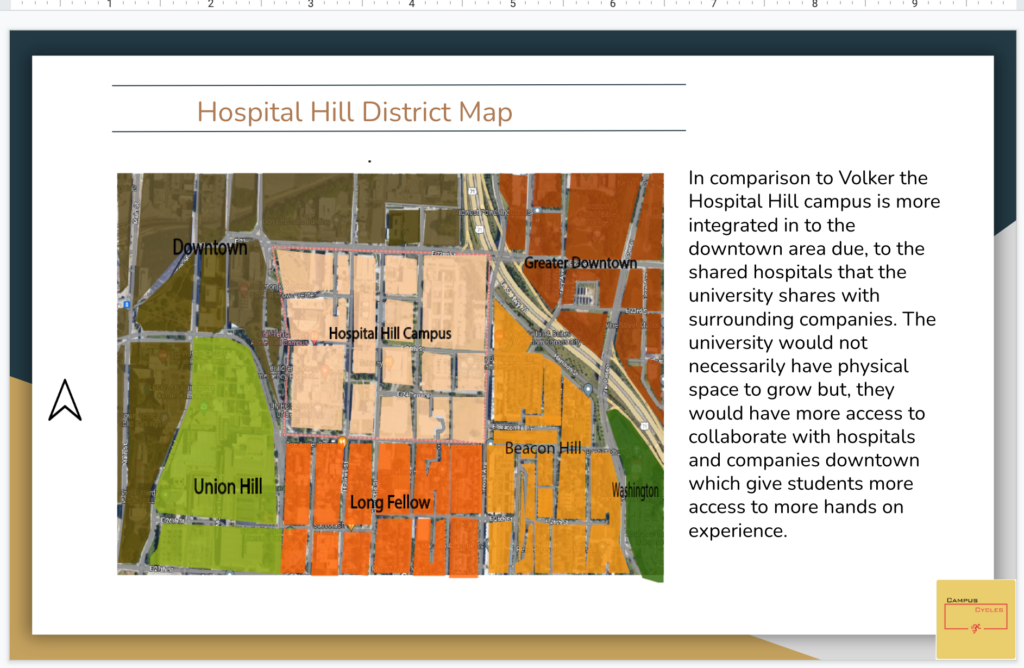
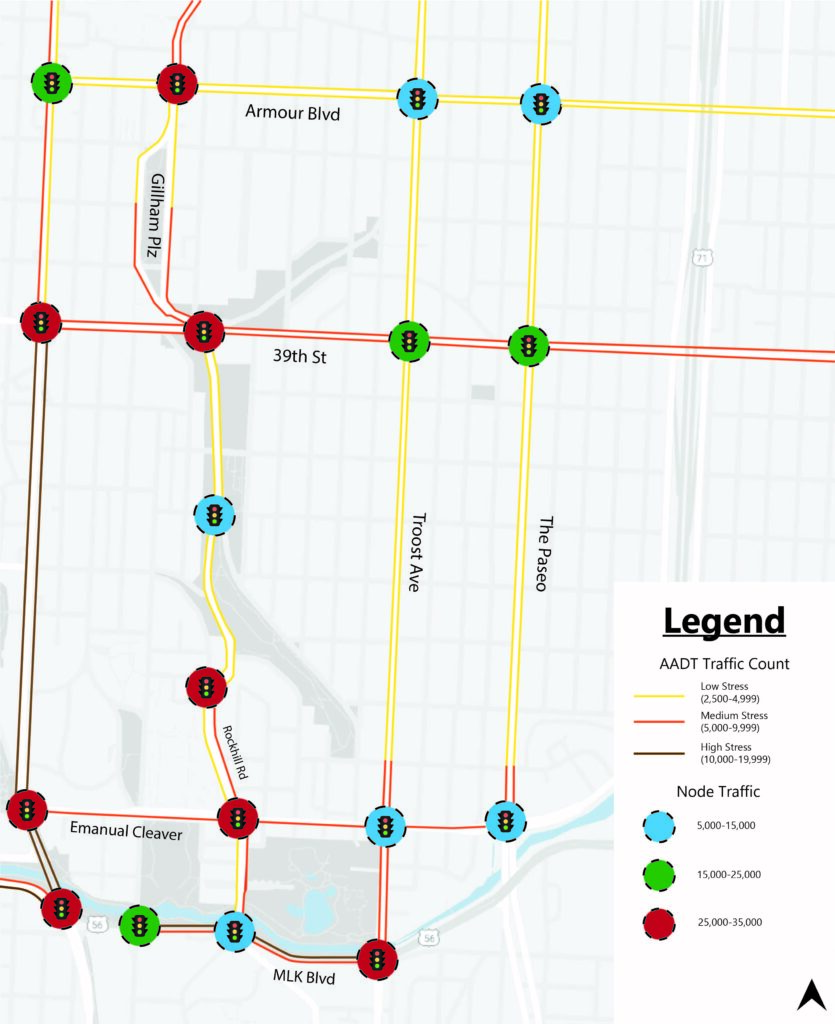
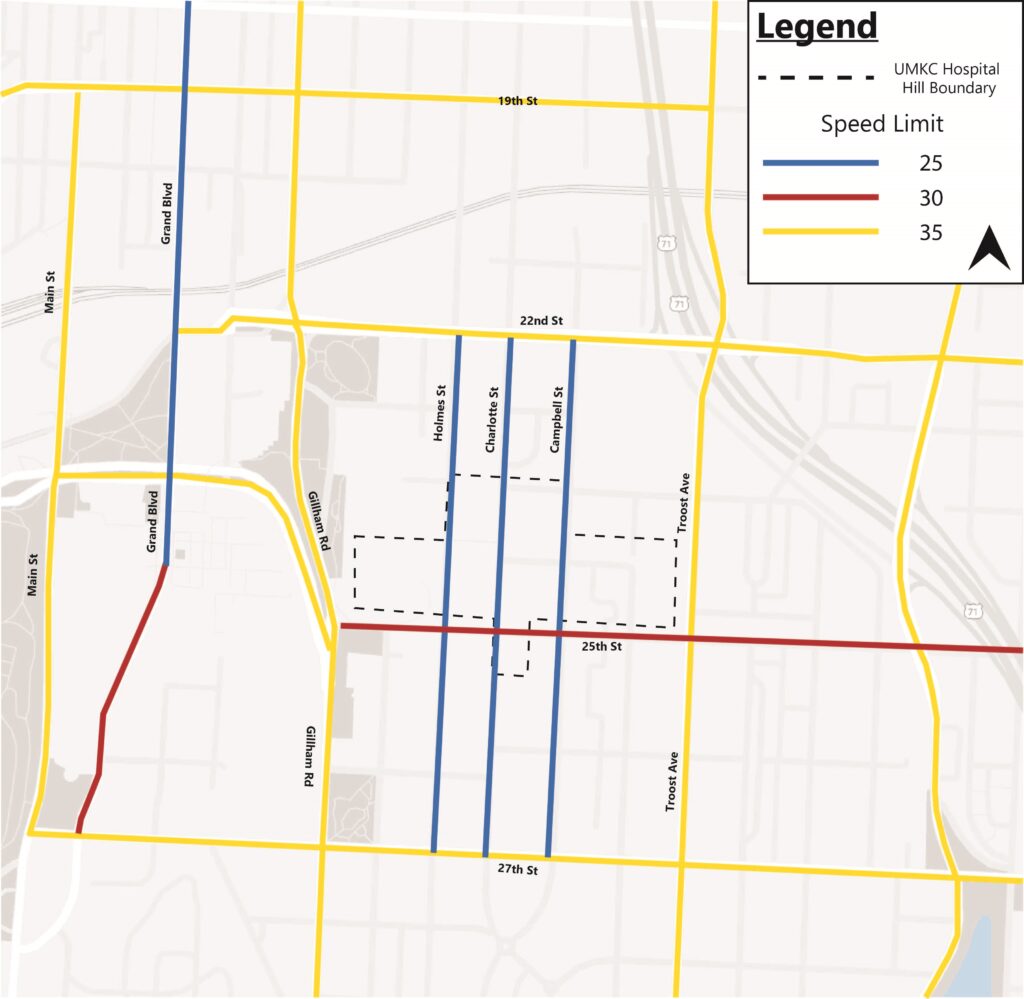
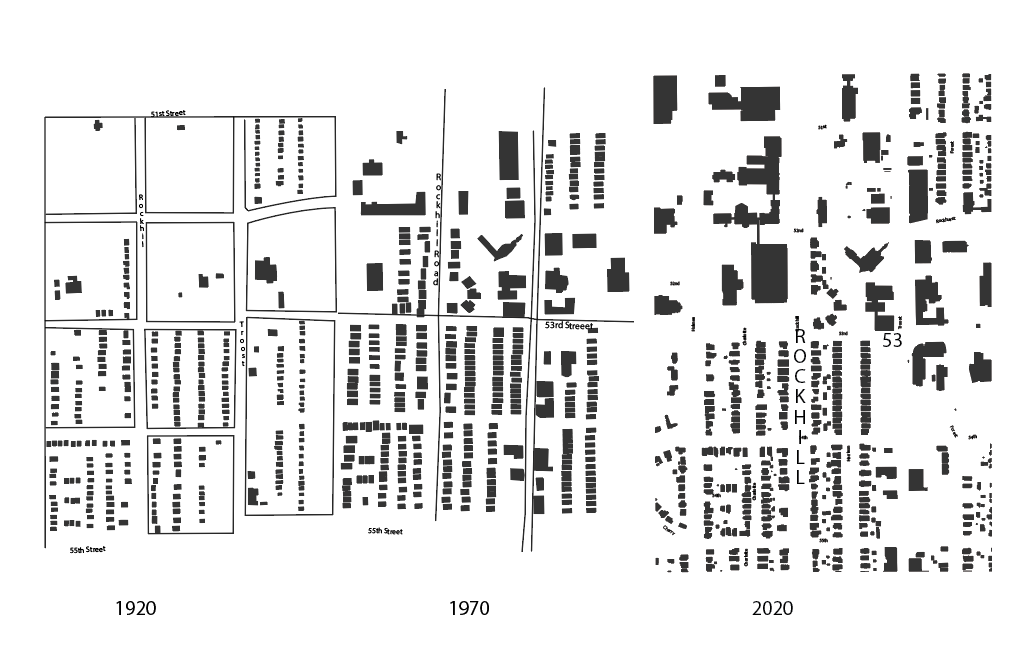
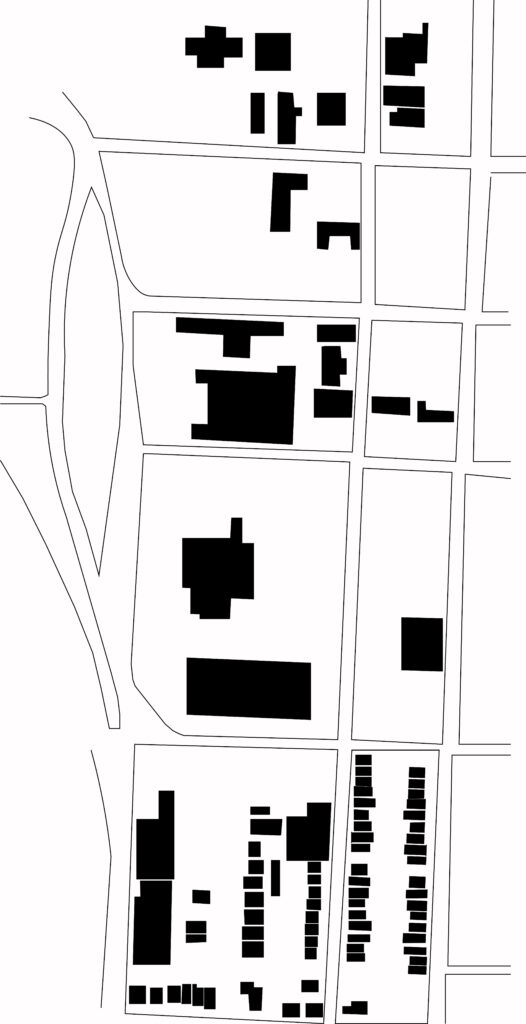
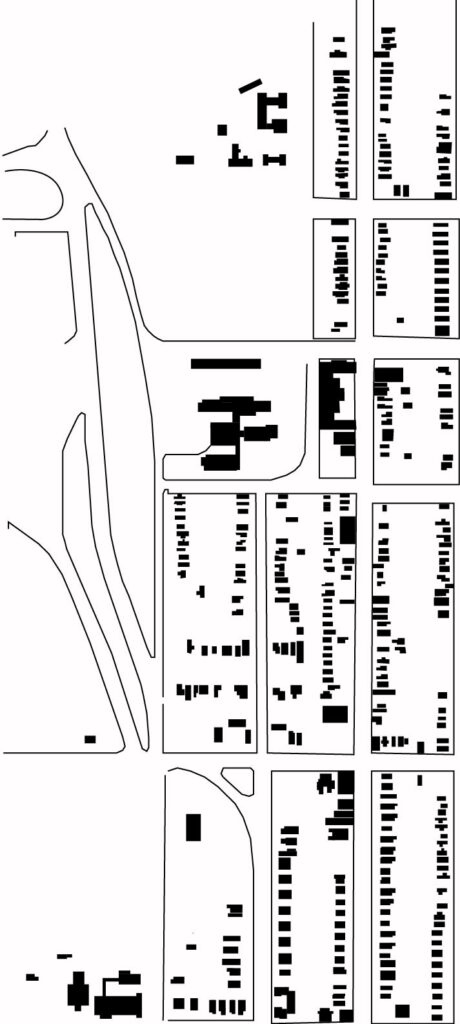
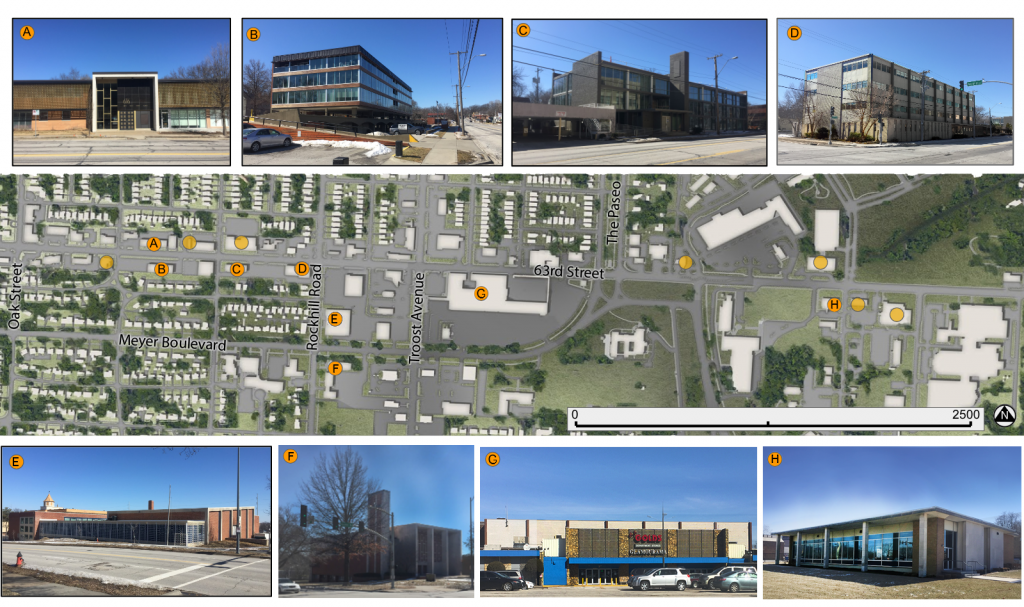
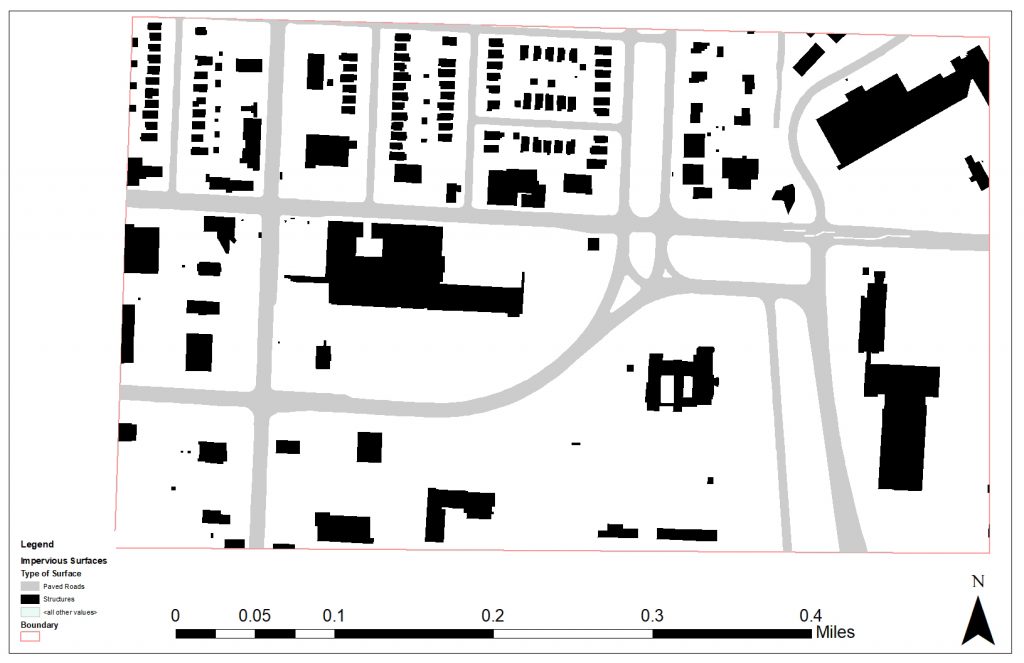
In this Existing analysis project I made two district maps. One for Volker Campus and one for the Hospital Hill Campus.

Existing Conditions Analysis

My contribution to the analysis was transportation mostly focusing on the Hospital Hill Campus and the area directly south that connects to the Volker Campus.

The transportation team was responsible for representing traffic counts, directional turning traffic, pedestrian traffic, speed limits, and bus routes.

This map indicates the values of vehicles that are turning north, south, east, and west at major intersections from 19th St to Linwood Blvd. We found the majority of traffic is circling around the hospital hill campus because 31st St and Linwood Ave are carrying traffic from highway 71, and Main St is a connecting through Kansas City from Downtown to the Volker Campus. The main point of entries into Hospital Hill are south of 22nd St at Gillham Rd and Troost Ave.

This maps represents the average daily traffic, and the total number of vehicles that entered the intersection throughout a 12 hour period. The roads that mold hospital Hill, Troost Ave and Gillham Rd, show lower than predicted stressed streets. As shown above in the directional traffic map, 31st and Linwood are the most traffic traveled streets with a stress level of 10,000 to 19,999 cars per day.

Below is the map of connecting roads between Hospital Hill and Volker Campus. The level of stress on major roads such as Troost Ave and Main St changes as you pass Emanuel Cleaver Blvd. Another east and west street, MLK Blvd, is a high stress street that connects to highway 71 located east of campus. The stress level of these streets indicates that many students commute to campus via the highway system instead of intercity roads.

We also gathered the various speed limits around both campuses. I found that within Hospital Hill, the speed limit stays at 25 mph on Holmes St, Charlotte St, and Campbell St. The highest street that cuts through campus is 25th St where it rises to 30 mph. In addition, Grand Blvd is 25 mph because of Crown Center and it changes to 30 mph as you exit that area. All other roads in the surrounding area are 35 mph.

I produced sections and plan view of two different intersections of Troost Ave. The first intersection is at 27th and Troost which is directly in front of the Hospital Hill dorms, and the second is located at 51st and Troost on the bottom right corner of campus. We wanted to highlight the differences in infrastructure for pedestrians and cars. The first intersection has a median, a well defined painted area for pedestrians to cross, and on street parking to slow traffic down. The second intersection is a five lane street including a turn lane, and has a crosswalk indicated by only two white lines.

Figure Ground Analysis

The studied area is from 51st to the North to 55th in the South. And from Holmes on the Eastside to Forest on the West. The area was mostly made up of residential living space, and that continues to this day. Although the two universities have made growth, they have also experienced set backs. The universities acquired some of the residential homes, and the community responded by feeling threatened of change in their neighborhoods. There might be something to the student ‘lifestyle’ that most neighborhood communities don’t want to put up with, as well.

We see a lot of residential growth in between 1925 and 1970. And it seems built-up fairly equally with the universities growth. We also see the commercial area on Troost gain is size. And the Church at 52nd and Troost is finally built. What stood before that, was a parish school. From 1970 to 2020, we see that some of the single-family housing is bought and razed by the school to create, a parking garage at 53rd and Rockhill. For the most part the housing is still in tact from its original placement prior to the 1925 Sanborn Maps. The biggest loss in housing seems to be the homes on the west end of Troost between 53rd and 54th. There is plans for that area to become student housing in the new Master Plan.

I think that this area was late to develop and by the time it did develop, cars had already become a popular mode of transportation. And it is worth noting that Troost used to be a streetcar road. But that could not withstand the transfer to the automobile. This transformation is furthered by the construction of not one, but multiple parking garages being built between the 1970’s and the 2020’s; there is the one mentioned at Rockhill and 53rd, but also the Rockhurst garage at Troost and 51st, and the Stowers Research Institute garage at Troost and 50th. This confederation of parking is unorganized and is exclusive to each group. It seems that the universities did not help make the area more walkable either. Even though when we think of universities there is a walkability/connectivity to the image of a campus. The progression of UMKC becoming a commuter school seems only natural. As the area was developed mostly in the context of the car, none of the single family residential has been up-zoned and roads and parking have been updated for more use. While walkways and bike paths seem out of character for this area now. And little has been done between the universities or its neighbors, even in between the city and the universities, to create walkways that work for the area.

Historical Analysis

In 1925, the neighborhood clearly used to be single family homes with some buildings that occupied roughly two to three units. There were two separate hospitals which were labeled as “General Hospital” and “Colored Hospital” which is located just north of the large complex. These hospitals that were not nearly as large as the one seen in 2020, and the city blocks were uniform to each other. During the last century, we can see some development starting to take shape for the hospital and school that occupies the space in the present day. The southwest edge of the map used to be occupied by single-family homes, small businesses, a small variety of multifamily homes. While there are some homes that are still standing today, most of them have been replaced for the University of Missouri-Kansas City to build an additional campus that houses the school of dentistry, the school of nursing, and the school of pharmacy. In addition to the campus, Children’s Mercy Hospital is located adjacently with plenty of parking structures scattered through Holmes Street and Charlotte Street.

From 1925-2023, the land has changed from a sparse to very dense. The roads have been realigned from standard blocks along 23rd to accommodate the growth of the general hospital that is now the University of Missouri-Kansas City Hospital Hill Campus. The growth of this learning hospital brings along a large parking structure located at the southern border. Directly below 22nd Street, their are several other facilities including the Truman Medical Center and University Health.

Troost Park Existing Conditions: Population and housing

The Troost Park area has seen a trend over the past several decades of a drastic decrease in population. Our detailed study area is home to fewer than 1000 people. Kansas City, MO is experience the complete opposite trend. It has only increased in population since 1990. However, there has been a very recent sign of reinvestment for the Troost Park area. From 2010 to 2018, there has been a small increase in population by about 200 people.

Figure 1. Population around Troost Park from 1950 to 2018. (US Census, ACS 2018)

Housing in the area follows the same pattern. Many units have been demolished since 1950, but there has been a small resurgence in recent years. This is a sign of reinvestment, which almost always bring gentrification. There is no doubt that the Troost Park area requires reinvestment in housing in order to create a vibrant community. We do need to be cautious moving forward, though, to prevent displacement of the existing residents. It is imperative that the existing neighborhood remains in-tact in order for reinvestment to be successful.

Figure 2. Housing Units around Troost Park from 1950 to 2018. (US Census, ACS 2018)

Works Cited
US Census 1950, US Census Bureau
US Census 1960 , US Census Bureau
US Census 1970 , US Census Bureau
US Census 1980 , US Census Bureau
US Census 1990 , US Census Bureau
US Census 2000 , US Census Bureau
US Census 2010 , US Census Bureau
ACS 2018, US Census Bureau

architectural character of the 63rd street corridor

The major architectural character of the 63rd Street Corridor, between Oak and Prospect, has two prominent styles and an interesting sub-style.

The first major style is Spanish Revival. Notable for its mixture of red and buff brick, tiled roofs, towers, and terracotta decoration; this style dates to the 1920’s. While there are relatively few buildings in this style along the corridor, their baroque decoration, interesting color palate, and prominent locations make them stand out among more contemporary structures.

Small Commercial strip in a Spanish Revival style at 63rd and Oak. Note the tower, tiled roof and terracotta accents.
This example is prominently located at the busy corner of 63rd and Troost.
A 3-unit commercial structure on 63rd, between Tracy and The Paseo.
The Convent of Christ the King dates to a later period than many other of the nearby examples (1940) but maintains the hallmarks of the style. It’s tower is visible from many points in the area.
The relative locations of the Spanish Revival buildings

The second major style, and one that dominates the western portion of 63rd Street, is Modernism. Identified by the style’s clean lines, concrete, steel, and glass construction, and lack of ornamentation; these structures can be found in many forms along the corridor. A subsection of these structures feature concrete or metal screens which partially shield the structures from view.

Many of these modernist structures have integrated, structural parking adjacent to their usable space; evidence of their later period of development, well into the motor age.

A low-rise office building with a patterned screen shielding its second floor. Found near Cherry on 63rd Street.
A modernist mid-rise office building is vaulted over its parking garage; which is partially below street-level. Found at Cherry & 63rd.
This structure and the one below are separated by their shared parking structure; seen to the left of this photo.
This example is less dramatic than its neighbors but sits at the prominent corner of Rockhill Road and 63rd. It shares its parking structure with the building in the photo above.
This former school building features a patterned metal screen along the lower portion of its facade on Rockhill Road. The visible structural concrete is another hallmark of modernist design. Found at Meyer Boulevard and Rockhill Road.
This former church, just south of the building above, also features prominent structural concrete in its main facade and tower.
The main entrance of The Landing shopping center still bears marks of modernist design, despite a number of retrofits throughout the years. Visible structural elements and a patterned concrete screen are evidence of its stylistic roots.
This is another example of modernist design in a small structure. This one features a broad rectangular facade of glass shaded by a simple concrete eave and pillars.
Relative locations of the featured modernist buildings along with the sites of others in that style.

A fun subsection of modernism make a few appearances along the corridor in the form of highly stylized small structures with prominent automobile accommodations. These quirky structures bring a lot of mid-century character to the corridor and some have been re-purposed for contemporary uses.

A small, truncated A-Frame structure with matching automobile passage. The glass front of this building also features a patterned screen of concrete circles.
Simple modernist boxes are stacked off-center, leaving an open carport below a portion of the second floor. Just west of Rockhill Road on 63rd.
This former gas station has space-age angles in its awning and sign post. Located at Bushman Drive and 63rd Street.
Locations of the sub-style auto-centric modernist structures.

While there are a number of other architectural styles represented in the corridor, the dominating character is defined by these examples. Any new development in the area should look to complement these existing structures.

All photos and maps by Tom Meyer

relation of business age and population

After completing a full analysis of our study area, there was much knowledge to even begin to display. Looking at the most recent Census data for our six tracts, it is seen that Troost Avenue is still a racial dividing line of Kansas City, Missouri. As our class suspected, the tracts to the west of Troost Avenue held a majority population consisting of whites while the east tracts were majority blacks. This was not the only variable dividing the west and east of Troost Avenue, but there was a stark difference in income levels, house value, vacant structures, school attendance, and even a dramatic difference in the age of the population. The differences in age groups of the west and east study tracts is something I was not expecting to see, and it can be associated with the types of businesses seen on both sides of Troost Avenue. Figures 1 and 2 show the variation of age levels in the west and east study tracts. The largest percent of population in the west study tracts lie within the age group of 25-34 years old. However, the largest percent of population in the east study tracts lie within the age group of 15-24 years old. The west study tracts have fewer children and a larger mid aged population, while the east study tracts have more children and a more equal distribution throughout the age groups.

Figure 1. Population Pyramid of East Study Tracts created by Cristina Aurich 02/2019
Figure 2. Population Pyramid of West Study Tracts created by Cristina Aurich 02/2019

The difference in age across Troost Avenue is relatable to the types of businesses in our study area. Within our six tracts, I was able to only find five child day care services, from looking at Kansas City’s active business license, and all five were located in the east study tracts. Another big finding, relating to age and businesses, were the different clothing stores. Figure 3 shows a typical clothing store that can be spotted in the west study tracts and figure 4 shows one that can be observed in the east study tracts. The west study tracts are filled with locally owned boutiques with pricey, one of a kind, high quality material clothes. Compared to clothing shops in the east study tracts, which consist of factory made, low quality material, disposable clothes. An older population generally buys for long term and a younger population buys short term.The difference in age across Troost Avenue is relatable to the types of businesses in the study area. Within our six tracts I was able to only find five child day care services, from looking at Kansas City’s active business license, and all five were located in the east study tracts. Another big finding relating to age and businesses were the different clothing stores. Figure 3 shows a typical clothing store that can be spotted in the west study tracts and figure 4 shows one that can be observed in the east study tracts. The west tracts are filled with locally owned boutiques with pricey, one of a kind, high quality material clothes. Compared to clothing shops in the east study tracts, which consist of factory made, low quality material, disposable clothes. An older population generally buys for long term and a younger population buys short term.

Shop Girls Boutique in East Brookside taken by Bryce Morgan 02/2019
Gen X Clothing Store Inside The Landing Mall taken by Cristina Aurich 02/2019

Overall, looking at all the business license within our study tracts, there were similarities in the top business types for both the west and east study tracts. Professional scientific & technical services, salon/barbershops and commercial & institutional building construction businesses were at the top of the list for businesses on each side of Troost Avenue. Overall, looking at all the business license within our study tracts there were similarities in the top business types for both the west and east study tracts. Professional scientific & technical services, salon/barbershops and commercial & institutional building construction businesses were at the top of the list for businesses on each side of Troost Avenue.

Existing Conditions – Vacancy and Ownership

When looking at the census tracts within our study area – 80-83, 86, and 87 – the vacancy of eastern tracts versus western tracts was astonishing. After looking at the housing units in structure over the years and the vacancy, I pulled up ownership in the area to see who was actually living in the houses they owned. This was done through www.kcparcelviewer.com and it was a good way to see who all owns properties in the area. For a refresher, the vacancy has been shown below. The western tracts are 82, 83, and 86, and the eastern tracts are 80, 81, and 87.

Percent Vacant of Housing Units in Structure. Made by Adair Bright

In order to gather the data for ownership in the area, I downloaded excel files and then highlighted all the out of state owners. This means there could be in state owners who still do not live in the area. Therefore, the percentage is a rough percentage but it gets the point across. So, for the eastern tracts, about 18.9% of the parcels are owned by people, companies, or trusts, that are not located in the state of Missouri. For the western tracts, only about 5.8% of the parcels are owned by people, companies, or trusts, outside the state of Missouri.

To me, the correlation between the two makes perfect sense because out of state owners are not necessarily concerned with filling property – especially if the parcel is owned by a company or a trust. This means the neighborhood needs to take back their parcels or make the owners of those parcels fill them or at least take care of them. All in all, I think the contrast between east and west is sad and it should not be because the housing stock is very similar and the vacancy and ownership rates should not be that different.

Analysis of Educational Attainment

A look into the educational demographics of the census tracts surrounding “The Landing”


Enrollment status

Looking into the past trends of people in the six surrounding census tracts of the 63rd street intersection it is apparent that there are plenty of people in the area striving for higher education. Represented in Table 1. below, there seemed to be a spike in college enrollment in 2012, where every tract followed a growth trend in that year.

Table 1. Created by : Logan Sours

Educational Timeline

Map 1990 | Created by: Logan Sours

Map 2000 | Created by: Logan Sours

Map 2012 | Created by: Logan Sours

Map 2017 | Created by: Logan Sours

As seen in the map compilation above, the census tracts have shown tendency to remain within the same classification. The only real change shown is in tract 80 crested above the 75% mark somewhere between 2000 and 2012. This is interesting because even as population may have changed, the same census tracts show he same change over time.

Table 2. Created by: Logan Sours

Table 3. Created by: Logan Sours

Table 4. Created by: Logan Sours

Table 5. Created by: Logan Sours

The tables above show that there is a large amount of the population that has some higher education falls into the categories of some college of has obtained a bachelors degree. Another notable observation is that the census tracts that have higher numbers of people with degrees have lower numbers in the ” some college” area.

History of the landing site

The area around The Landing Mall began as a suburban escape from the urban core. The southern expansion of Kansas City can be noted by curvy streets and larger parking lots. The surrounding neighborhoods were built around the park and boulevards system in Kansas City, making it a desirable place to live when it began. As suspected, the area surrounding the Landing was not very populated in the 1920s but in the 19603, around when the Landing was built, the area became pretty dense. Since then it has seen some demolition of buildings and the ground is less packed.

1963 Figure Ground Map Surrounding The Landing (1″=200′). Made by Adair Bright
2018 Figure Ground Map Surrounding The Landing (1″=200′). Made by Adair Bright