Tag Archives: Maps

Housing Unit analysis

When looking at housing unit data for the area surrounding The Landing, data was pulled for census tracts 80-83,86, and 87 to have a good amount of area around the site. Data was gathered for years 1990-2017 and included the Decennial Census Data and ACS 5-year estimates. When looking at the data, I thought the most useful information for us to know would be the vacancy numbers for housing units and the housing type. Majority of the homes were single family detached which then narrowed down my focus to vacancy.

Change in Number of Housing Units. Made by Adair Bright
http://info.umkc.edu/63rd-st-studio/?attachment_id=2428

I first looked at the number of housing units in total to see how they changed throughout the years. The above image should be a GIF but if it is not changing images the link has been included as well to download and watch it. I thought it would be interesting to first analyze how the neighborhood grew, which in relation to Kansas City, Missouri, it grew at a comparable rate.

Change in Number of Vacant Housing Units. Made by Adair Bright
http://info.umkc.edu/63rd-st-studio/?attachment_id=2432

When looking at the vacant units and especially the change over time, appears to be growing more and more vacant. Because of this, I decided to look at the percent vacant to get a clear numerical image of where our census tracts really are. Doing so has shown an increase in vacancy over time as the number of housing units has decreased.

VacancyUnits in TotalPercent Vacant
19907009,0377.7%
20005188,7515.9%
20129958,82611.2%
20171,1478,89412.8%

Seeing as I did only look into the housing units and the occupancy status based on housing, it would be interesting to conduct a further analysis of occupancy considering all structures in these tracts. All in all, I think we have an opportunity with the site to create something to bring families back into the area and decrease the amount of vacancy and possibly increase the amount of structures. If the demand can be created then we can produce the necessary neighborhood units to supply the people with what they need.

Tucson Streetcar

Tucson Sun Link Streetcar

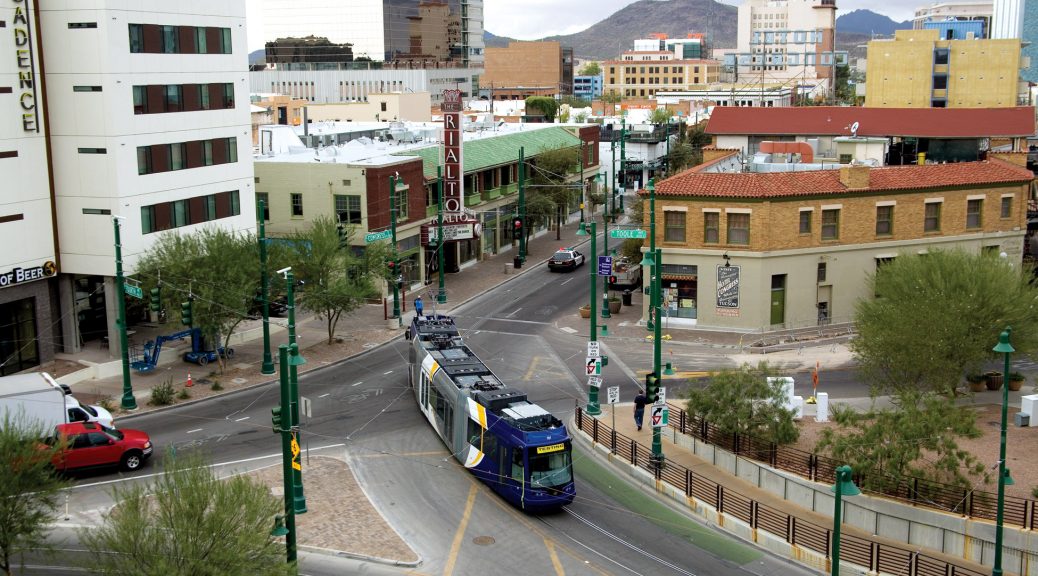
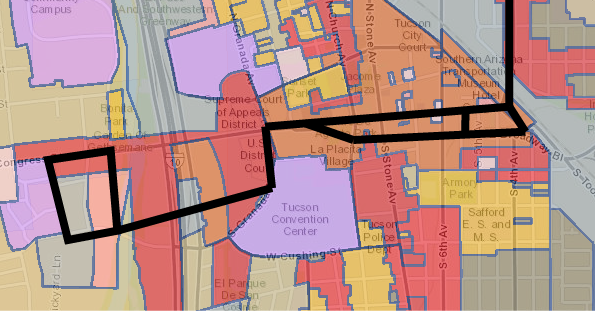
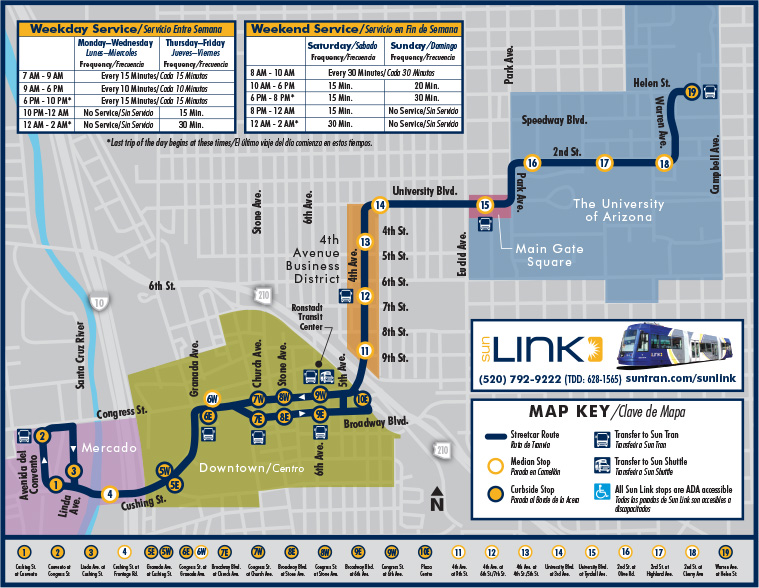
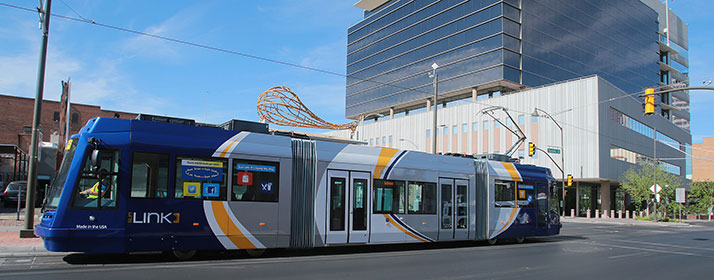
The Sun Link Streetcar system opened in July 25th 2014. It has 23 Stations (17 per direction) with daily ridership around 4,000 (Arizona Daily Star). The length of the line is 3.9 miles, servicing the University of Arizona, Downtown and Mercado.  The estimate from the city was 3,600 weekday riders, it exceeded expectations.

One-way full fare is $1.50, a day pass is $4. There is a SunGO card that works for the bus and streetcar and allows a transfer between the two vehicles.

In order to build the Sun Link System, Tucson secured a $63 million federal grant for its modern streetcar. This included the price of tearing up the existing roadway and the laying down of tracks for the streetcar. Currently, fare boxes are on course to bring in $1.2 million per year. With annual operations costs at about $4.2 million, that’s in line with cost recovery ratios for most transit systems.

Zoning Around Downtown Streetcar (MapTucson GIS)

Much of the initial ridership was due to novelty of a tram/streetcar in the downtown area. (Patrick McNamara) According to the Monthly Operations Report, in January 2017 average weekday ridership was at 2,857, which was is an increase from the January 2106 average of 2,757. Both of which are below the projections,  however in September and March ridership was at am average of 3,800 on the weekdays. This could be partially due to the large amount of University Students who utilize the streetcar. The ridership for the summer months of 2016 was also comparatively low. 

The proposed route of the extended Kansas City Streetcar, terminates at the UMKC Campus. Similarly to Tucson, the KC Streetcar could see an increase of riders during the school semester. However it is important to note that the University of Missouri – Kansas City has a total enrollment of 16,000 and the University of Arizona has a total enrollment of 43,000.

Route Maps:

Route Map for Tucson


Route Map for Kansas City.

Sources:
McNamara, Patrick”Tucson’s Streetcar Exceeds Ridership Expectations.” Tucson’s Streetcar Exceeds Ridership Expectations. Arizona Daily Star, 29 Sept. 2015. Web. 13 Mar. 2017.

O’Dell, Rob”US Grants Tucson $63M for Streetcar.” US Grants Tucson $63M for Streetcar. Arizona Daily Star, 02 July 2014. Web. 13 Mar. 2017.

“Route Map.” Sun Link – The Tucson Streetcar. Web. tucsonaz.gov

Signage on Kansas Cities Parks & Boulevards

DIAGRAMMATIC MAP OF SIGNAGEScreen Shot 2015-02-17 at 1.53.06 PM

This map shows the relative locations of different kinds of signage that line the parks and boulevards system in Kansas City.


PRECEDENTS OF SIGNAGE ON PARKS & BOULEVARDS

There are a wide array of different kinds of signs in KC. I took as many examples that are representative of the different aspects of this design element.
Screen Shot 2015-02-17 at 1.59.04 PM

Screen Shot 2015-02-17 at 1.59.13 PM

Screen Shot 2015-02-17 at 1.59.33 PM


IMPLEMENTATION

Screen Shot 2015-02-17 at 1.54.52 PM

When diagraming the intersection of two famous boulevards in KC I noticed the importance of the crossing. As Broadway and Southwest Boulevard meet, there is an opportunity for a walkable route that could connect people throughout the crossroads.  Currently, the billboards create a very impersonal scale for the pedestrian and also are an inherent negative externality to the passerby.

Screen Shot 2015-02-17 at 1.56.07 PM

By implementing vegetation along the streets and restoring the streets to exemplify their namesake,  the intersection takes upon an entirely different feeling. I also envisioned having a elevated garden green area where the billboard platform currently resides.

Screen Shot 2015-02-17 at 1.56.26 PM

By increasing the brightness and adding a reflective material to new boulevard street signs, the information becomes much more readable.

Screen Shot 2015-02-17 at 1.56.37 PM

One of the things that I noticed through analysis and study of the Parks system is the lack of a design language. There also is a surprising lack of information and history that is shared in the public physical realm.  I, in turn, envisioned a coherent and consistent park sign that could carry information, context, and history of the parks and boulevard system. People want to know about Kessler, and how the parkways and boulevards follow the topography, interconnecting the park “knuckles” dispersed around the city.