A look into the educational demographics of the census tracts surrounding “The Landing”
Enrollment status
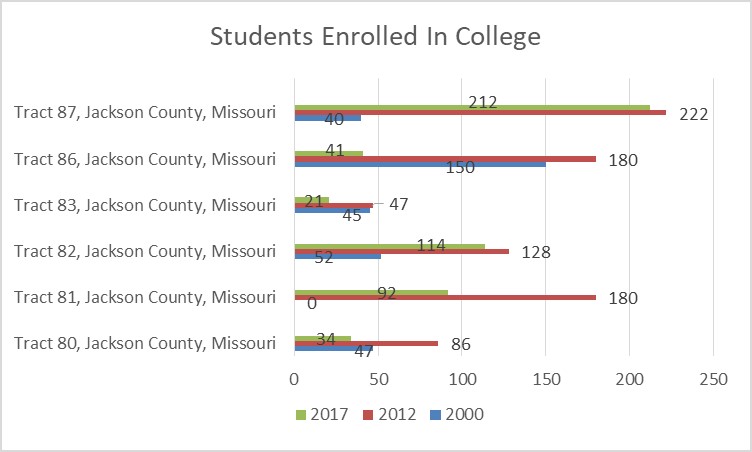
Looking into the past trends of people in the six surrounding census tracts of the 63rd street intersection it is apparent that there are plenty of people in the area striving for higher education. Represented in Table 1. below, there seemed to be a spike in college enrollment in 2012, where every tract followed a growth trend in that year.
Educational Timeline
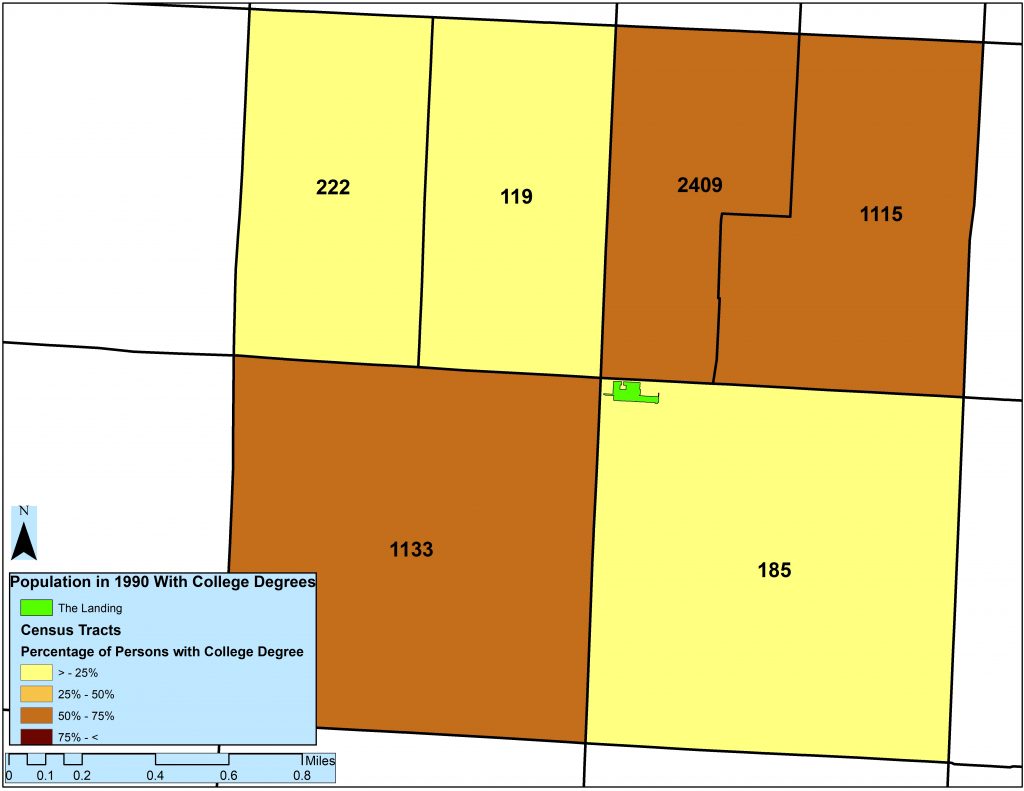

Map 2000 | Created by: Logan Sours
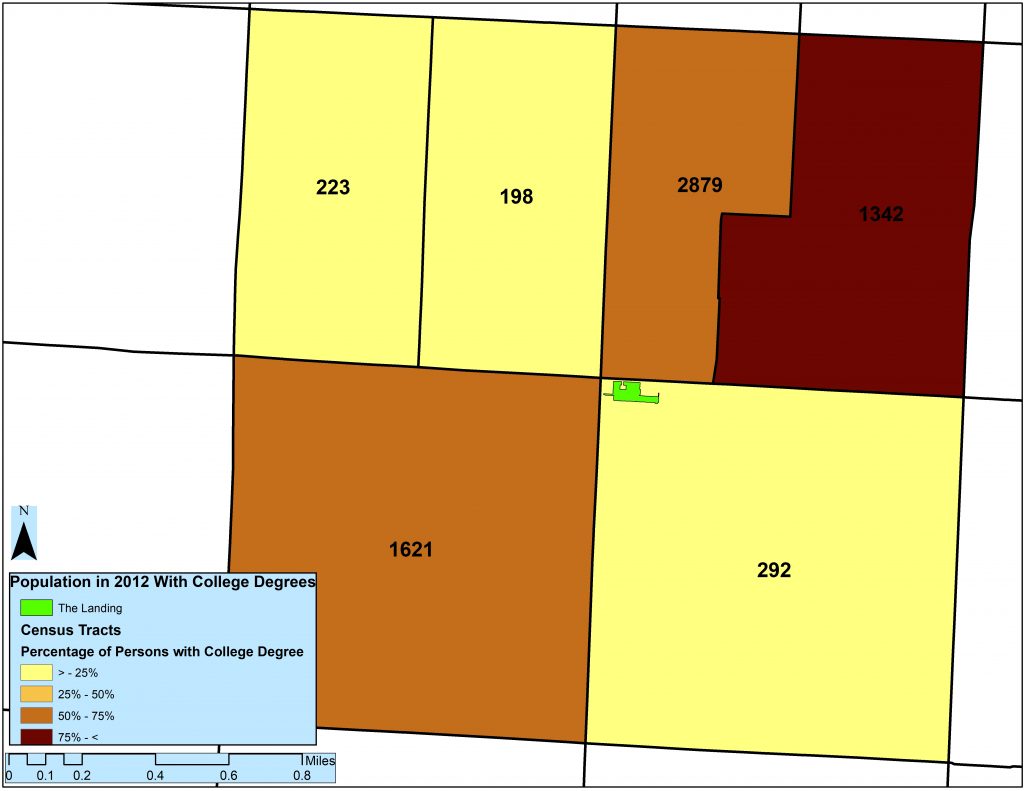
Map 2012 | Created by: Logan Sours

Map 2017 | Created by: Logan Sours
As seen in the map compilation above, the census tracts have shown tendency to remain within the same classification. The only real change shown is in tract 80 crested above the 75% mark somewhere between 2000 and 2012. This is interesting because even as population may have changed, the same census tracts show he same change over time.
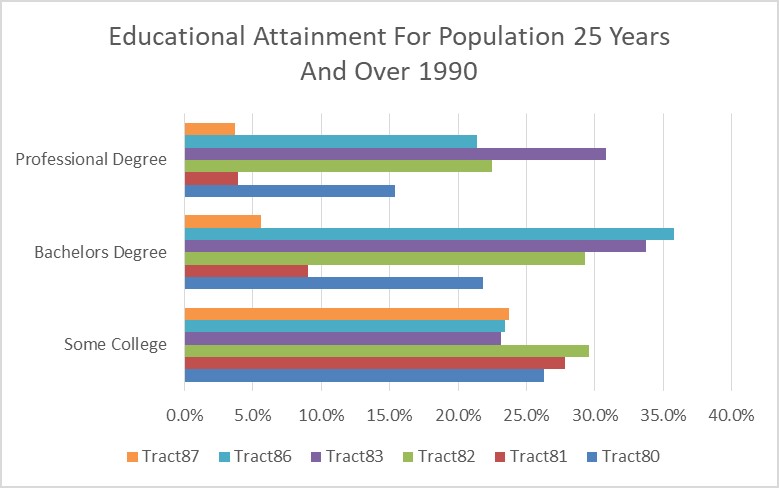
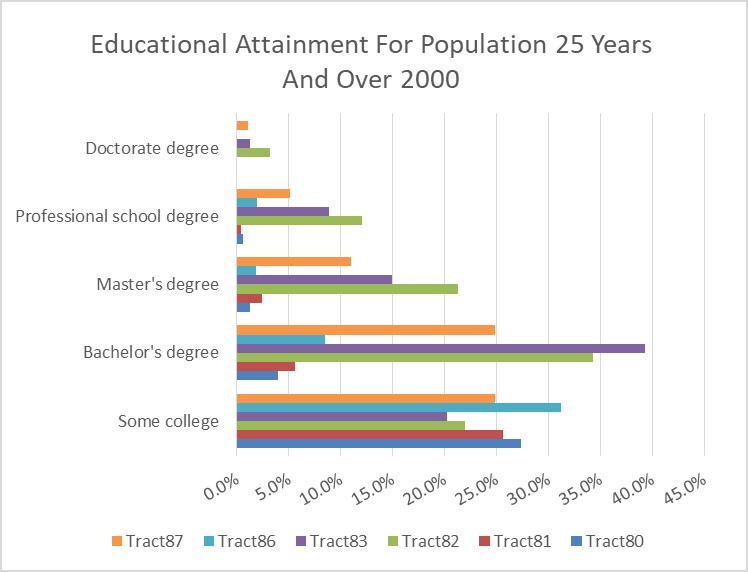
Table 3. Created by: Logan Sours

Table 4. Created by: Logan Sours

Table 5. Created by: Logan Sours
The tables above show that there is a large amount of the population that has some higher education falls into the categories of some college of has obtained a bachelors degree. Another notable observation is that the census tracts that have higher numbers of people with degrees have lower numbers in the ” some college” area.