Category Archives: Quick Analysis

Bi-state Sustainable Reinvestment Corridor RFP and the KC Regional Climate Action Plan

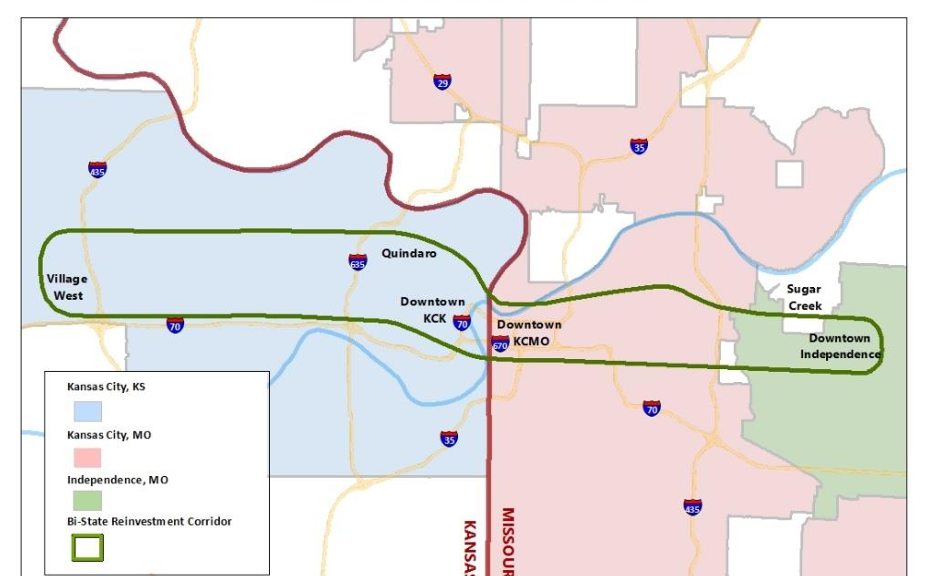
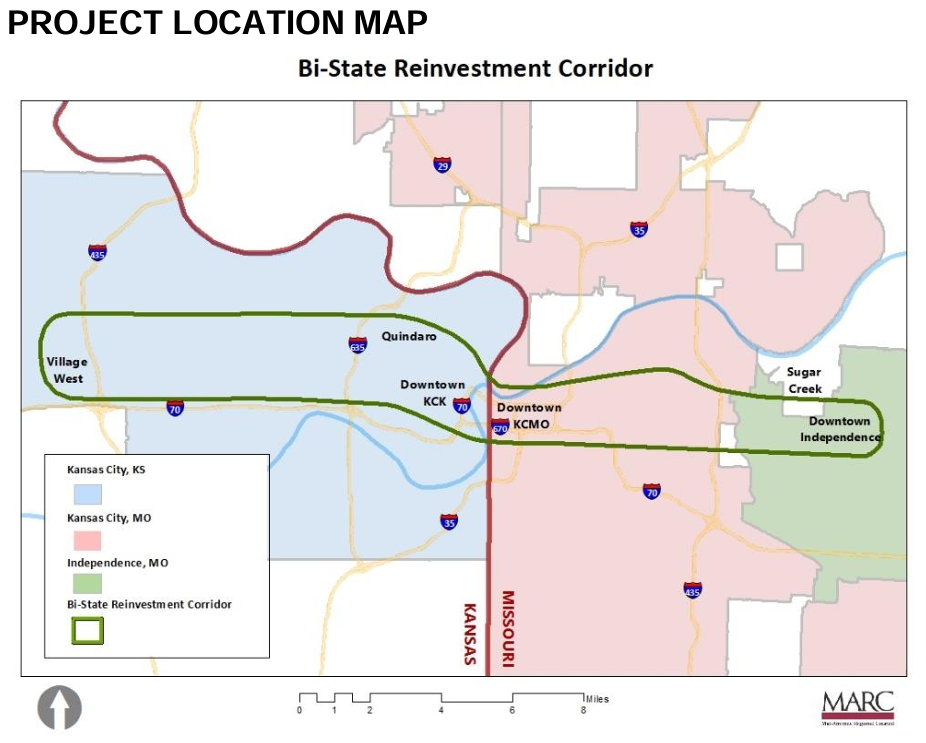
The issued request for proposals for the Bi-state Sustainable Reinvestment Corridor (BSRC) has the potential to fully revitalize communities in the heart of the Kansas City metropolitan area. Kansas City, KS, Kansas City, MO, and Independence, MO, will all benefit from this focus on modern green infrastructure, economic development, and community safety. The BSRC reflects targeted development that can maximize potential. Regional cooperation is essential in transforming everyday life, and this RFP emphasizes the need for participation from all stakeholders in the corridor.

Map showing the boundary of the Bi-state Sustainable Reinvestment Corridor as defined by the Mid-American Regional Council.
Figure 1. Project location map defining the BSRC (MARC, 2023).

I must also recognize the current context in which the BSRC exists. Recent infrastructure laws championed by the Biden administration–namely, the 2021 Infrastructure Investment and Jobs Act and 2022 Inflation Reduction Act–have enabled a wave of sustainable, climate-focused infrastructure developments across the United States. This RFP targets sustainability as the driving factor behind this development, aligning itself with these federal goals. Political support from the administration and local congressional offices will determine how far the BSRC plans will go.

I appreciate the Mid-America Regional Council and its partners for committing to implement numerous existing plans. A pattern exists in the planning world where money and effort get put into development plans that now collect dust. The BSRC RFP affirms that extensive work regarding transportation, climate, trails and bikeways, and economic development has already happened (MARC, 2023, p. 6). All plans should include this history to ensure efficient progress occurs.

Graphic listing climate priorities as identified by the Kansas City Regional Climate Action Plan executive summary.
Figure 2. Kansas City Regional Climate Action Plan priorities and strategies listed in its executive summary (MARC and Climate Action KC, 2021).

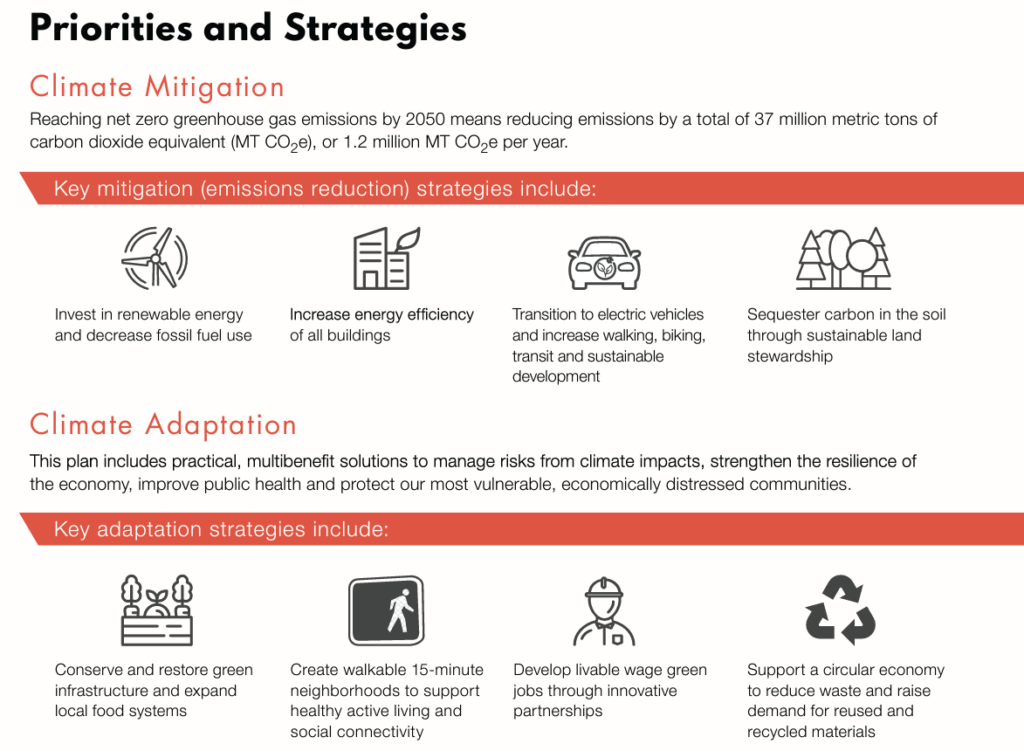
The Kansas City Regional Climate Action Plan is a part of this project’s history (p. 6). I view the BSRC as a direct implementation process of the 2021 action plan developed by MARC and Climate Action KC. The CAP lists recommendations for transportation investments, building efficiency standards, greenhouse gas emissions reductions, and more–all elements listed in the RFP. The CAP should be a reference for every major infrastructure project in the Kansas City region.

It is encouraging to see how intertwined these two plans are. This project will provide a great look into this exciting corridor.

References

Mid-America Regional Council and Climate Action KC. (2021). KC Regional Climate Action Plan Executive Summary. https://kcmetroclimateplan.org/

Mid-America Regional Council and Climate Action KC. (2021). KC Regional Climate Action Plan. https://kcmetroclimateplan.org/

Mid-America Regional Council. (2023, December 19). Bi-state Sustainable Reinvestment Corridor. https://www.marc.org/about-marc/funding-and-rfps/

Population and Housing Trends around Troost park

From 1990 to 2010, Troost Park has experienced a decline in both total population and housing units. The Troost Park area as a whole has seen a movement of people choosing to live elsewhere which is affecting the northern portion of the study area in particular. The southern portion has seen a decline as well, but it has not been as drastic as its northern counterpart.

Figure 1. Total Population by Block 1990 for Troost Park Study Area. (US Census, 1990)
Figure 2. Total Population by Block 2000 for Troost Park Study Area. (US Census, 2000)
Figure 3. Total Population by Block 2010 for Troost Park Study Area. (US Census, 2010)

This is the opposite of what is happening in Kansas City as a whole, though. KCMO is seeing an uptick in total population, especially from 2000-2010. This contrasting data paints a picture of a growing city whose center has become unappealing to live in for existing and potential residents.

Figure 4. Total Population by Year in Troost Park Study Area. (US Census, 1990, 2000, 2010)
Figure 5. Total Population by Year for Kansas City, MO. (US Census, 1990, 2000, 2010)

The number of housing units demonstrates a similar trend over the past couple decades. There has been a decline of housing units, especially in the northern portion of our study area. Conversely, Kansas City as a whole has seen an surge in the number of housing units from 2000-2010.

Figure 6. Total Housing Units by Block 1990 for Troost Park Study Area. (US Census, 1990)
Figure 7. Total Housing Units by Block 2000 for Troost Park Study Area . (US Census, 2000)
Figure 8. Total Housing Units by Block 2010 for Troost Park Study Area. (US Census, 2010)
Figure 9. Total Housing Units by Year for Troost Study Area. (US Census, 1990, 2000, 2010)
Figure 10. Total Housing Units by Year for Kansas City, MO. (US Census, 1990, 2000, 2010)

This area has had its challenges with housing, but there are signs of life outside of the hard data. Troost Park is a great asset to the community, and many companies are investing in the area despite the decline in population. Even though many lots sit vacant, they appear to be well maintained and mowed on a regular basis. There are also several beautiful homes in the area which bring life to a community that has seen years of demolition. The Troost Park area still has more to offer.

Soucres:

US Census Bureau. (2010). 2010 Census. US Department of Commerce.

US Census Bureau. (2000). 2000 Census. US Department of Commerce.

US Census Bureau. (1990). 1990 Census. US Department of Commerce.

Population boost on troost

With time comes change. Looking at census data from 1990 to the most recent American Community Survey (ACS) from 2013-2017 changes in population are evident. I looked at the 6 census tracts surrounding the Landing Mall, tracts 80-83, 86, & 87. Slight transformations have occurred within the 6 tracts over the last 30 years. The Landing Mall is located in census tract 87 and has maintained its low population density over the years. Forest Hill Calvary Cemetery and Research Medical Hospital each takes up a quarter of the land on tract 87 which explain why this tract is continuously shown in the lightest blue in figures 1-4. The most dramatic changes are seen between figure 1 and figure 4.
Tracts 80 and 86 went from a deep teal to 2 shades lighter indicating lost in population density.

Figure 1. Population Density (per sauare mile) 1990 for census tracts 80-83, 86, & 87 created by Cristina Aurich 02/2019
Figure 2. Population Density (per square mile) 2000 for census tracts 80-83, 86, & 87 created by Cristina Aurich 02/2019

Figure 3. Population Density (per square mile) 2010 for census tracts 80-83, 86, & 87 created by Cristina Aurich 02/2019 2010

Figure 4. Population Density (per square mile) 2013-2017 for census tracts 80-83, 86, & 87 created by Cristina Aurich 02/2019

Table 1. Changes in Population comparison between census tracts (80-34, 86, & 87), Kansas City, and the Metropolitan area created by Cristina Aurich 02/2019

Table 1 displays the comparison in population in the 6 tracts of study, Kansas City, and the Metropolitan area. Kansas City and the Metropolitan area have been in parallel with each other and continue to grow in population. Whereas the 6 tracts of study have been steadily decreasing until recently. From 2010 to 2013-2017 Kansas City has seen almost triple the population growth, in less time, than it saw from 1990-2000. Though people have left the area of 63rd Street and Troost Avenue in the past, they are beginning to return. This is a good sign for redevelopment of the Landing Mall and future development of the surroundings.

Figure 5. Population Pyramids for census tracts 80-83, 86, & 87 created by Cristina Aurich 02/2019

Figure 5 displays the age groups of the population living in the 6 study tracts. Looking at the pyramids, the highest number of population continues to lie within the age group of 25-34. However, looking at the population pyramids from 1990 and 2000, the population continued to grow to the next class causing the pyramid to swell towards the top. The newest population pyramids from 2010 and 2013-2017 show the population spread more evenly throughout the classes. The population of those living in the class of 65+ years has been growing since 2000, which is also a trend seen through the Metropolitan area.

Simply knowing the statistics of population and age in surrounding neighborhoods can lead to better planning. This is a tool that seems to be forgotten too often when planning with the people in mind.

Analysis of Educational Attainment

A look into the educational demographics of the census tracts surrounding “The Landing”


Enrollment status

Looking into the past trends of people in the six surrounding census tracts of the 63rd street intersection it is apparent that there are plenty of people in the area striving for higher education. Represented in Table 1. below, there seemed to be a spike in college enrollment in 2012, where every tract followed a growth trend in that year.

Table 1. Created by : Logan Sours

Educational Timeline

Map 1990 | Created by: Logan Sours

Map 2000 | Created by: Logan Sours

Map 2012 | Created by: Logan Sours

Map 2017 | Created by: Logan Sours

As seen in the map compilation above, the census tracts have shown tendency to remain within the same classification. The only real change shown is in tract 80 crested above the 75% mark somewhere between 2000 and 2012. This is interesting because even as population may have changed, the same census tracts show he same change over time.

Table 2. Created by: Logan Sours

Table 3. Created by: Logan Sours

Table 4. Created by: Logan Sours

Table 5. Created by: Logan Sours

The tables above show that there is a large amount of the population that has some higher education falls into the categories of some college of has obtained a bachelors degree. Another notable observation is that the census tracts that have higher numbers of people with degrees have lower numbers in the ” some college” area.

Housing Unit analysis

When looking at housing unit data for the area surrounding The Landing, data was pulled for census tracts 80-83,86, and 87 to have a good amount of area around the site. Data was gathered for years 1990-2017 and included the Decennial Census Data and ACS 5-year estimates. When looking at the data, I thought the most useful information for us to know would be the vacancy numbers for housing units and the housing type. Majority of the homes were single family detached which then narrowed down my focus to vacancy.

Change in Number of Housing Units. Made by Adair Bright
http://info.umkc.edu/63rd-st-studio/?attachment_id=2428

I first looked at the number of housing units in total to see how they changed throughout the years. The above image should be a GIF but if it is not changing images the link has been included as well to download and watch it. I thought it would be interesting to first analyze how the neighborhood grew, which in relation to Kansas City, Missouri, it grew at a comparable rate.

Change in Number of Vacant Housing Units. Made by Adair Bright
http://info.umkc.edu/63rd-st-studio/?attachment_id=2432

When looking at the vacant units and especially the change over time, appears to be growing more and more vacant. Because of this, I decided to look at the percent vacant to get a clear numerical image of where our census tracts really are. Doing so has shown an increase in vacancy over time as the number of housing units has decreased.

VacancyUnits in TotalPercent Vacant
19907009,0377.7%
20005188,7515.9%
20129958,82611.2%
20171,1478,89412.8%

Seeing as I did only look into the housing units and the occupancy status based on housing, it would be interesting to conduct a further analysis of occupancy considering all structures in these tracts. All in all, I think we have an opportunity with the site to create something to bring families back into the area and decrease the amount of vacancy and possibly increase the amount of structures. If the demand can be created then we can produce the necessary neighborhood units to supply the people with what they need.

History of the landing site

The area around The Landing Mall began as a suburban escape from the urban core. The southern expansion of Kansas City can be noted by curvy streets and larger parking lots. The surrounding neighborhoods were built around the park and boulevards system in Kansas City, making it a desirable place to live when it began. As suspected, the area surrounding the Landing was not very populated in the 1920s but in the 19603, around when the Landing was built, the area became pretty dense. Since then it has seen some demolition of buildings and the ground is less packed.

1963 Figure Ground Map Surrounding The Landing (1″=200′). Made by Adair Bright
2018 Figure Ground Map Surrounding The Landing (1″=200′). Made by Adair Bright

The Knuckle

Describing the seemingly complex intersection of 63rd Street, Meyer Boulevard and The Paseo, famed Architect and Urban Designer, Ted Seligson, refers to it as “the knuckle” of Kansas City’s boulevard system. Viewing the intersection from an aerial view, Seligson’s analogy becomes clear. The way Meyer Boulevard merges into The Paseo, then briefly runs parallel with 63rd Street, before finally turning back down into itself, looks like a person’s finger joints. The knuckle, which lies just East of The Landing (which was discussed in my last blog), is a node that various different land uses gather around. Not only is this the case for present day (currently a mix of residential, commercial and institutional uses surround the knuckle) but it has been the case for the past 100 or so years. This post will look at how the area immediately surround the knuckle has developed over time.

1925 Figure Ground Map – 63rd Street between Tracy and Woodland Avenues.
Source: Jared Islas, 2019.

The earliest developments in the area were mostly single-family residences. These homes mostly originated along Tracy and Woodland Avenues, with some additional homes appearing on either side of The Paseo. Many of the homes on Tracy and The Paseo will remain intact through to present day, but the same can not be said for those on Woodland.

According to the 1925 Atlas of Kansas City, the present-day Landing site was formerly home to two large greenhouses known as “William L. Rock Flower Company.” These greenhouses would also not last long, as they would be sold to JC Nichols in the mid to late 1940’s who would go on to develop The Landing Mall (Kansas City Star, 1947).

Also, just Northeast of the knuckle, sat the Blue Hills Golf Club. This would remain an important part of the neighborhood up the site was redeveloped for a suburban-esque retail shopping center and neighborhood.

1963 Figure Ground Map – 63rd Street between Tracy and Woodland Avenues.
Source: Jared Islas, 2019.

By 1963, more single-family residences had filled up the area Northwest of the knuckle and almost all of the houses that had been fronting Woodland Avenue had disappeared. Also, Convent of Christ the King, and some other institutional/office buildings sprung up South of 63rd Street. And The Landing mall was constructed on the former site of the two large greenhouses.

1991 Figure Ground Map – 63rd Street between Tracy and Woodland Avenues.
Source: Jared Islas, 2019.

By the early 1990’s, the Blue Hills Golf Club was gone and replaced by the suburban-esque strip mall, a six-story office building and a three-story parking garage. Commercial pad sites began developing around the knuckle and other intersections along 63rd Street.

2019 Figure Ground Map – 63rd Street between Tracy and Woodland Avenues.
Source: Jared Islas, 2019.

As of today, the area around the knuckle has not changed much since the early 90’s. The only major difference is the large additions to building at the Southeast corner of 63rd and Meyer. These buildings ultimately became the campus for the Ewing Marion Kauffman School, which is a public charter school.

While the structures and their uses surrounding the knuckle have changed in the last 100 years, there are some things that have remained the same. The first being some of the older, now historic, single-family homes on 62nd Terrace. The picture below shows these homes first in 1940, as part of the 1940 Tax Assessment photos, and then again in 2015 through Google Maps Street View.

Comparison of single family homes on 62nd Terrace
Source: 1940 Tax Assessor photos and 2015 Google Street View

These structures have remained relatively untouched during the almost 80 year gap that these photos were taken. The only things that have changed are expected renovations in older homes like these – materiality and landscaping.

The next set of photos, comes to the same conclusion. This commercial building, located halfway in between Tracy Avenue and The Paseo on the North side of 63rd Street has also remained relatively unchanged.

Comparison of a commercial building on 63rd Street.
Source: 1940 Tax Assessor photos and 2018 Google Street View.

These historic photos show that while there have been some structures that have been around for the better part of the last 80 years, nothing compares to the longevity of the knuckle.

have you heard about 63rd?

Only less than 100 years ago the area between 62nd street – 66th street and Rockhill Road – Troost Avenue was just beginning its development. A new shopping center on the southwest corner of 63rd st and Troost Ave. was built in the late 20s as neighborhoods began to move away from the city’s core. This shopping center offered a drugstore, barber shop, and restaurants, but has since been replaced with a US Bank and empty units. It is great to see this building is still standing strong and features its original structure, but it does not feel as lively as it looked in the late 20s. Figure 1 shows the 63rd and Troost Shopping Center in 1927 compared to today in 2019 (Figure 2).

Figure 1. 63rd & Troost Shopping Center 1927 (The Pendergast Years)
Figure 2. 63rd & Troost Shopping Center 2019 taken by Cristina Aurich 02/2019

Another building that has stuck around is the Highland Telephone Exchange Building, now called the Blue Hills Building. Located on the northwest corner of 63rd st and Troost Ave. and was placed on the National Register of Historical Places in 2005. Telephone exchange buildings were build in the “heart of the area they would serve” and were necessary for connecting calls during this period. Once an important structure now sits vacant with boarded up doors and broken glass window.

Figure 3. Hiland Telephone Exchange Building 1925 (National Register of Historic Places)
Figure 4. Blue Hills Building 2019 taken by Cristina Aurich 02/2019

Since 1925, this area has greatly advanced. Blocks that were almost completely empty have been replaced with homes and retail shops. Largest changes in the area can be seen between the 1920s and the 1960s. Residential neighborhoods continue to stay north of this area and commercial structures remain more south. Looking at figure grounds from 1990 and 2019 there is little modifications. Few structures have disappeared leaving behind open land. This open land is opportunity for development and growth.

Figure 5. Figure ground maps of 1925 & 1963 created by Cristina Aurich 02/2019
Figure 6. Figure ground maps of 1990 & 2019 created by Cristina Aurich 02/2019

Developing 63rd Street


1922. A view of the ford just below 63rd Street, looking south. The rustic bridge leads down to the road from the club house, known then as the “The Lodge” and located about where the home of Dr. and Mrs. Thomas G. Orr now stands.

The Landing on 63rd and Troost was a marvel of its time. It was a product of desire and want in a time of major sprawl. This was the heyday of horse racing, high-class sports, and a time of prosperity. People could afford to go out and spend money, women, in general, did not have jobs and could spend time during the week visiting shops and enjoying leisurely activities. But how did it affect the surrounding area and how has the late 20th and early 21st-century lifestyle changed the way this area has changed?

After World War 2 ended, a slew of men came home and a proliferation of whole new generation proceeded. The Baby Boomers. An astronomical number of homes needed to be built and they all had a certain western requirement; windy roads and large plots of land.

Google Image of 63rd around the Citadel Neighborhood facing West

Before Citadel was created for the purpose of satisfying the housing shortage, it was a golf course (not unlike the first image, which was on 63rd a few neighborhoods down). You can tell exactly where it was because of the stark contrast of street types, from a ridged grid to a windy post-WW2 sprawl type road.

The oldest building in the small context of between Brooklyn and Meyer is one dating from the 50’s, that being the Nazarene Theology School to the south. From there, the majority of the development was done in the 80’s, around 10 years after the completion of the Landing for context.

Figure ground comparison between Brooklyn and Meyer

There was an extremely large bolstering of development, as we can see from the figure grounds above, from 1963 to 1990. Then after that, there is a stall in development that is consistent with census household data. There was not much development from before the ’80s and therefore after.

Parcel view of section of land about 63rd street via Parcelviewer.com

The major travesty is that what was once a large expanse of open land, granted it was short grass and few trees, has been broken up and now the only remanence of the once huge plot of nature is now a small section (shown in green in the above picture). Which reminds me of one of my favorite quotes from James Kunstler, “In the context of contemporary culture…”green space” or “open space” essentially means build nothing. It is a rhetorical device for putting city land in cold storage in the only acceptable form, that is, covered by grass and shrubs, aka nature.”

Tucson Streetcar

Tucson Sun Link Streetcar

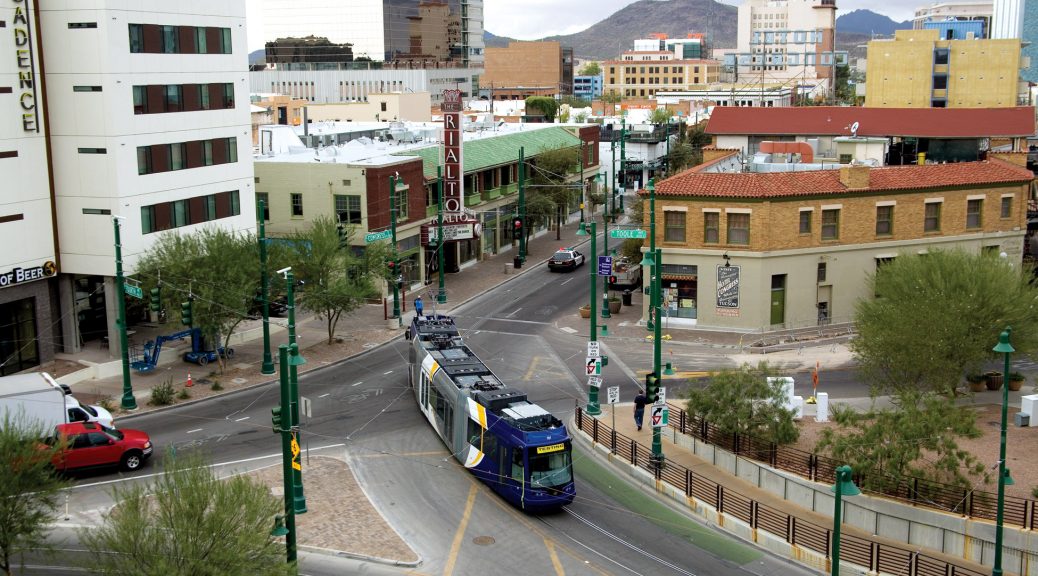
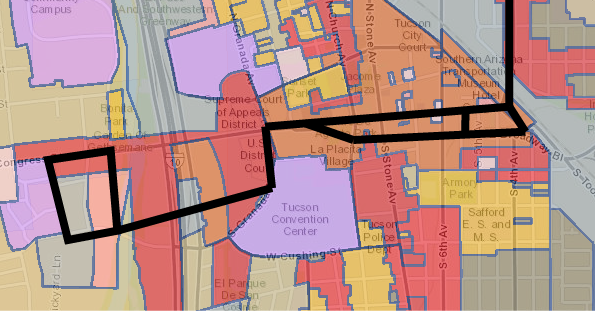
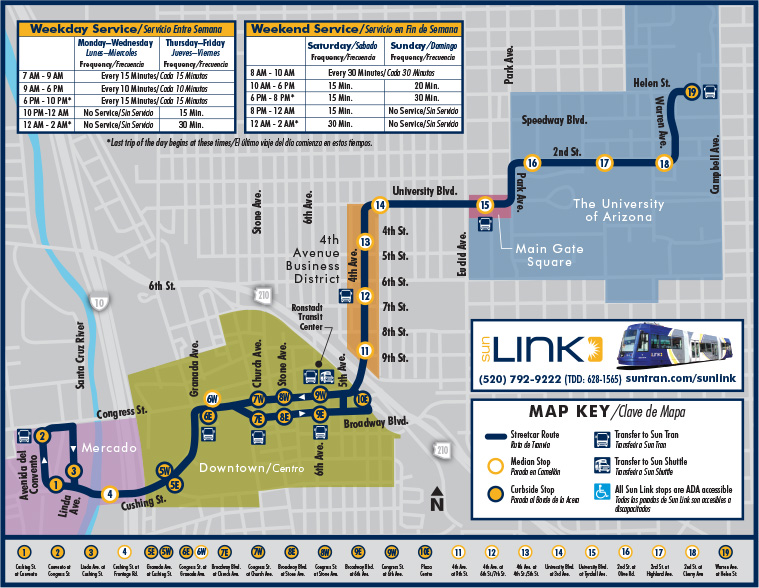
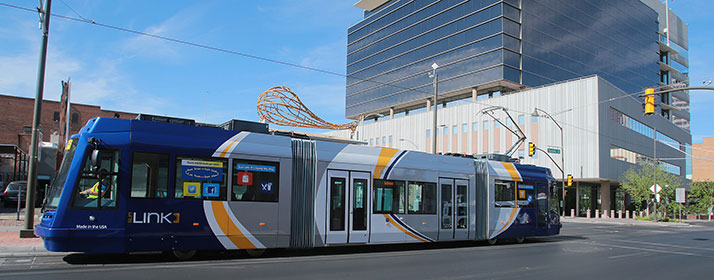
The Sun Link Streetcar system opened in July 25th 2014. It has 23 Stations (17 per direction) with daily ridership around 4,000 (Arizona Daily Star). The length of the line is 3.9 miles, servicing the University of Arizona, Downtown and Mercado.  The estimate from the city was 3,600 weekday riders, it exceeded expectations.

One-way full fare is $1.50, a day pass is $4. There is a SunGO card that works for the bus and streetcar and allows a transfer between the two vehicles.

In order to build the Sun Link System, Tucson secured a $63 million federal grant for its modern streetcar. This included the price of tearing up the existing roadway and the laying down of tracks for the streetcar. Currently, fare boxes are on course to bring in $1.2 million per year. With annual operations costs at about $4.2 million, that’s in line with cost recovery ratios for most transit systems.

Zoning Around Downtown Streetcar (MapTucson GIS)

Much of the initial ridership was due to novelty of a tram/streetcar in the downtown area. (Patrick McNamara) According to the Monthly Operations Report, in January 2017 average weekday ridership was at 2,857, which was is an increase from the January 2106 average of 2,757. Both of which are below the projections,  however in September and March ridership was at am average of 3,800 on the weekdays. This could be partially due to the large amount of University Students who utilize the streetcar. The ridership for the summer months of 2016 was also comparatively low. 

The proposed route of the extended Kansas City Streetcar, terminates at the UMKC Campus. Similarly to Tucson, the KC Streetcar could see an increase of riders during the school semester. However it is important to note that the University of Missouri – Kansas City has a total enrollment of 16,000 and the University of Arizona has a total enrollment of 43,000.

Route Maps:

Route Map for Tucson


Route Map for Kansas City.

Sources:
McNamara, Patrick”Tucson’s Streetcar Exceeds Ridership Expectations.” Tucson’s Streetcar Exceeds Ridership Expectations. Arizona Daily Star, 29 Sept. 2015. Web. 13 Mar. 2017.

O’Dell, Rob”US Grants Tucson $63M for Streetcar.” US Grants Tucson $63M for Streetcar. Arizona Daily Star, 02 July 2014. Web. 13 Mar. 2017.

“Route Map.” Sun Link – The Tucson Streetcar. Web. tucsonaz.gov