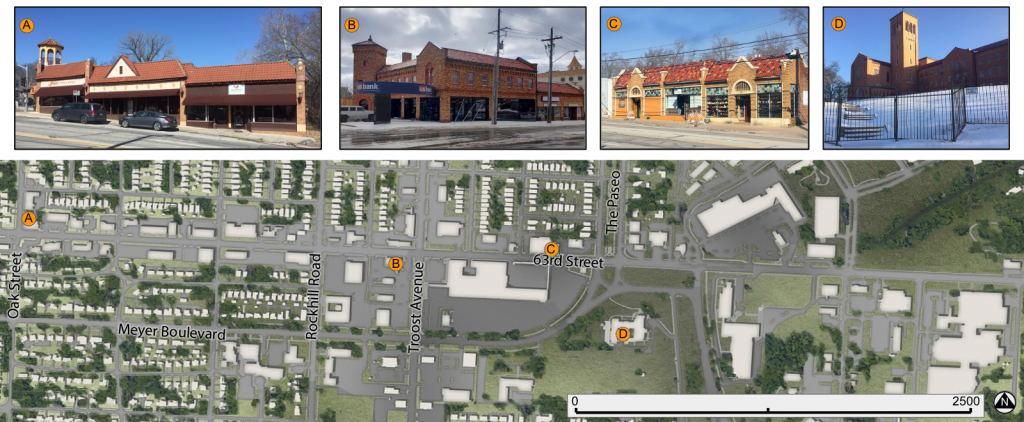
The major architectural character of the 63rd Street Corridor, between Oak and Prospect, has two prominent styles and an interesting sub-style.
The first major style is Spanish Revival. Notable for its mixture of red and buff brick, tiled roofs, towers, and terracotta decoration; this style dates to the 1920’s. While there are relatively few buildings in this style along the corridor, their baroque decoration, interesting color palate, and prominent locations make them stand out among more contemporary structures.
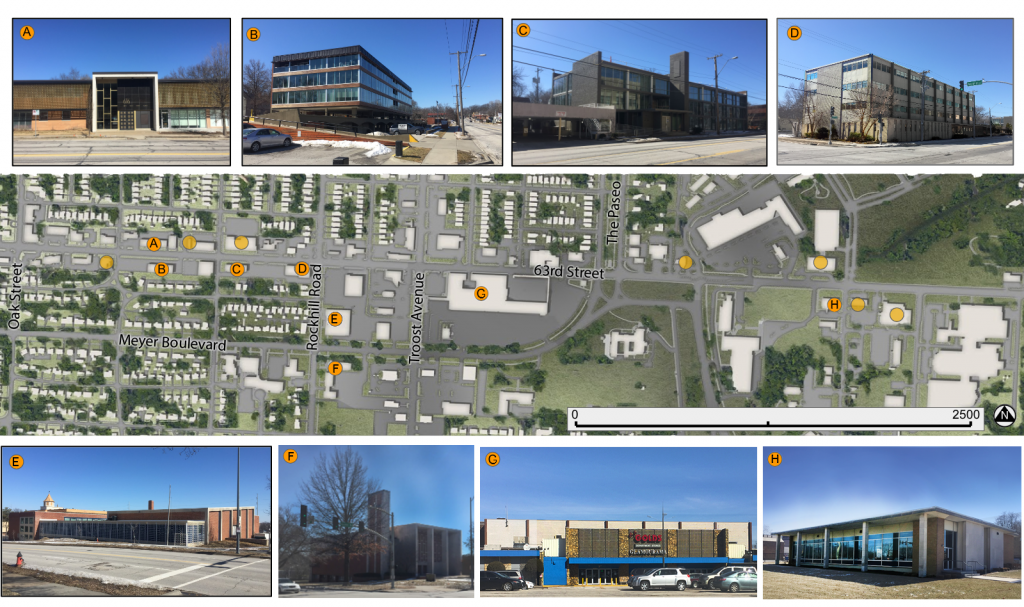
Small Commercial strip in a Spanish Revival style at 63rd and Oak. Note the tower, tiled roof and terracotta accents. This example is prominently located at the busy corner of 63rd and Troost.A 3-unit commercial structure on 63rd, between Tracy and The Paseo. The Convent of Christ the King dates to a later period than many other of the nearby examples (1940) but maintains the hallmarks of the style. It’s tower is visible from many points in the area. The relative locations of the Spanish Revival buildings
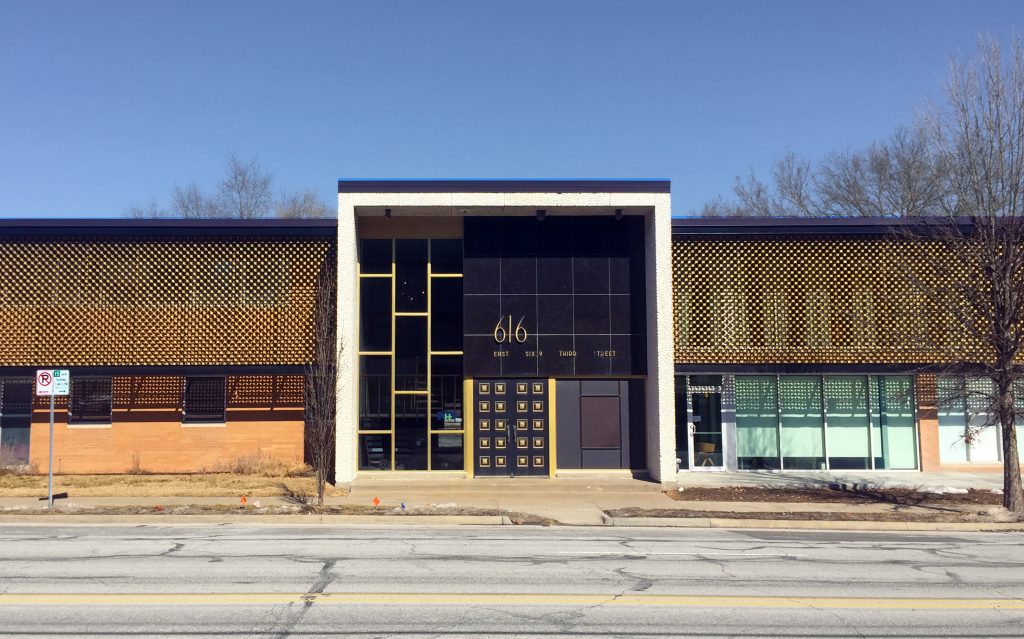
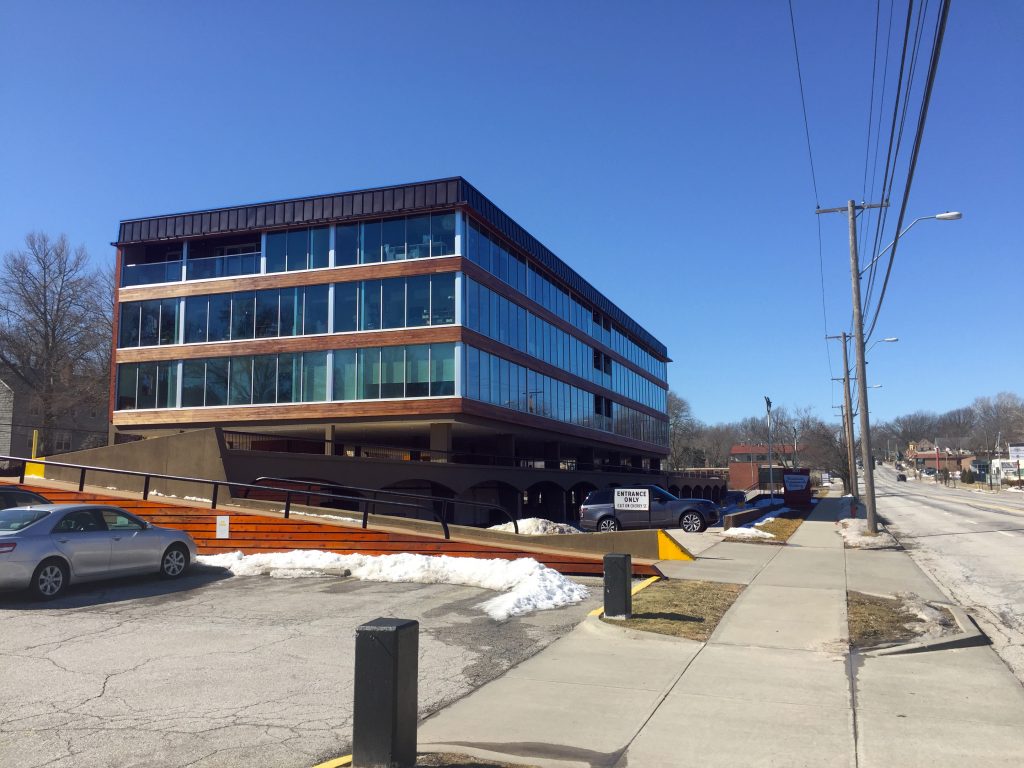
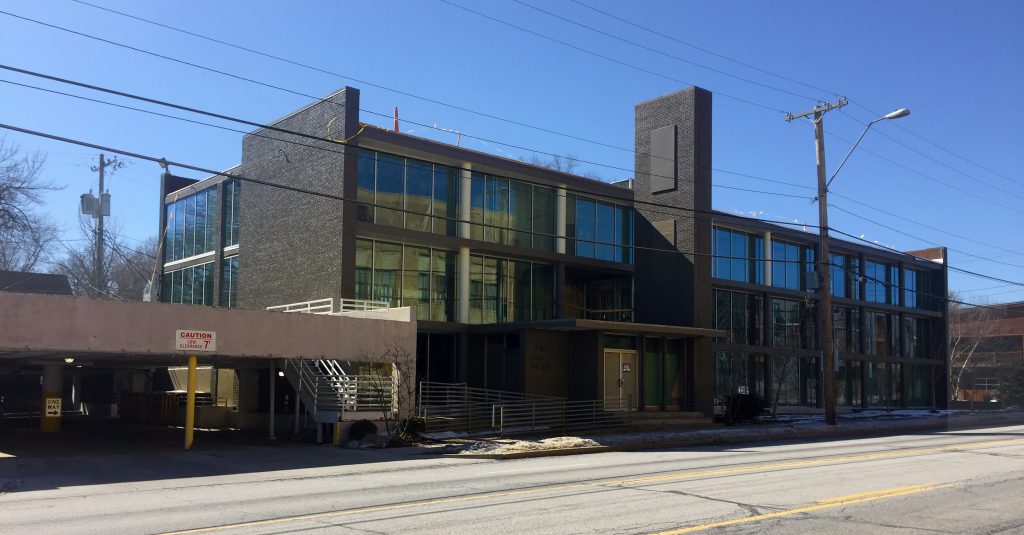
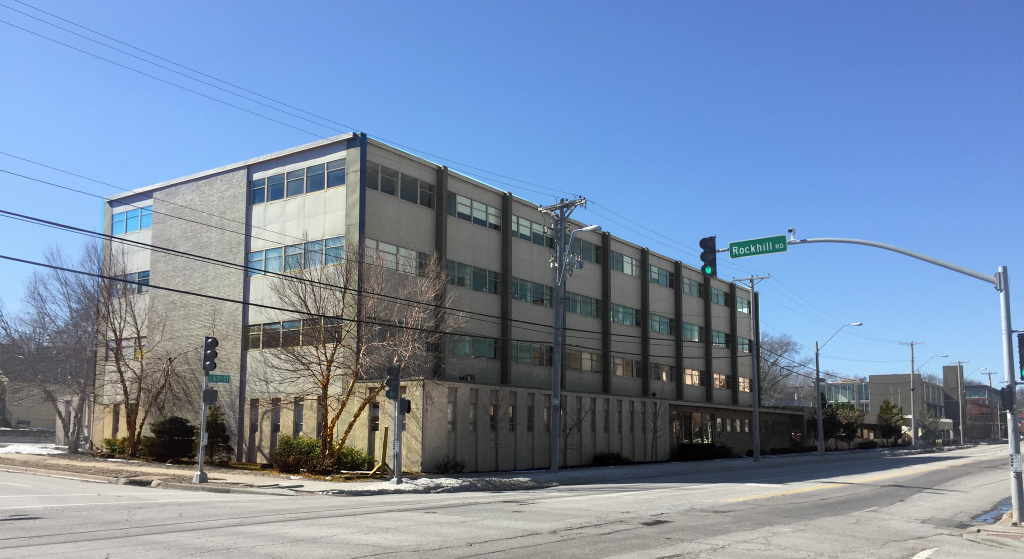
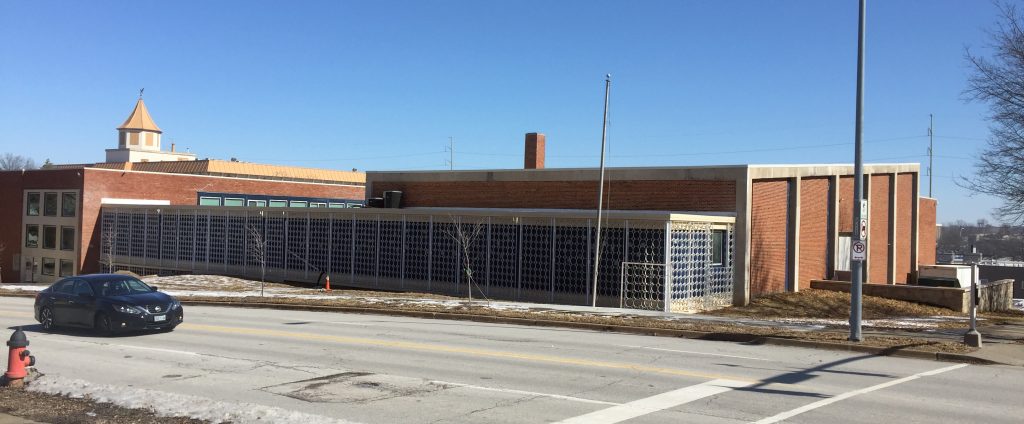
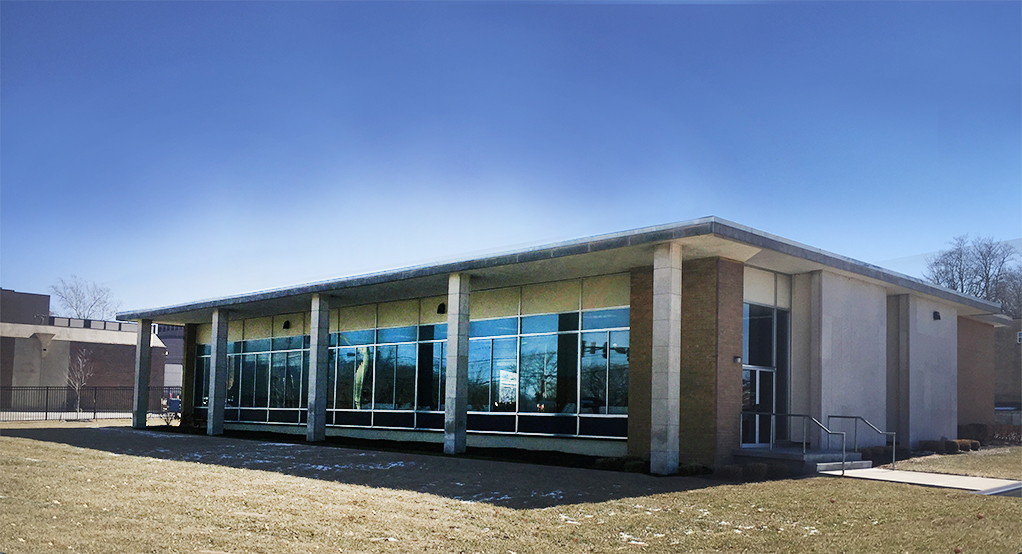
The second major style, and one that dominates the western portion of 63rd Street, is Modernism. Identified by the style’s clean lines, concrete, steel, and glass construction, and lack of ornamentation; these structures can be found in many forms along the corridor. A subsection of these structures feature concrete or metal screens which partially shield the structures from view.
Many of these modernist structures have integrated, structural parking adjacent to their usable space; evidence of their later period of development, well into the motor age.
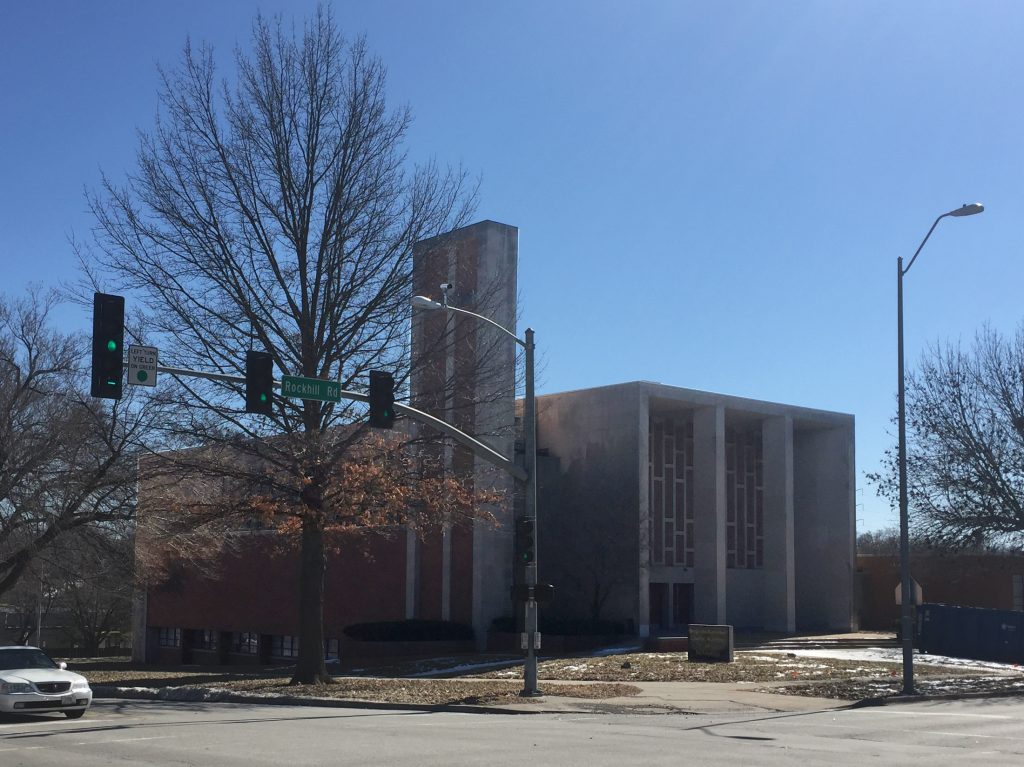
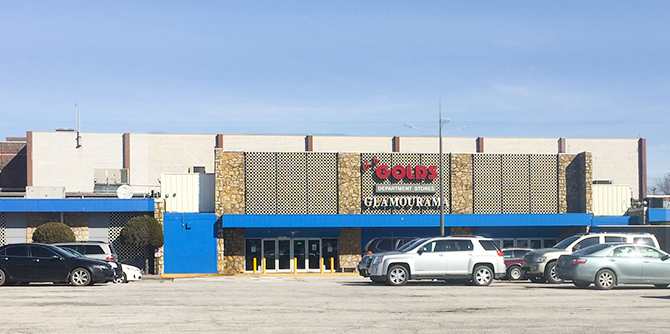
A low-rise office building with a patterned screen shielding its second floor. Found near Cherry on 63rd Street. A modernist mid-rise office building is vaulted over its parking garage; which is partially below street-level. Found at Cherry & 63rd. This structure and the one below are separated by their shared parking structure; seen to the left of this photo. This example is less dramatic than its neighbors but sits at the prominent corner of Rockhill Road and 63rd. It shares its parking structure with the building in the photo above. This former school building features a patterned metal screen along the lower portion of its facade on Rockhill Road. The visible structural concrete is another hallmark of modernist design. Found at Meyer Boulevard and Rockhill Road.This former church, just south of the building above, also features prominent structural concrete in its main facade and tower. The main entrance of The Landing shopping center still bears marks of modernist design, despite a number of retrofits throughout the years. Visible structural elements and a patterned concrete screen are evidence of its stylistic roots. This is another example of modernist design in a small structure. This one features a broad rectangular facade of glass shaded by a simple concrete eave and pillars. Relative locations of the featured modernist buildings along with the sites of others in that style.
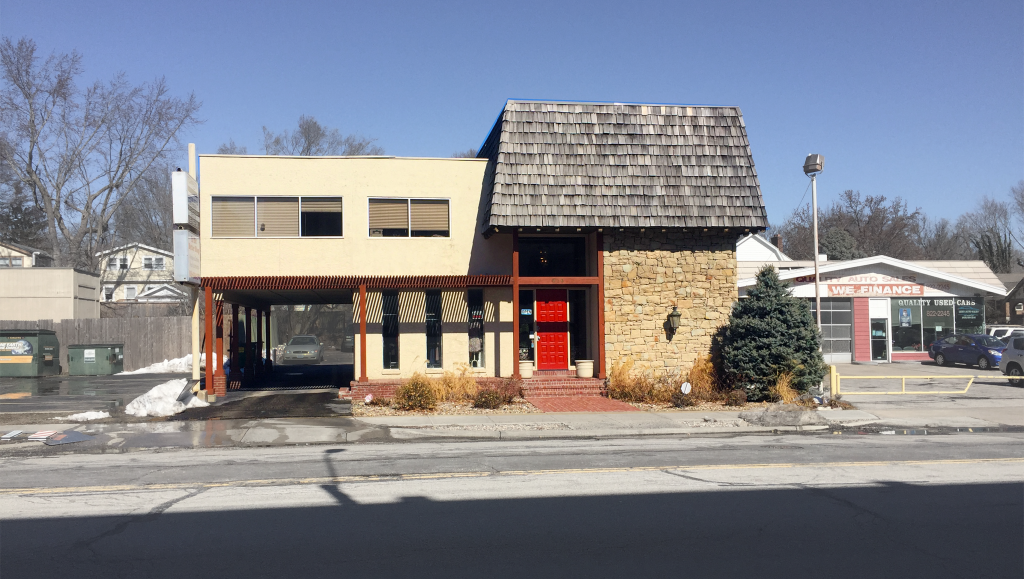
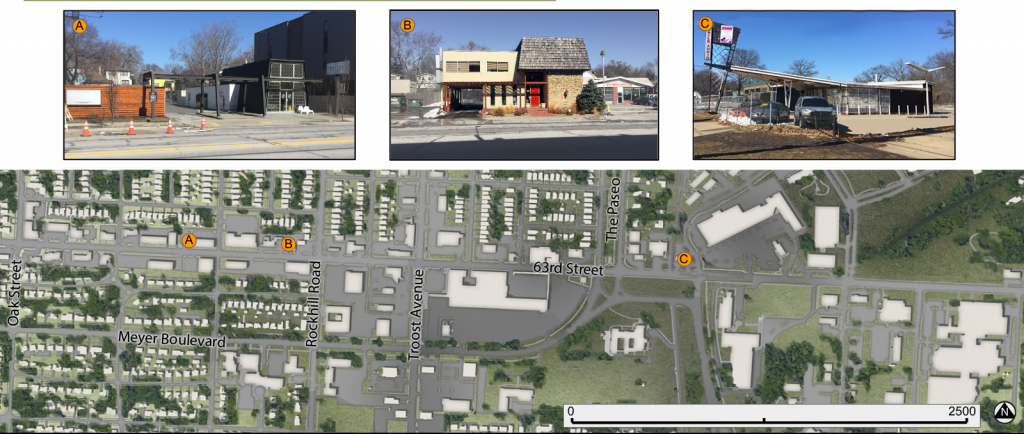
A fun subsection of modernism make a few appearances along the corridor in the form of highly stylized small structures with prominent automobile accommodations. These quirky structures bring a lot of mid-century character to the corridor and some have been re-purposed for contemporary uses.
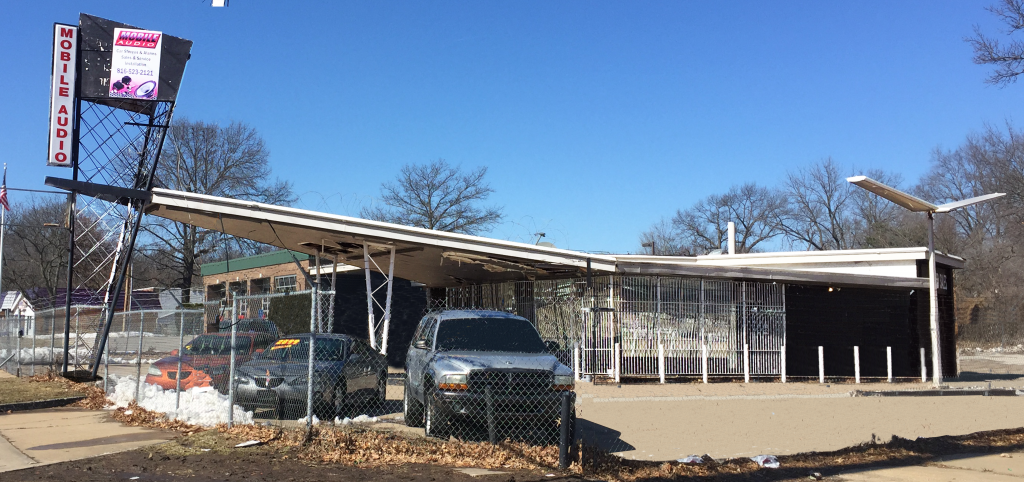
A small, truncated A-Frame structure with matching automobile passage. The glass front of this building also features a patterned screen of concrete circles.Simple modernist boxes are stacked off-center, leaving an open carport below a portion of the second floor. Just west of Rockhill Road on 63rd. This former gas station has space-age angles in its awning and sign post. Located at Bushman Drive and 63rd Street.Locations of the sub-style auto-centric modernist structures.
While there are a number of other architectural styles represented in the corridor, the dominating character is defined by these examples. Any new development in the area should look to complement these existing structures.
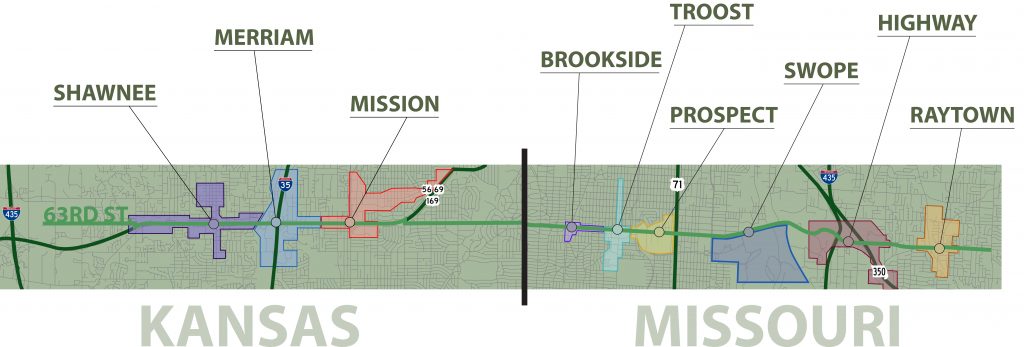
63rd Street runs almost 10 miles on either side of the Missouri-Kansas state line. On either side, the development along the corridor has a unique feel. On the Missouri side, 63rd Street starts as a road surrounded by single-family homes. First crossing Ward Parkway and ultimately coming to Brookside – it’s an urban, gridded street pattern, all the way from State Line Road to Swope Parkway. Passing the major commercial hubs at Brookside and Troost. There, the road enters Swope Park grounds, and becomes curvilinear. The mostly commercialized development along the corridor first becomes crowded by greenery before opening up into open fields. As you approach the I-435/E-350 HWY interchange, industrial uses start sprouting up on either side. Finally, the commercial developments reappear. Raytown, Missouri’s small downtown district surrounds 63rd Street at Raytown Road. The East side of 63rd Street dead ends at the Western boundary of Raytown – Woodson Road.
63rd Street Corridor Map Source: Jared Islas, 2019.
On the Kansas side, 63rd Street starts off with single-family residential homes on either side. At Nall Avenue, 63rd Street merges into Shawnee Mission Parkway – instantly becoming a suburban arterial through Mission, Merriam and Shawnee, Kansas. Shawnee Mission Parkway (63rd Street) connects to Metcalf Avenue with a cloverleaf interchange and I-35 with a diamond interchange. This, at the corridor’s most suburban point, eight traffic lanes exist. West of I-35, frontage roads appear on either side of the street. The frontage roads give access to an staggering amount of suburban commercial developments. Eventually, at Pflumm Road, 63rd Street reappears as it diverts from Shawnee Mission Parkway. After a short portion of road with more single-family homes surrounding the street, the West side of 63rd dead ends just past Maurer Road in Shawnee, Kansas and literally becomes a single-family home’s front driveway.
All of this is to say just how ever-changing the 63rd Street corridor really is. Depending on which side of State Line road you are on, 63rd Street may not even be the name of the road most associated with the corridor. The Missouri side of 63rd is more urban, the Kansas side is more suburban. The Missouri side has many distinct districts that you pass through whereas the Kansas side just feels like one large district with the only difference being the seven seemingly unnoticeable city limit changes. However, together the two sides of state line complete the 63rd Street corridor. Without either side or without any district along the corridor, it would not be the same.
Source: Social Explorer. Maps and graphs made by Bradley Hocevar
Based upon the demographic information gathered by myself and others, it became difficult to ignore the reality of the Troost divide. Glaring differences between east and west emerged when examining such things as the value and tenure of homes, access to vehicles, and educational attainment. As we began to share our findings with one another and discuss the way in which we would present the information, highlighting these differences became the most sensible way to go.
Figure 2. Heat map of work area profile from 2002-2015. Darker colors indicate a higher concentration of workers. Images and data from OnTheMap.gov. GIF by Bradley Hocevar.
However, one of the most positive findings from our research came from information obtained from OnTheMap.gov. Figure 2 highlights the significance of the Blenheim Square Research Center. This area has provided the area with high numbers of employment which brings in a number of people from outside of the study area.
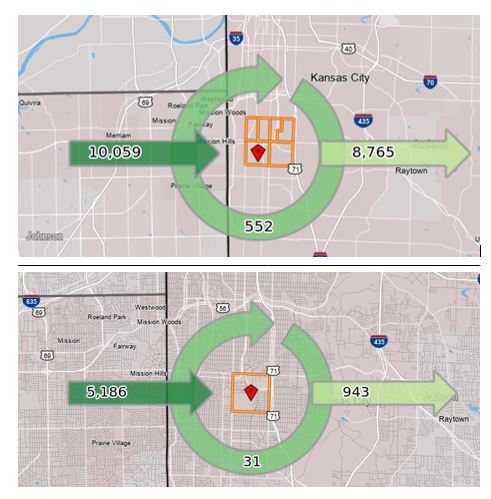
Figure 3. Inflow/Outflow diagram. Top image for all 6 tracts within the study area. Bottom image tract 87 only. Source: OnTheMap.gov
Figure 3 further illustrates this point by showing how tract 87 alone brings in more than half the amount of people who come into the area for work. 44% of these workers are employed in the health care and social assistance industry and 38% work in public administration. Furthermore, 68% of all those employed in the census tract make more than $3,333 per month (https://onthemap.ces.census.gov/). As we look for ways to improve the Landing and the community as a whole, its my opinion that close attention should be paid to how we can connect these two areas. Creating appealing spaces that will draw workers from Census tract 87 and those passing along the corridor while catering to those living in all tracts surrounding the mall is the key to revitalization.
After
completing a full analysis of our study area, there was much knowledge to even
begin to display. Looking at the most recent Census data for our six tracts, it
is seen that Troost Avenue is still a racial dividing line of Kansas City,
Missouri. As our class suspected, the tracts to the west of Troost Avenue held
a majority population consisting of whites while the east tracts were majority
blacks. This was not the only variable dividing the west and east of Troost
Avenue, but there was a stark difference in income levels, house value, vacant
structures, school attendance, and even a dramatic difference in the age of the
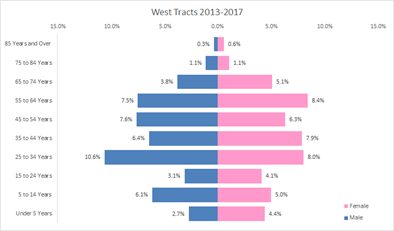
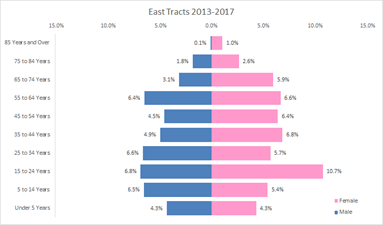
population. The differences in age groups of the west and east study tracts is
something I was not expecting to see, and it can be associated with the types
of businesses seen on both sides of Troost Avenue. Figures 1 and 2 show the
variation of age levels in the west and east study tracts. The largest percent
of population in the west study tracts lie within the age group of 25-34 years
old. However, the largest percent of population in the east study tracts lie
within the age group of 15-24 years old. The west study tracts have fewer
children and a larger mid aged population, while the east study tracts have
more children and a more equal distribution throughout the age groups.
Figure 1. Population Pyramid of East Study Tracts created by Cristina Aurich 02/2019Figure 2. Population Pyramid of West Study Tracts created by Cristina Aurich 02/2019
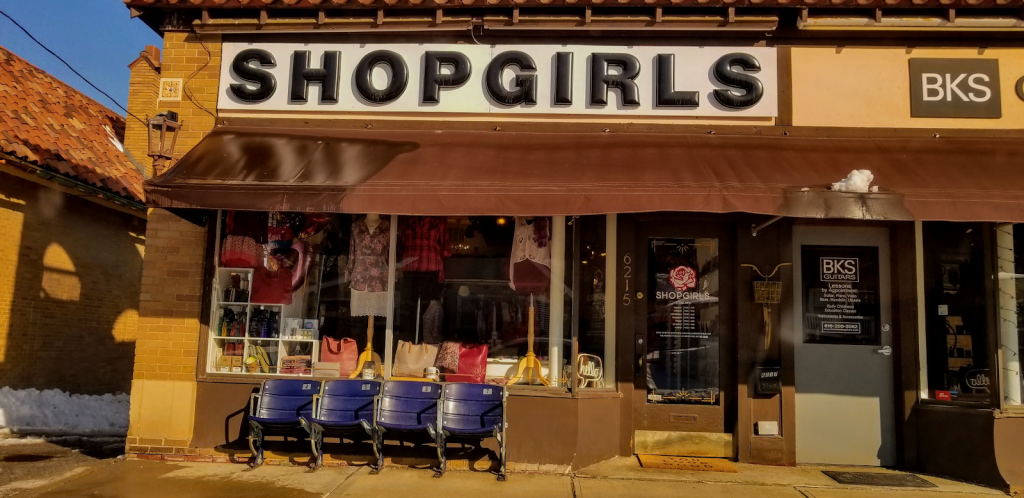
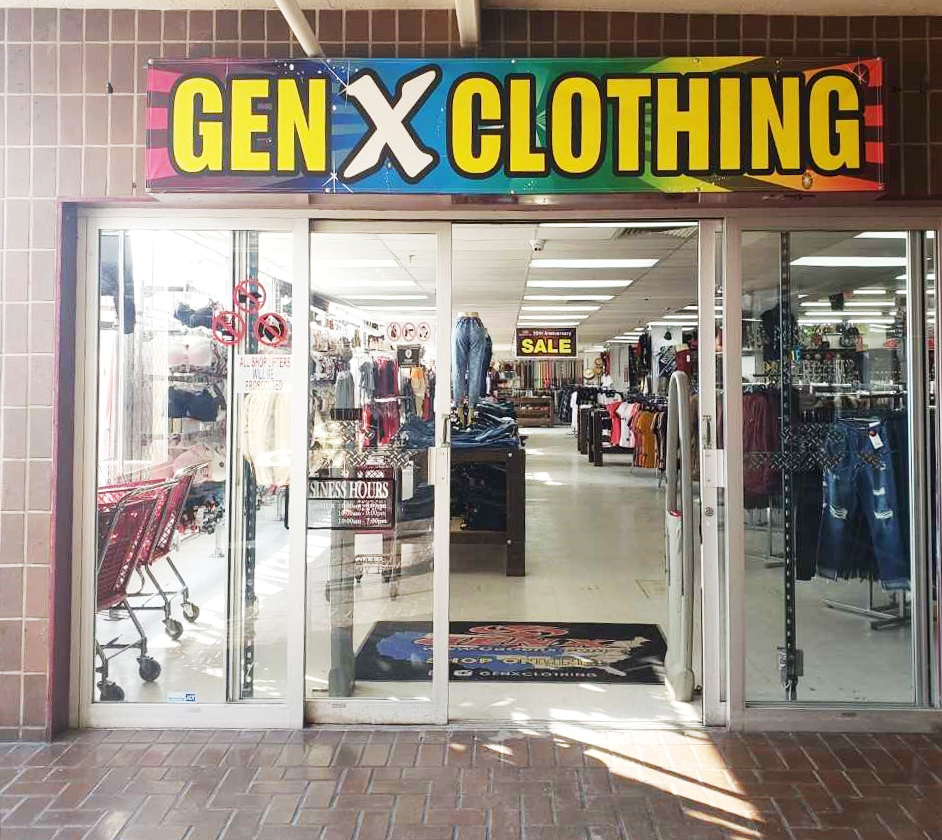
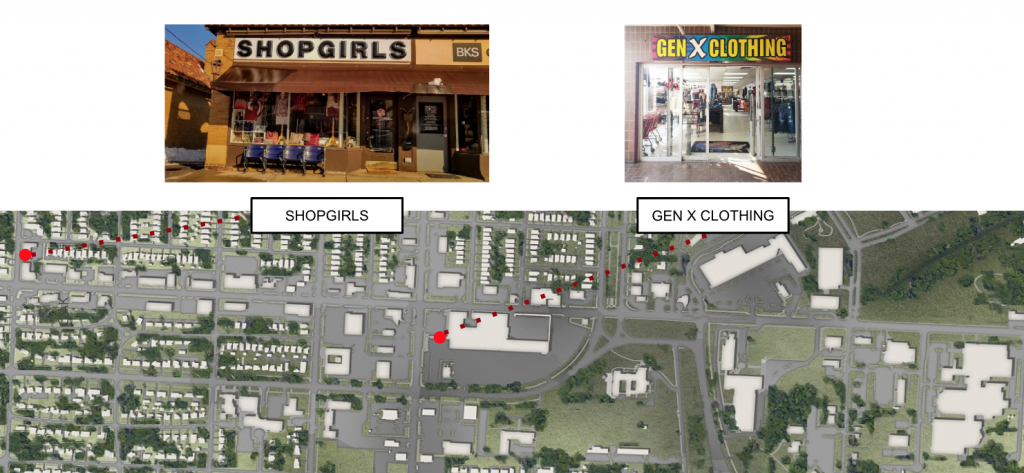
The difference in age across Troost Avenue is relatable to the types of businesses in our study area. Within our six tracts, I was able to only find five child day care services, from looking at Kansas City’s active business license, and all five were located in the east study tracts. Another big finding, relating to age and businesses, were the different clothing stores. Figure 3 shows a typical clothing store that can be spotted in the west study tracts and figure 4 shows one that can be observed in the east study tracts. The west study tracts are filled with locally owned boutiques with pricey, one of a kind, high quality material clothes. Compared to clothing shops in the east study tracts, which consist of factory made, low quality material, disposable clothes. An older population generally buys for long term and a younger population buys short term.The difference in age across Troost Avenue is relatable to the types of businesses in the study area. Within our six tracts I was able to only find five child day care services, from looking at Kansas City’s active business license, and all five were located in the east study tracts. Another big finding relating to age and businesses were the different clothing stores. Figure 3 shows a typical clothing store that can be spotted in the west study tracts and figure 4 shows one that can be observed in the east study tracts. The west tracts are filled with locally owned boutiques with pricey, one of a kind, high quality material clothes. Compared to clothing shops in the east study tracts, which consist of factory made, low quality material, disposable clothes. An older population generally buys for long term and a younger population buys short term.
Shop Girls Boutique in East Brookside taken by Bryce Morgan 02/2019 Gen X Clothing Store Inside The Landing Mall taken by Cristina Aurich 02/2019
Overall, looking at all the business license within our study tracts, there were similarities in the top business types for both the west and east study tracts. Professional scientific & technical services, salon/barbershops and commercial & institutional building construction businesses were at the top of the list for businesses on each side of Troost Avenue. Overall, looking at all the business license within our study tracts there were similarities in the top business types for both the west and east study tracts. Professional scientific & technical services, salon/barbershops and commercial & institutional building construction businesses were at the top of the list for businesses on each side of Troost Avenue.
The site of The New Landing Mall lies at a major hub of transit and activity along Troost and the 63rd St. Corridor. It is surrounded by several diverse neighborhoods. When we examine data from the census and American Community Surveys, the demographic differences between the census tracts on the east and west sides of Troost become very obvious. In the year 1950, the population of all 6 census study tracts were approximately 99% white residents. Within a few decades, a dramatic shift had taken place as a result of events such as blockbusting and “white flight.” By the year 1980, the population west of Troost had remained over 90% white, while the population west of Troost was made up of 56% white in Tract 87, 20% white in Tract 81, and only 6% in Tract 80. This graphic clearly represents the stark difference in the racial makeup that exists on each side of Troost Ave. in the present day.
Racial Makeup
Figure 1. Orange dots represent “white alone” population, blue represents “black alone” population. Map Courtesy of Ryan Deeken
Income
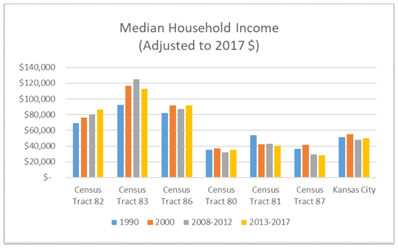
As well as a difference in race, we can observe a substantial difference in median family and household incomes in our study tracts as well. The tracts west of Troost have both median family and median household incomes that are significantly higher than the study tracts on the east. The study tracts on the east, however, are much more in line with that of Kansas City as a whole.
Figure 2. Median Family Income Figure 3. Median Household Income
Education
There seems to be a strong correlation between levels of education obtained and median incomes. Within the tracts that exist east of Troost less than 47% of people over 25 years old received college degrees or partial college education. Comparatively, within the tracts west of Troost, the over-25 population had achieved much higher levels of education. Between 48% and 87% in Tract 86 had some college education and in Tracts 83 and 82, up to 93% of the population had at least some college education.
Age
The is an interesting difference in age makeup within the populations east and west of Troost. The tracts west of Troost have a higher percentage of residents in the 25-35year age cohort and the tracts east of Troost have a higher percentage of younger residents, age 15-24years old. All 6 census study tracts as well as Kansas City and its metro as a whole, are experiencing an increase in aging population. The age cohorts over 65 years old currently make up more than 12% of the population.
Figure 4. Graph courtesy of Cristina Aurich Figure 5. Graph Courtesy of Cristina Aurich
The Boulevard and Parkway Standards are essential to connecting the 63rd street Corridor to the rest of the city. Several Streets fall under the parks and boulevard system within the area such as Brookside Boulevard, Rockhill Rd, Holmes and Gregory Boulevard. The two main roadways within the study area spoken of within these guidelines are The Paseo and Meyer Boulevard. The Report addresses the area along both roadways as being mostly residential and reflecting elements in the city.
63rd Street Capital Improvement Plan (2011)
The 63rd street capital Improvement plan assesses four “villages” that could bring cohesiveness to the 63rd Street Corridor, these include; Brookside, Oak, Troost and Prospect. Troost Village – largest area of commercial activity along the corridor and the one where public transit is most apparent. It Discusses the urban form along the corridor being more pedestrian friendly and urban West side, more auto-centric and suburban East side. The plan states that the Troost Village lacks “human amenities” and identifies the corridor’s incentive programs.
Troost Corridor Redevelopment Plan (2013)
The plan, constructed in 2013, covers Troost Avenue and its immediate surrounding environments. One of two focus intersections, the landing mall has been a major asset to discussion in the Troost Corridor redevelopment plan. Evaluation of the intersection at Troost and 63rd Street recognizes that the location has potential and gathers members of the community to obtain their input. The final plan for the intersection is a combination of the community ideas where the original street grid is introduced to create a more walkable environment.
Swope Area Plan (2014)
The Swope area plan recommends pedestrian oriented improvements along 63rd Street, Troost, Meyer and Prospect. 63rd Street and Troost are primary image streets.The assessment sees that there is a primary transit corridor along 63rd Street and Troost and other possibilities at 63rd & Troost and 63rd & Prospect. The plan pushes for to exploration for a 63rd st. MAX bus line. It also refers to 63rd, Troost, Meyer, Paseo all being major streets apart of the KC major street plan. The idea to create mixed use “villages” at Troost and Prospect along 63rd is brought to light within this plan.
63rd Street Corridor PIEA Planning Area (2015)
The PIEA plan exists entirely west of Troost. It seeks to increase number and size of buildings (commercial and residential), and parking lots. Design guidelines call for opaque fabric awnings, brick and stone buildings. Some elements are not allowed such as chain-link or wire buffers, plastic, aluminum, or wood signs. Landscape buffers are required between single-family and multi-family units and between single-family and commercial units. Architectural features should have proportions complementary to the overall building massing. Project assistance and incentives include up to 25 years of tax abatement, sales tax exemption on construction materials during the construction process and power of eminent domain.
Country Club / Waldo Area Plan (2018)
The Country Club and Waldo Area plan recommends pedestrian oriented development and zoning practices as well as a road diet along 63rd street. The plan identifies 63rd Street as a “Corridor” and the block to the west of The Landing as a “Node.” It also categorizes 63rd Street, Meyer Boulevard and Troost Avenue as “Primary Image Streets” and categorizes Brookside, Wornall, Troost and 63rd Street as “Major Transit Corridors.” The plan also calls out the intersections at 63rd & Rockhill, 63rd & Troost, 63rd & The Paseo and Meyer & Troost as “Difficult Street Crossings.”
Figure 1. Map showing the transit connections intersecting the 63rd street corridor
The 63rd street corridor, and more specifically the Landing sits at an important conglomeration of intersecting transit lines. This abundance of transit infrastructure allows many of those without vehicles that live in the area access to many of the jobs to the north along the main street corridor. Figure 1 above separates these transit routes by peak period frequency, where the red lines also are known as Kansas City’s bus rapid transit (MAX) arrive at a frequency of every ten minutes. The red line along Prospect Avenue is the newest MAX line currently being installed and is expected to be fully operational by the end of 2019.
Figure 2. Regional Transportation Connections
Taking a regional approach to these connections, figure 2 shows the ability of those living in the 63rd street corridor to reach other parts of the Metro area. This connectedness is seen in both the abundance of vertically and horizontally moving routes and the access to Bruce R. Watkins (US 71) Highway almost exactly a mile from the 63rd and Troost intersection. Interestingly enough, the Landing was built before the placement of 71 highway, showing the area is even more connected than when it was first designed. However, looking at figure 2 again, there are empty spaces of white, meaning that that area does not exist within a quarter mile or walkable distance from a KCATA bus stop. Within the 63rd Street corridor, there are several gaps the most detrimental being the one in between the 55th and 63rd, Paseo and Prospect lines, just west of 71 highway and just northeast of the Landing. This is an area with strong usage of the bus routes and this gap strongly inhabits the populations ability to use this abundant transit.
When thinking about the current transit conditions of this corridor, it is important to also look into the possible future impacts that come with it. One of the best ways of doing this is to look at long range plans like the corridor’s two area plans the Country Club Waldo Plan and the Swope Plan. The newest plan, the Country Club Waldo Plan encompasses the western portion of the corridor and recommends: the building of a new trail through the landing; a continued focus on 63rd as a major transit corridor; and to treat the intersection at 63rd and Troost with an activity street typology. The Swope Area Plan takes up the remaining eastern portion of the corridor and recommends (out of a lot of great transit initiatives): the exploration of an east to west 63rd street MAX line; a long term strategy of identifying a fixed rail alternative along the 71 highway corridor; the building of a town fork creek trail, in line with the Country Club Waldo Plan; future streetcar connections to the trolley track trail; and the identification of 63rd and Troost as a major activity and transit center, as well as pedestrian zone, that should be considered for transit-oriented development (TOD)
After putting the current conditions altogether with the future vision for the area set forth by the city, one sees what may become of the 63rd Street corridor and the all important intersection at 63rd and Troost.
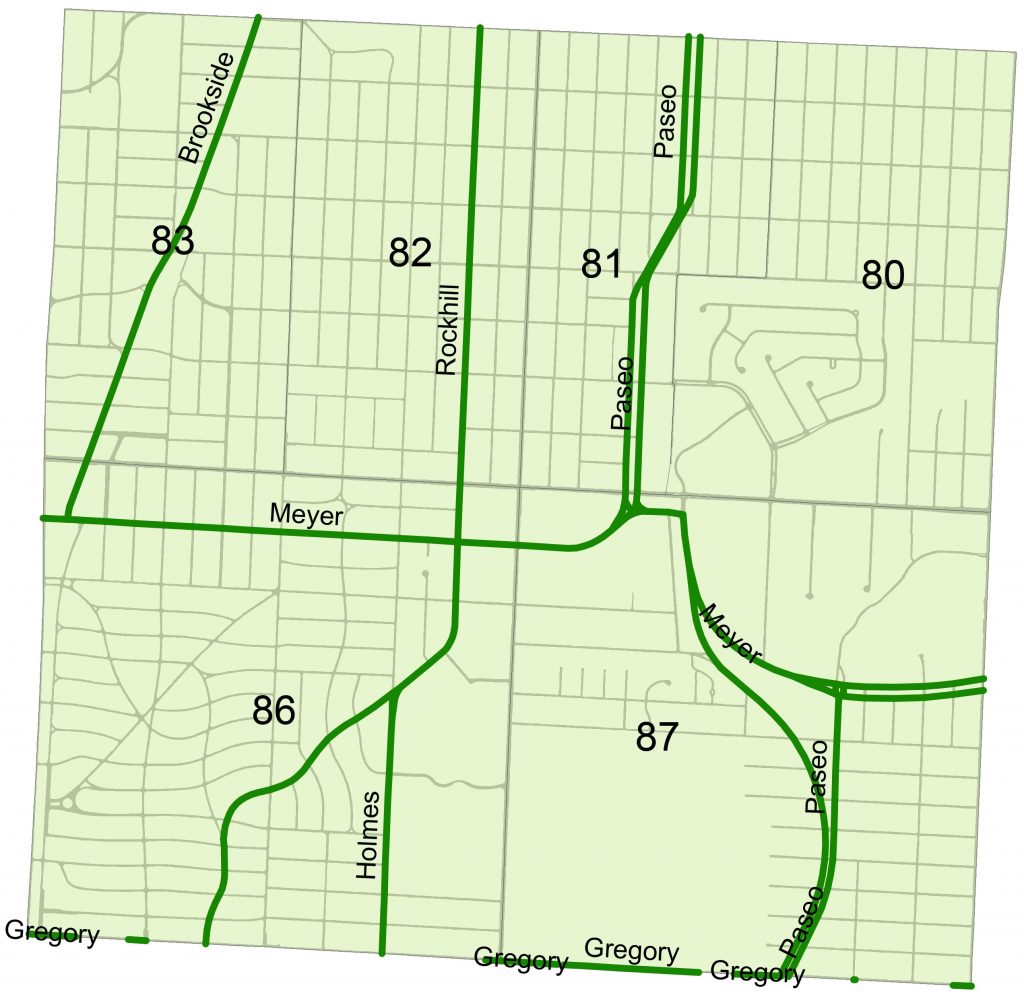
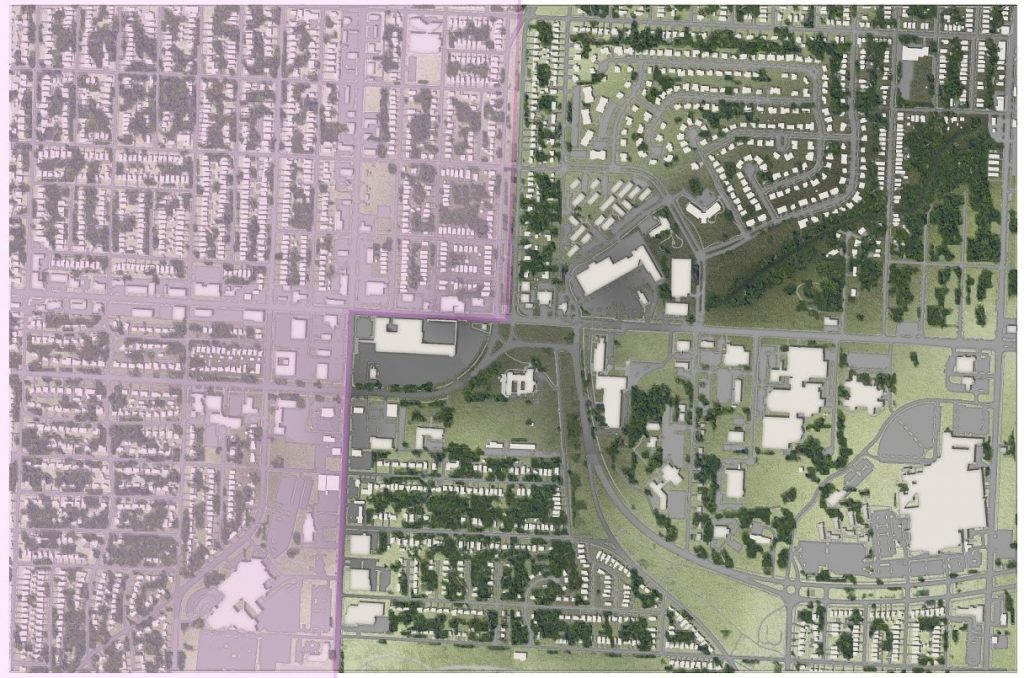
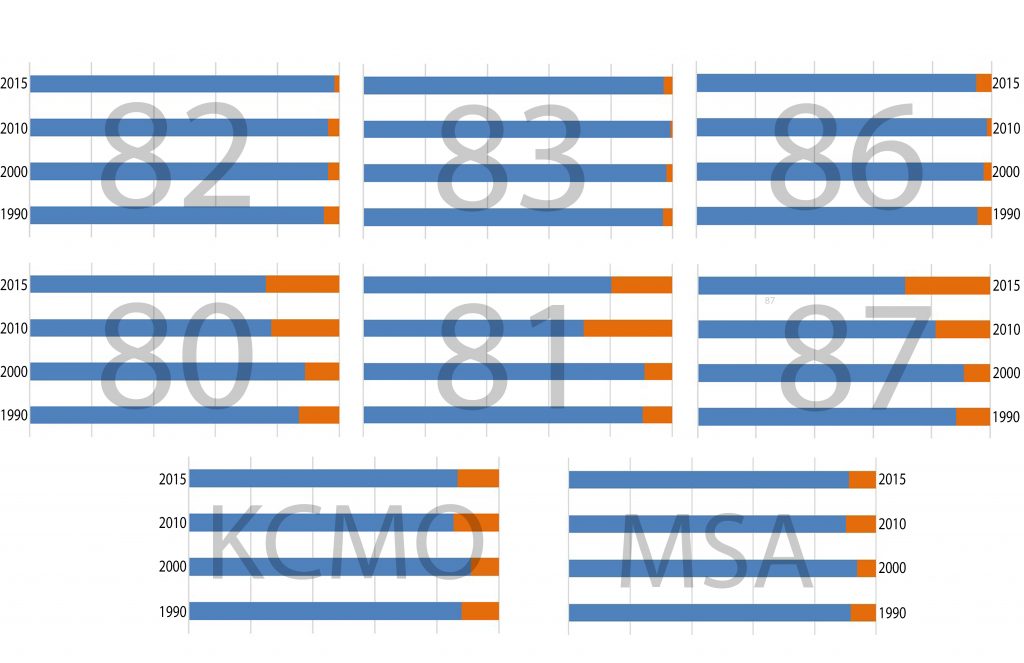
When looking at the census tracts within our study area – 80-83, 86, and 87 – the vacancy of eastern tracts versus western tracts was astonishing. After looking at the housing units in structure over the years and the vacancy, I pulled up ownership in the area to see who was actually living in the houses they owned. This was done through www.kcparcelviewer.com and it was a good way to see who all owns properties in the area. For a refresher, the vacancy has been shown below. The western tracts are 82, 83, and 86, and the eastern tracts are 80, 81, and 87.
Percent Vacant of Housing Units in Structure. Made by Adair Bright
In order to gather the data for ownership in the area, I downloaded excel files and then highlighted all the out of state owners. This means there could be in state owners who still do not live in the area. Therefore, the percentage is a rough percentage but it gets the point across. So, for the eastern tracts, about 18.9% of the parcels are owned by people, companies, or trusts, that are not located in the state of Missouri. For the western tracts, only about 5.8% of the parcels are owned by people, companies, or trusts, outside the state of Missouri.
To me, the correlation between the two makes perfect sense because out of state owners are not necessarily concerned with filling property – especially if the parcel is owned by a company or a trust. This means the neighborhood needs to take back their parcels or make the owners of those parcels fill them or at least take care of them. All in all, I think the contrast between east and west is sad and it should not be because the housing stock is very similar and the vacancy and ownership rates should not be that different.
Over the past couple of weeks, we have been discussing the 63rd street corridor from Oak to Prospect in hopes of uncovering the true potential of the Landing Mall plot. This has not been without controversy or without opposing opinions, but through discussion comes understanding.
The section of 63rd covered is on the edge of a major divide between both race and economic status, Troost being the official-unofficial dividing line. Thus when doing a visual survey on foot, there was an expected difference between East and West.
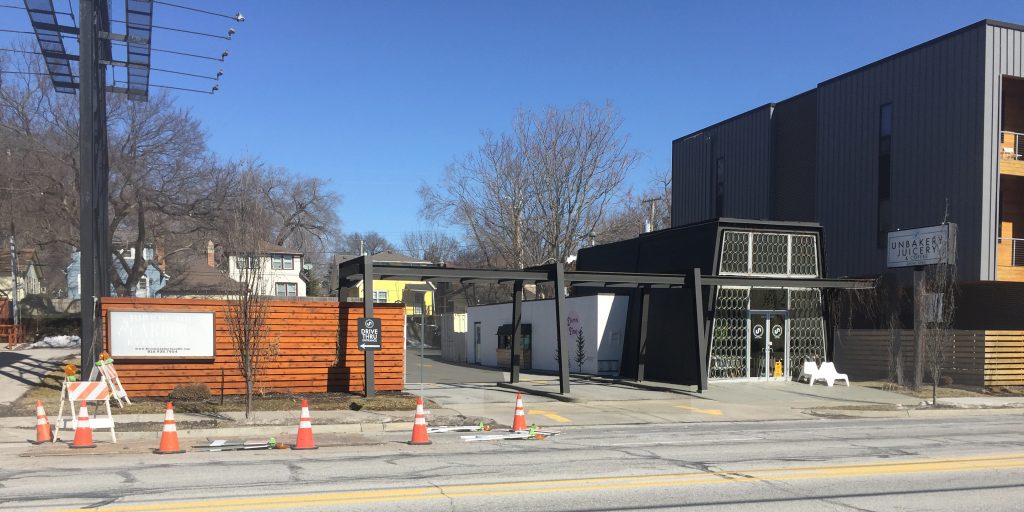
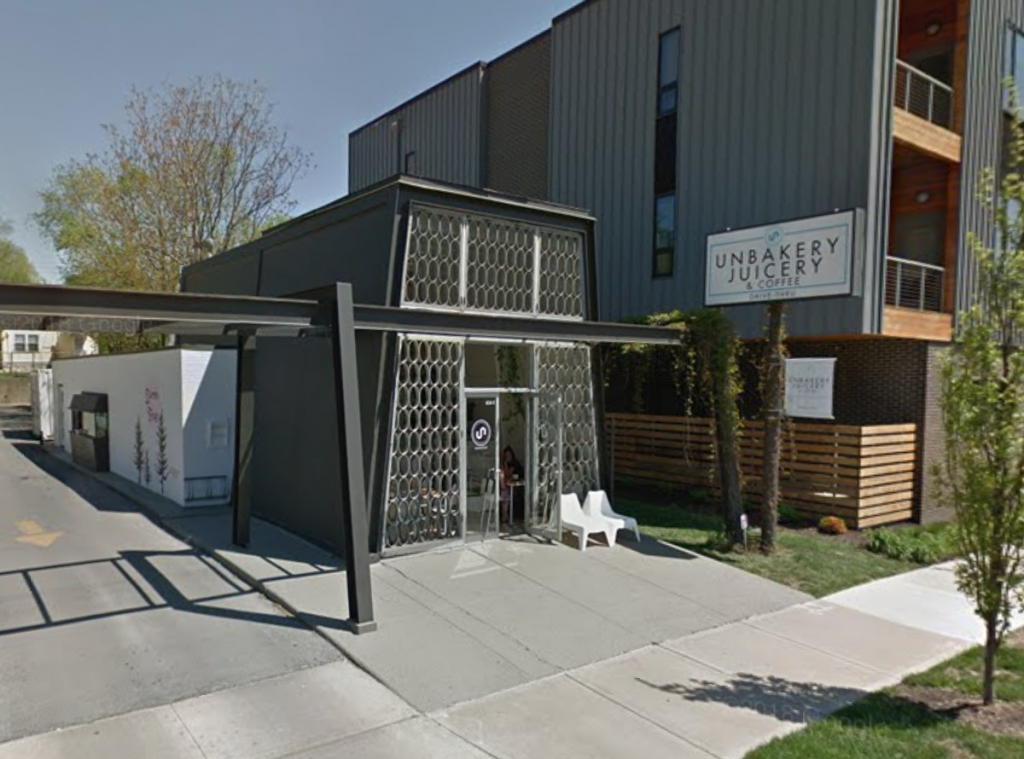
The west side of Troost has undergone a major upgrade of visual facades as well as the addition of some new businesses; bars, bakeries, shops, etc. But unfortunately, the east side is not that lucky.
A new bakery that opened up on the west side of Troost called the Unbakery.
The east side is home to a different landscape, one of many vacant buildings and run down shops. Though the visual differences are substantial the real difference is something much more important but not talked about much.
A visual illustration of the locations of similar types of businesses.
My theory is that the landing has morphed into what it needs to be. It may seem like the mall is doing bad and surrounding businesses are lesser but that is not the case. The truth is that the market for some businesses are different in areas of low income and/or majority race. When we see a Gen-X and think that is a run down place that needs to be replaced with a ShopGirls, people around in the community see affordable clothing that suits their style and flavor.
The West and East side have different economies that are the way they are because of the free market. If anything were to change within the Landing, rents might go up and businesses once essential to the community would be replaced with gentrifying, destined to fail, white-washed ventures that will eventually all leave and lead us right back to where we are now. That is one outcome, the other is that the area after the mall gentrifies will then also gentrify. This is something that happens all the time, yes it would be GREAT for the area to see reinvestment, but that also means displacement among the surrounding community which is not GREAT.
The survey brought up a very different opinion and mindset for me going forward and looking at what to do for the landing has become very difficult. I am at a moral impasse and I am tempted to say do not do anything.
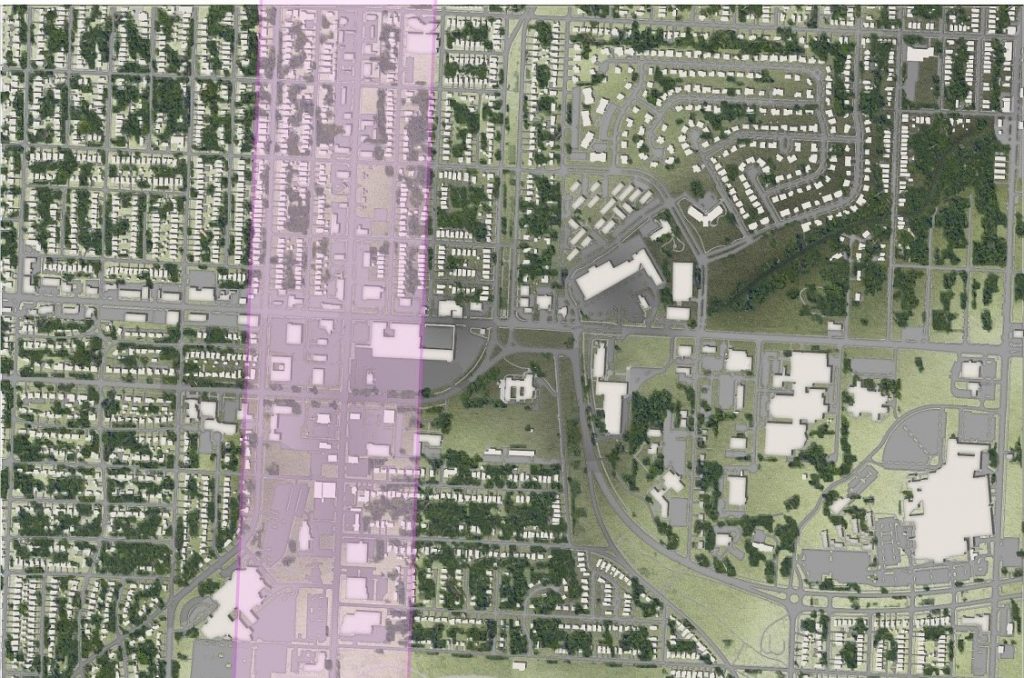
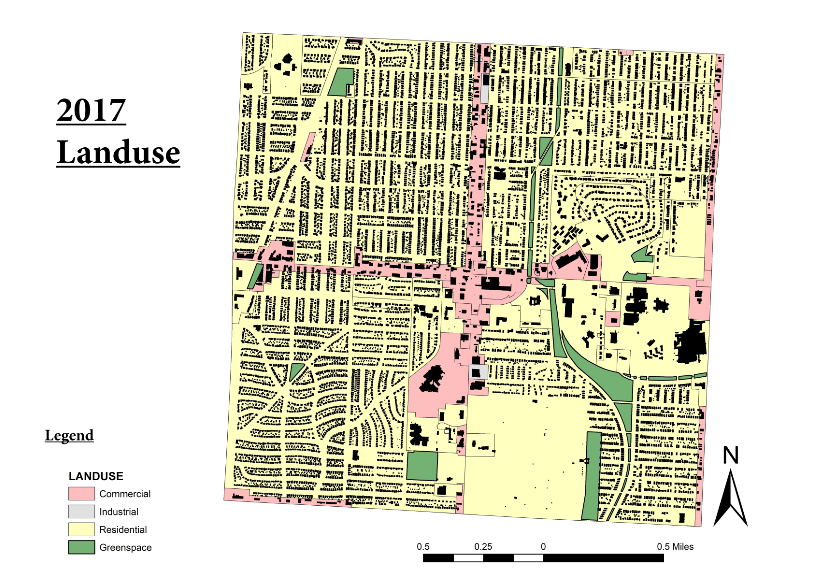
Figure 1. Land use zoning map. Created by Bradley Hocevar
Figure 1 highlights several key land use aspects which creates a better understanding of where homes are located around the Landing Mall. Commercial zoning is located along Troost Ave. and 63rd St with two small industrial areas located at 56th and 66th St. Green spaces are located along the parks and boulevard system as well as throughout residential neighborhoods. Surrounding the commercial areas are those marked for residential. However, it should be noted that in the southeast section, a large portion of the area is occupied by the Forest Hill Cemetery and the Research Medical Center.
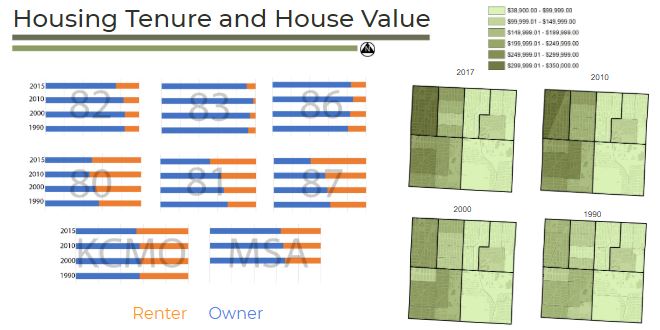
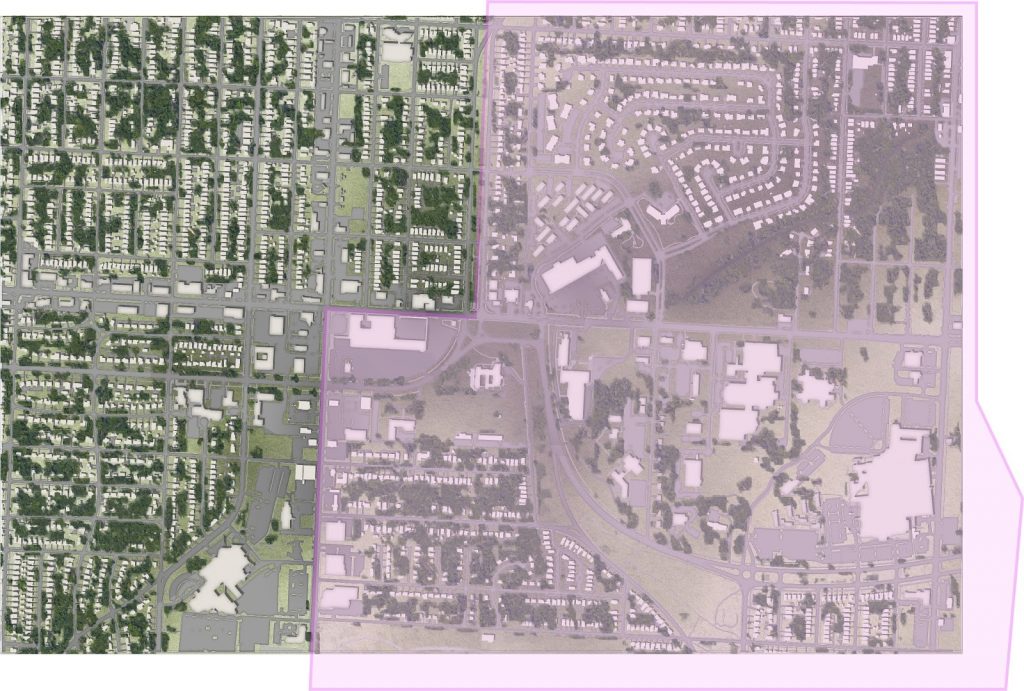
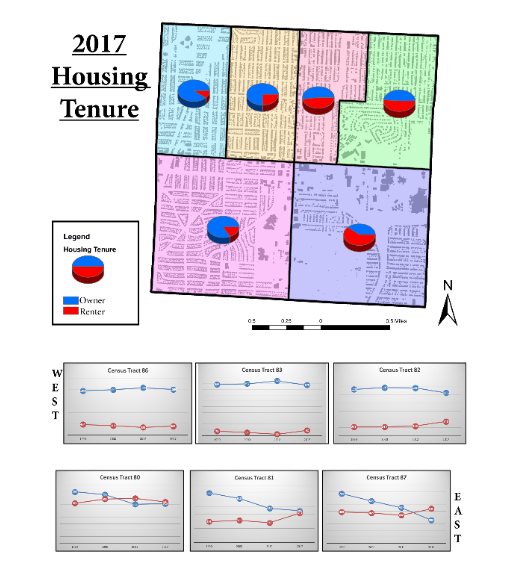
Figure 2. Housing tenure from 1990-2017. Maps and Graphs created by Bradley Hocevar. Source: Social Explorer
When examining the difference in renter occupied housing units and owner occupied unites within the area some notable patterns take place. As seen in Figure 2, the number of homeowners far exceed that of renters in census the tracts located west of Troost Ave. This trend has consistently stayed the same over time since 1990 as seen in the line graphs shown below the map. The tracts located east of Troost has seen homeownership decline since 1990 with only Tract 81 having less renters than homeowners in occupied units.
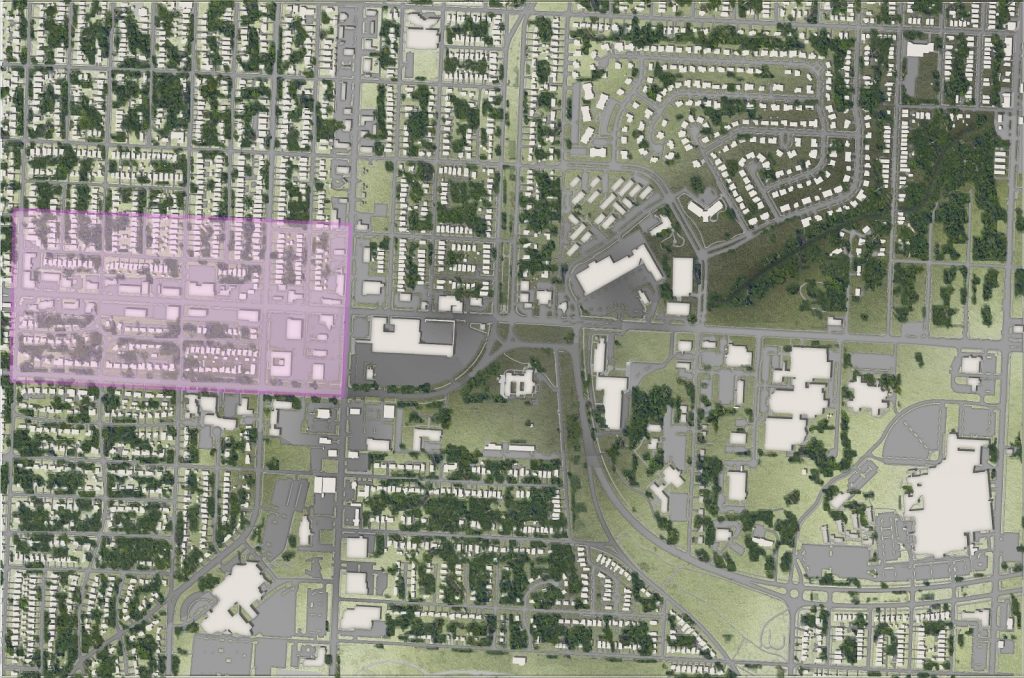
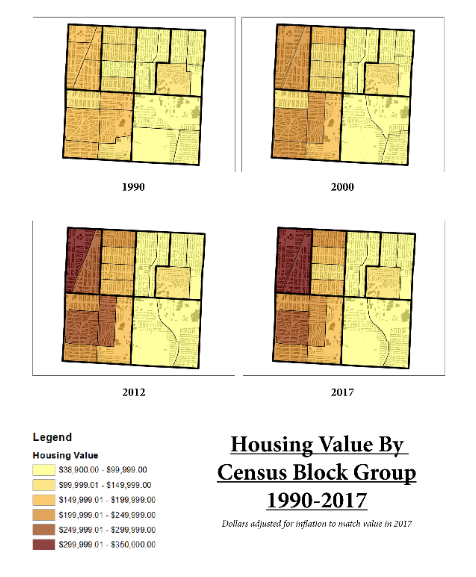
Figure 3. Housing Value From 1990-2017. Map Created by Bradley Hocevar Source: Social Explorer
In addition, the value of homes has steadily increased in the tracts located west of Troost. By viewing the values at the block group level, one can view how the prices of homes have changed within each neighborhood. For instance, the Morningside neighborhood located in tract 83 has become one of the most expensive neighborhoods in the area. The value of homes in the Citadel neighborhood Located tract 80 has consistently stayed the same since 1990. Tracts 81 and 82, which make up the 49/63 neighborhood coalition has seen little change east of Troost but has fluctuated over time on the west side. This division in value of homes can also be viewed below.
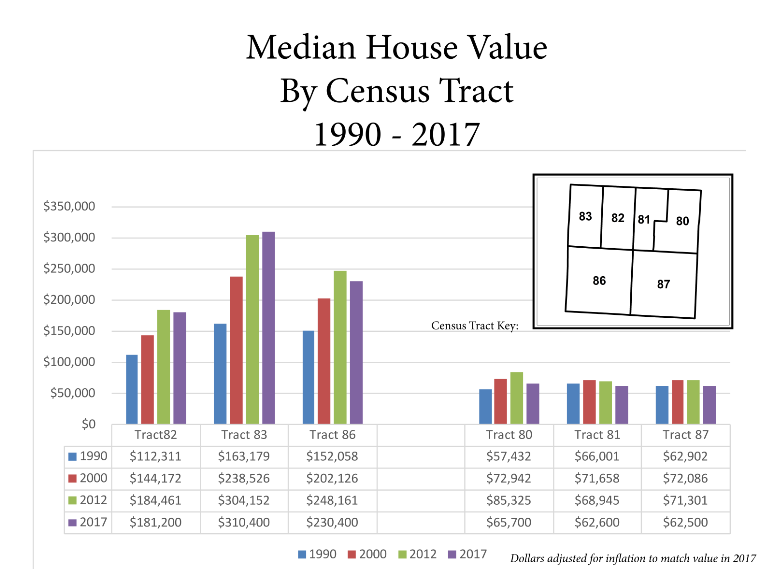
Figure 4. Median House Value by Census Tracts from 1990 – 2017. Graphs created by Bradley Hocevar Source: Social Explorer