I started with the base present day GIS file, I made sure that the buildings on the GIS file matched up with Google Earth. Next, I obtained the historical images of the site. For each image I overlaid the information on top of the original files and added and deleted files as needed. I noticed that there was a building boom from 1890 to 1920. 1920-1950 seems to be the peak of development for this study area, in the present day map there are less structures than there were 70 years ago. This is the most noticeable when looking at either side of Flora Ave. At its peak, there was a house on every parcel on both sides of the street, but today there are less houses. I also thought it was interesting that the parcels south of 31st Street between Flora and Wane Ave never was developed. To this day it is still vacant. I also thought the corner of 30th and the Paseo ave. was interesting in how the shape and size of the building changed over time. Throughout history this building has been one of the most notable features in the two block area.
I would characterize this area as mostly residential, both single and multifamily residential fills most of the area, with a few larger non residential buildings below 31st St. There are a few buildings that still stand from the 1940s Tax assessment photographs. I included two below, one of a single family home on Flora ave, and a large apartment building on Paseo ave. Most of the houses in this area were built in the 1980s. The largest landmark would be Troost park, to the west of my study area. The large apartment buildings and the buildings south of 31st st. Overall, I found the history of this area interesting, it has always been largely residential, with higher density structures on the east side of Paseo ave. and along the 31st st corridor.
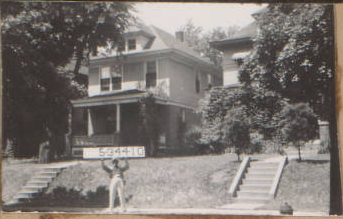
1940: 3027 Flora Ave 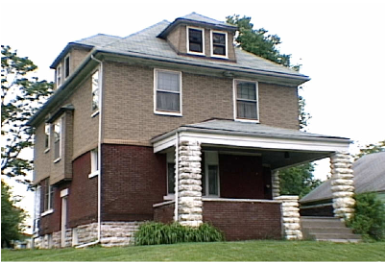
2010: 3027 Flora Ave
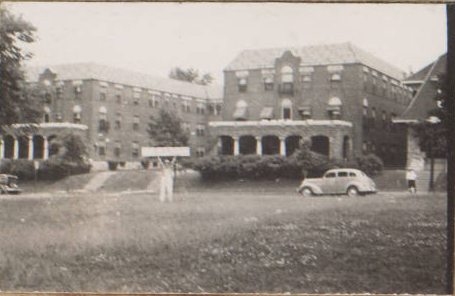
1940: 3015 Paseo Ave 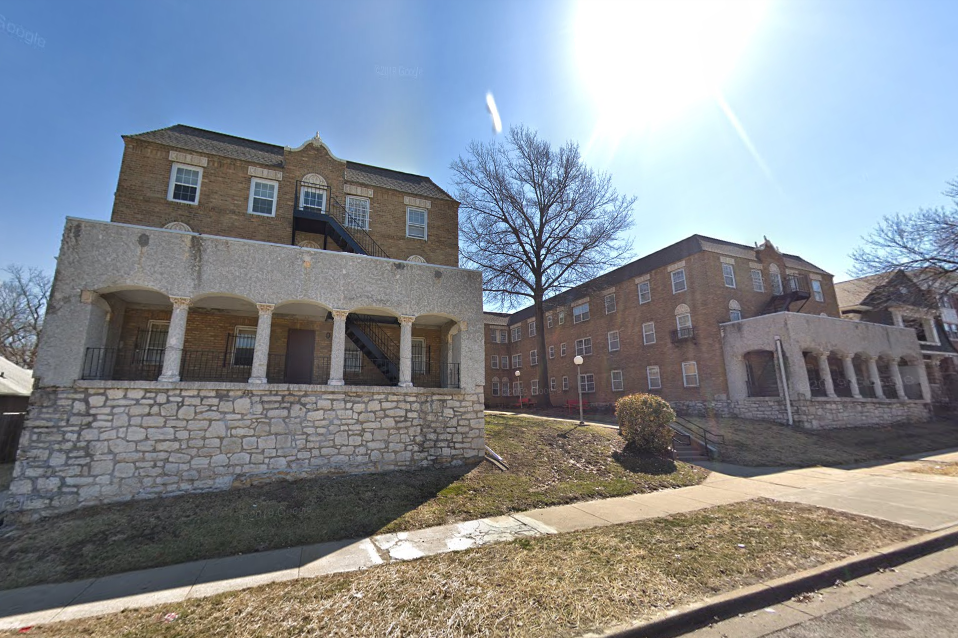
2020: 3015 Paseo Ave