With time comes change. Looking at census data from 1990 to the most recent American Community Survey (ACS) from 2013-2017 changes in population are evident. I looked at the 6 census tracts surrounding the Landing Mall, tracts 80-83, 86, & 87. Slight transformations have occurred within the 6 tracts over the last 30 years. The Landing Mall is located in census tract 87 and has maintained its low population density over the years. Forest Hill Calvary Cemetery and Research Medical Hospital each takes up a quarter of the land on tract 87 which explain why this tract is continuously shown in the lightest blue in figures 1-4. The most dramatic changes are seen between figure 1 and figure 4.
Tracts 80 and 86 went from a deep teal to 2 shades lighter indicating lost in population density.
Figure 3. Population Density (per square mile) 2010 for census tracts 80-83, 86, & 87 created by Cristina Aurich 02/2019 2010
Figure 4. Population Density (per square mile) 2013-2017 for census tracts 80-83, 86, & 87 created by Cristina Aurich 02/2019
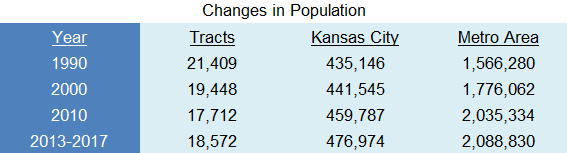
Table 1 displays the comparison in population in the 6 tracts of study, Kansas City, and the Metropolitan area. Kansas City and the Metropolitan area have been in parallel with each other and continue to grow in population. Whereas the 6 tracts of study have been steadily decreasing until recently. From 2010 to 2013-2017 Kansas City has seen almost triple the population growth, in less time, than it saw from 1990-2000. Though people have left the area of 63rd Street and Troost Avenue in the past, they are beginning to return. This is a good sign for redevelopment of the Landing Mall and future development of the surroundings.
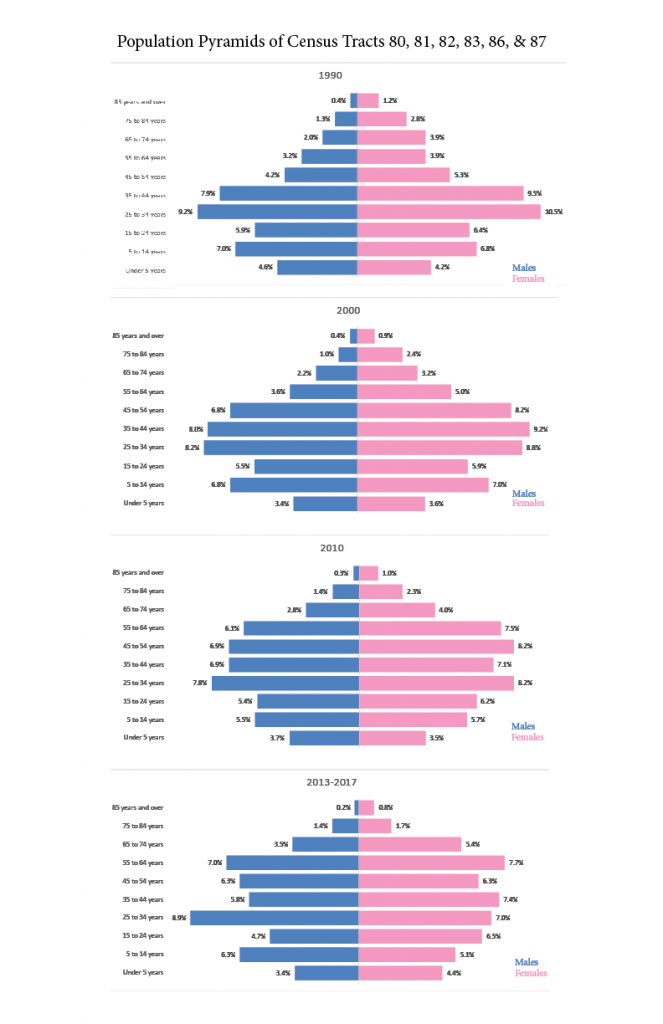
Figure 5 displays the age groups of the population living in the 6 study tracts. Looking at the pyramids, the highest number of population continues to lie within the age group of 25-34. However, looking at the population pyramids from 1990 and 2000, the population continued to grow to the next class causing the pyramid to swell towards the top. The newest population pyramids from 2010 and 2013-2017 show the population spread more evenly throughout the classes. The population of those living in the class of 65+ years has been growing since 2000, which is also a trend seen through the Metropolitan area.
Simply knowing the statistics of population and age in surrounding neighborhoods can lead to better planning. This is a tool that seems to be forgotten too often when planning with the people in mind.
Are all of the tracts losing population at the same rate? Do the population pyramids look the same for each tract?