Following up on some of work covered in our studio over the past few weeks, this assignment was designed to compile all of our findnings, and collectively synthesize what these findings meant for the future of the Parks and Boulevards System. After a group SWOT analysis, specific focus topics were identified and assigned for an in-depth analysis
PARK SYSTEM METRICS
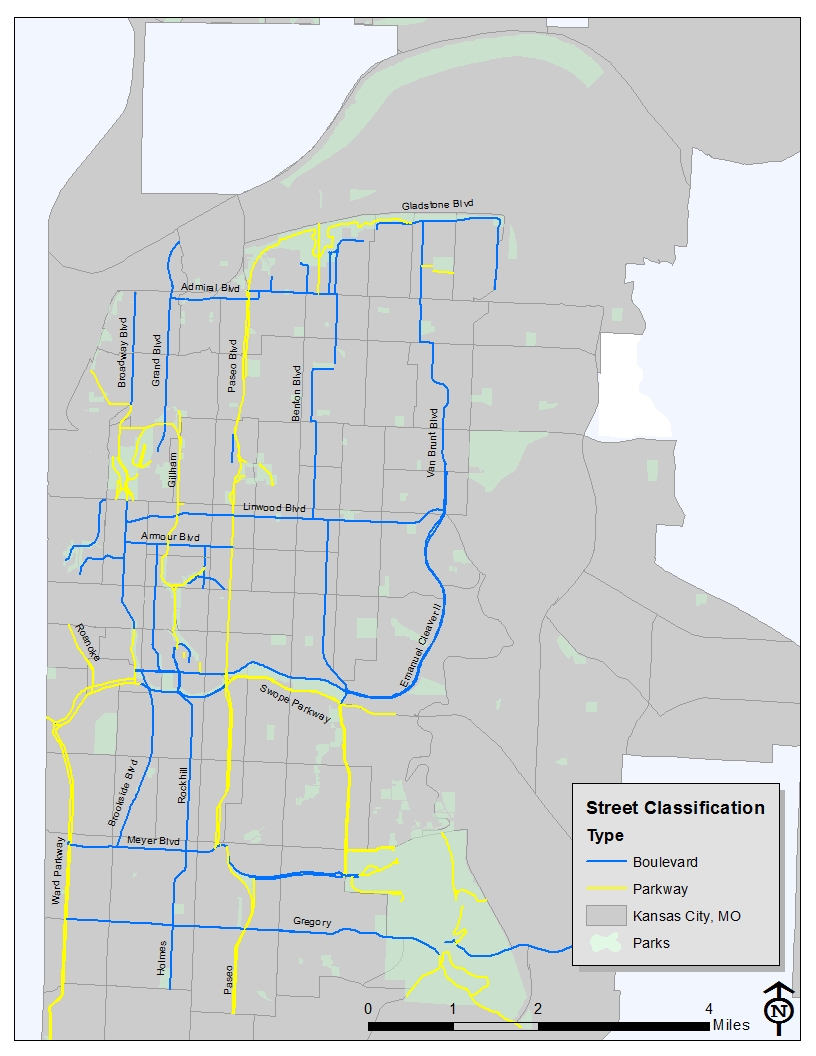
The analysis of Park System Metrics looked at the system as a whole, and focused on the distribution of parks and boulevard and related ameinities throught the Kansas City area. Here, parks and boulevards were identified and categorized based on a number of attirbutes. Figure 1 shows the location and differentiation between parkways and bouevards throught the system. Note how the Parkways seems to offer a “direct route” to a destination, more or less, while the Boulevards tend follow more of an organic, free-flowing pattern.
Figure 1: Boulevards and Parkways Classifification
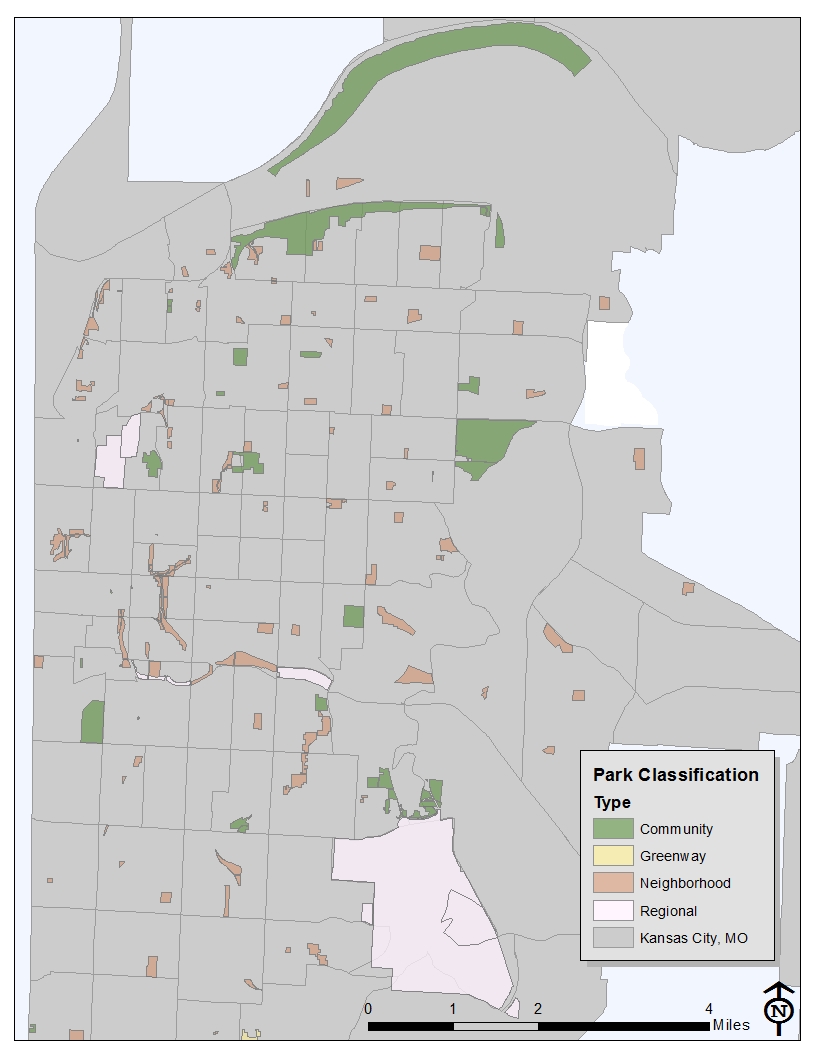
Kansas City’s Parks and Recreation Department categorize park space into four classifications: Community Parks, Neighborhood Parks, Regional Parks, and Greenways. Figure 2 shows the distribution of these park types in Kansas City. The majority of park space, in terms of total number of parks, in Kansa City appears to be neighborhood and community parks, and are spread sporadically throughout. The southern
Figure 2: Kansas City Parks Classifications
As you can see, the majority of parks are classified as either neighborhood or community park space. There appears to be a nice balance of regional park space in ares of souther Kansas City, as well as the Midtown area, however, the northeastern portion of the city seems to lacking this type of development.
PARKS AND ECONOMY
This analysis looked at the effects that the Parks and Boulevard system plays in Kansas Cities economy. In the last assignment, I looked particularly at median household income level throughout Kansas City at the census tract level. The findings in that research showed a relationship between amount of available park space and income level, in the sense that census tracts with more park space, or even a higher concentration of park space were often associated with higher income. In the case, I focused in on property values per parcel, both surrounding park space, and in areas with less park space.
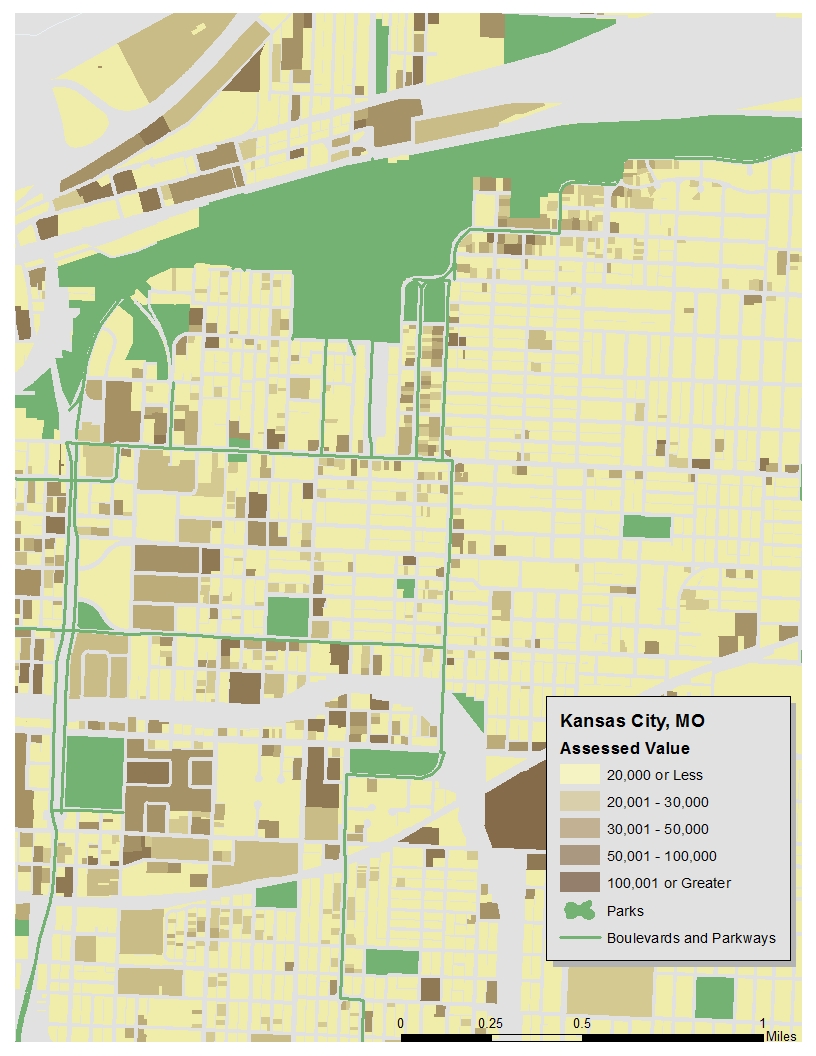
Figure 3: Assessed Property Values – Northeast Kansas City
Figure 3 accurtately depicts the relationship between the presence of park space or proximiety to a parkway or boulevard and property values. This analysis concluded that parcels located near a parkway or boulevard, or in close proximety to a park were often associated with a higher property value. In Kansas City, the average assessed property value is around $13,500. On average, homes located at least a quarter mile of a public park showed a value of $13,650, and homes within one quarter mile of a parkway or boulevard showed an average value of $14,291.
There are patterns that only emerge when looking at the city from a birds eye view. Using data from various governmental sources, we can use mapping software like ArcGIS to analyze this information.
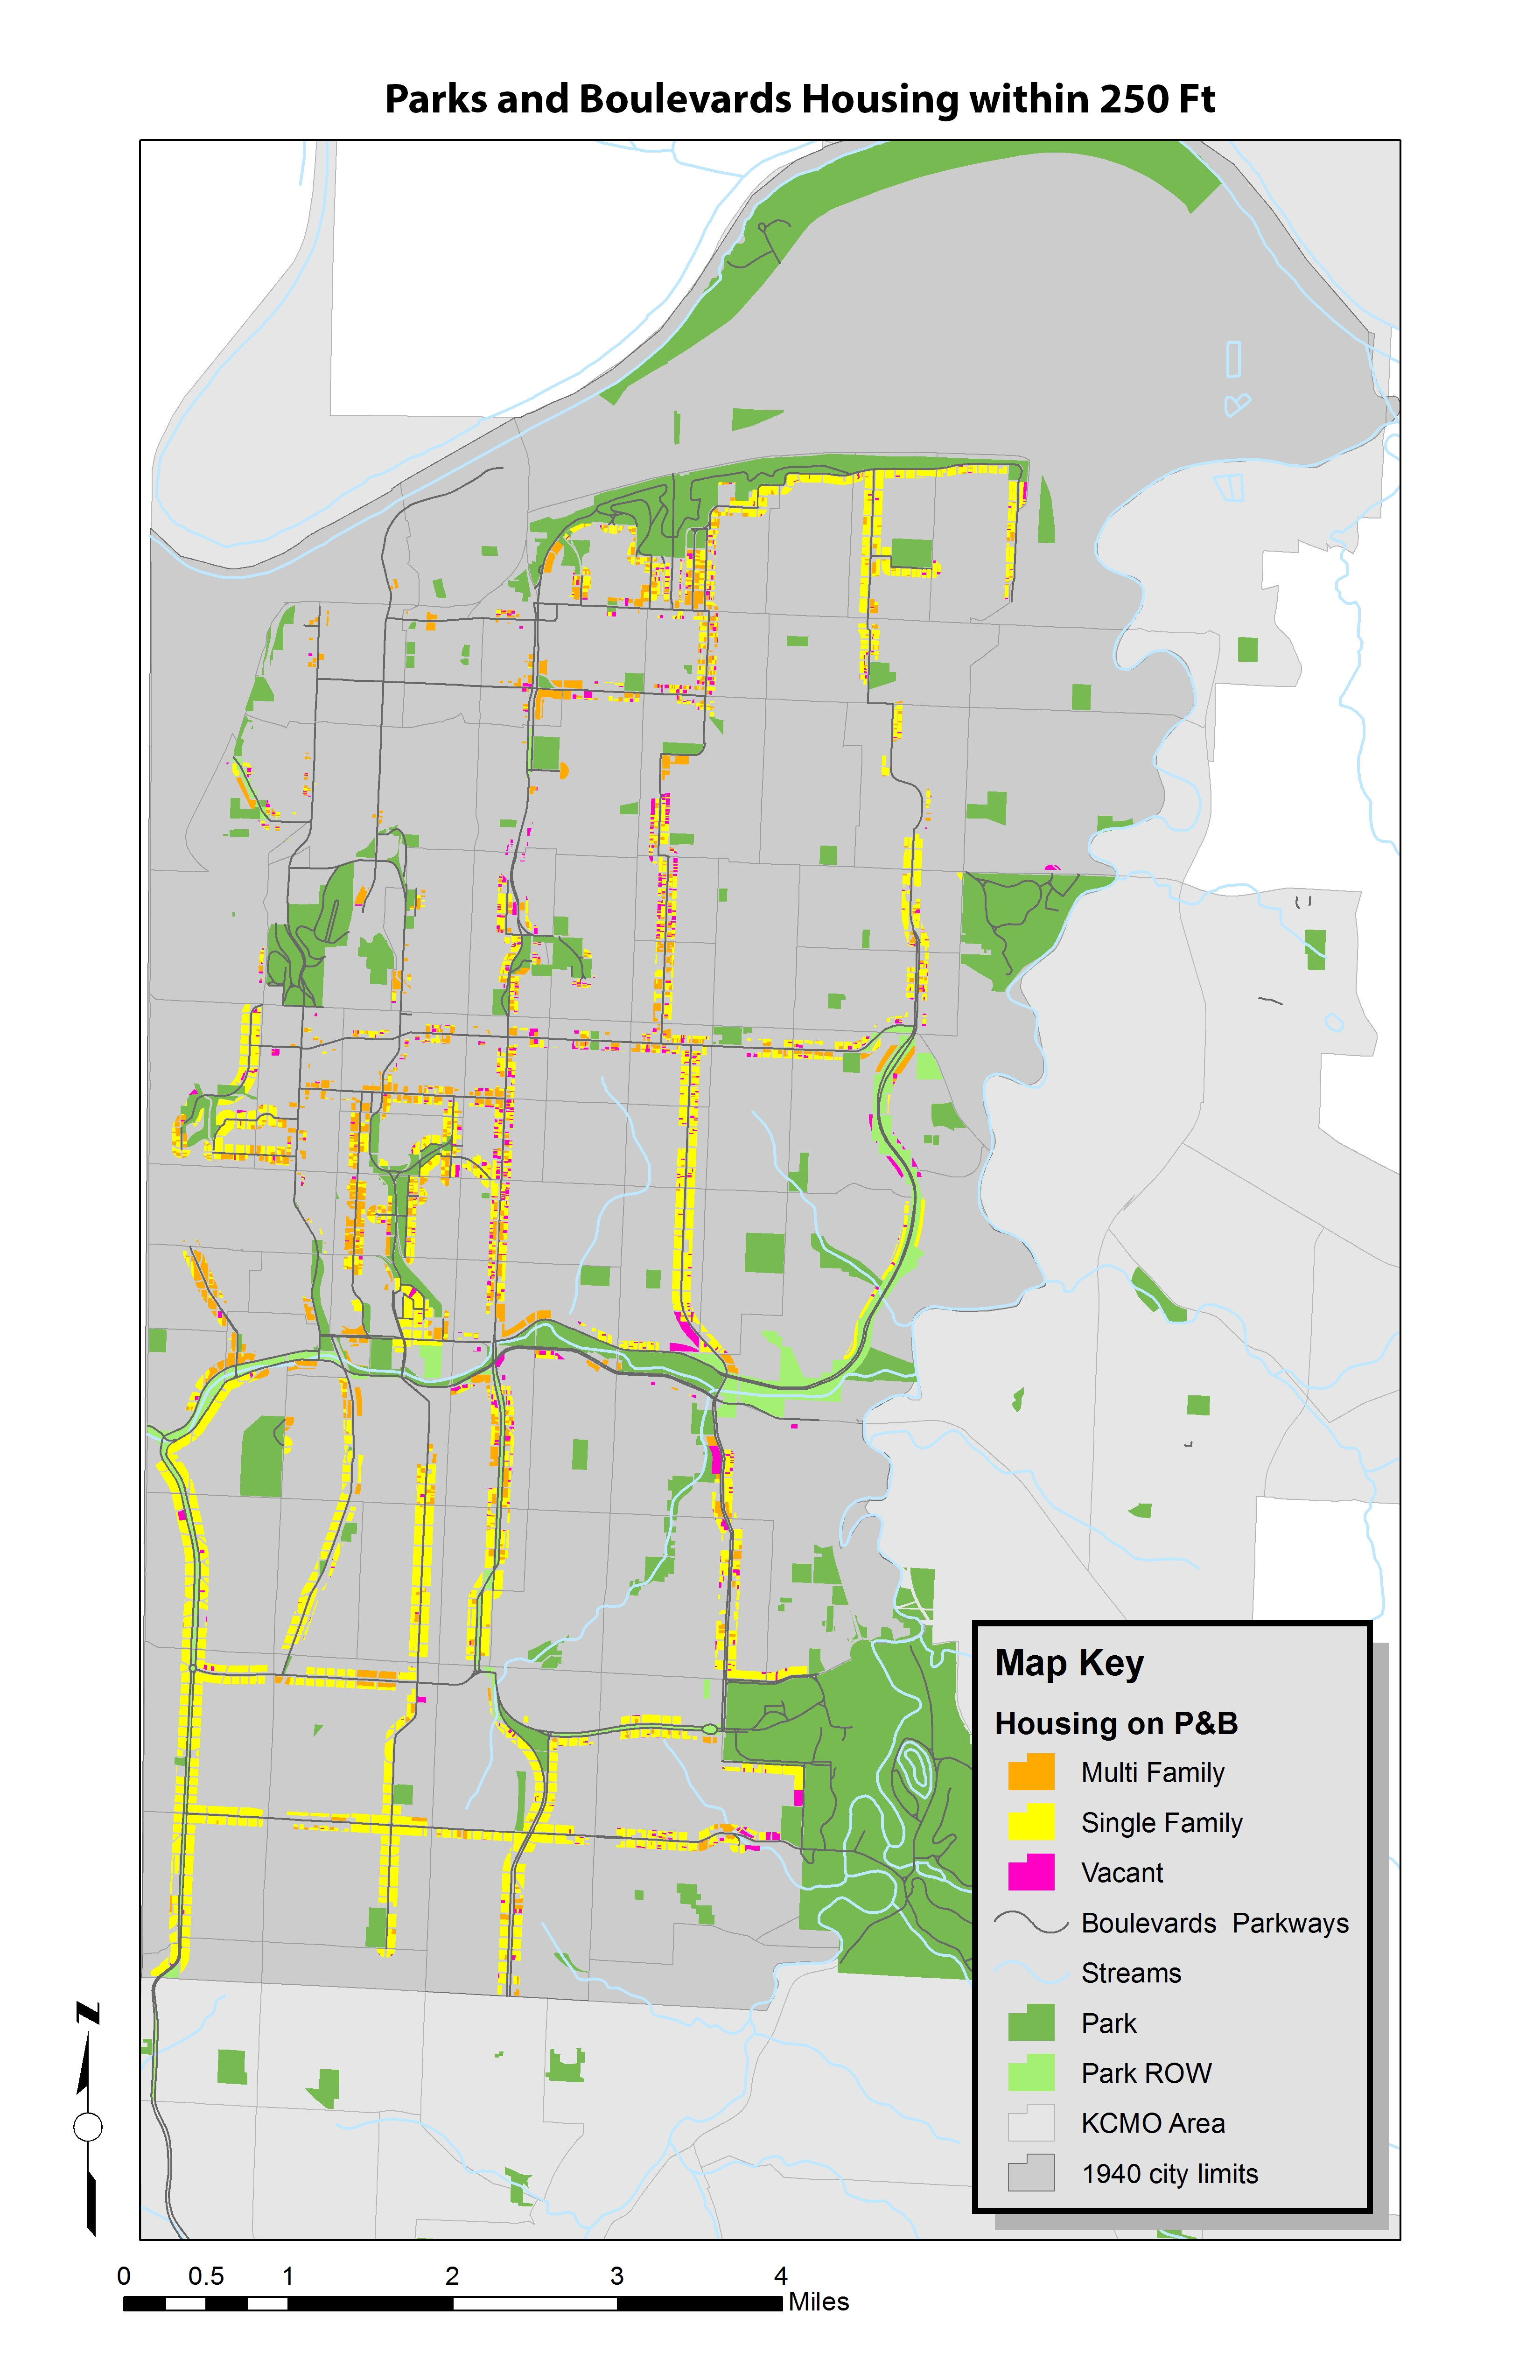
Housing on Parks and Boulevards
By mapping the parcels of land that contained housing units within 250′ of each side of the parkways and boulevards, we can visually see the areas that contain more single family over multi-family housing units. It shows where there are no housing units at all and where there are areas that were once occupied units yet are now vacant.
View of Parcels Current Land Use in Terms of Housing
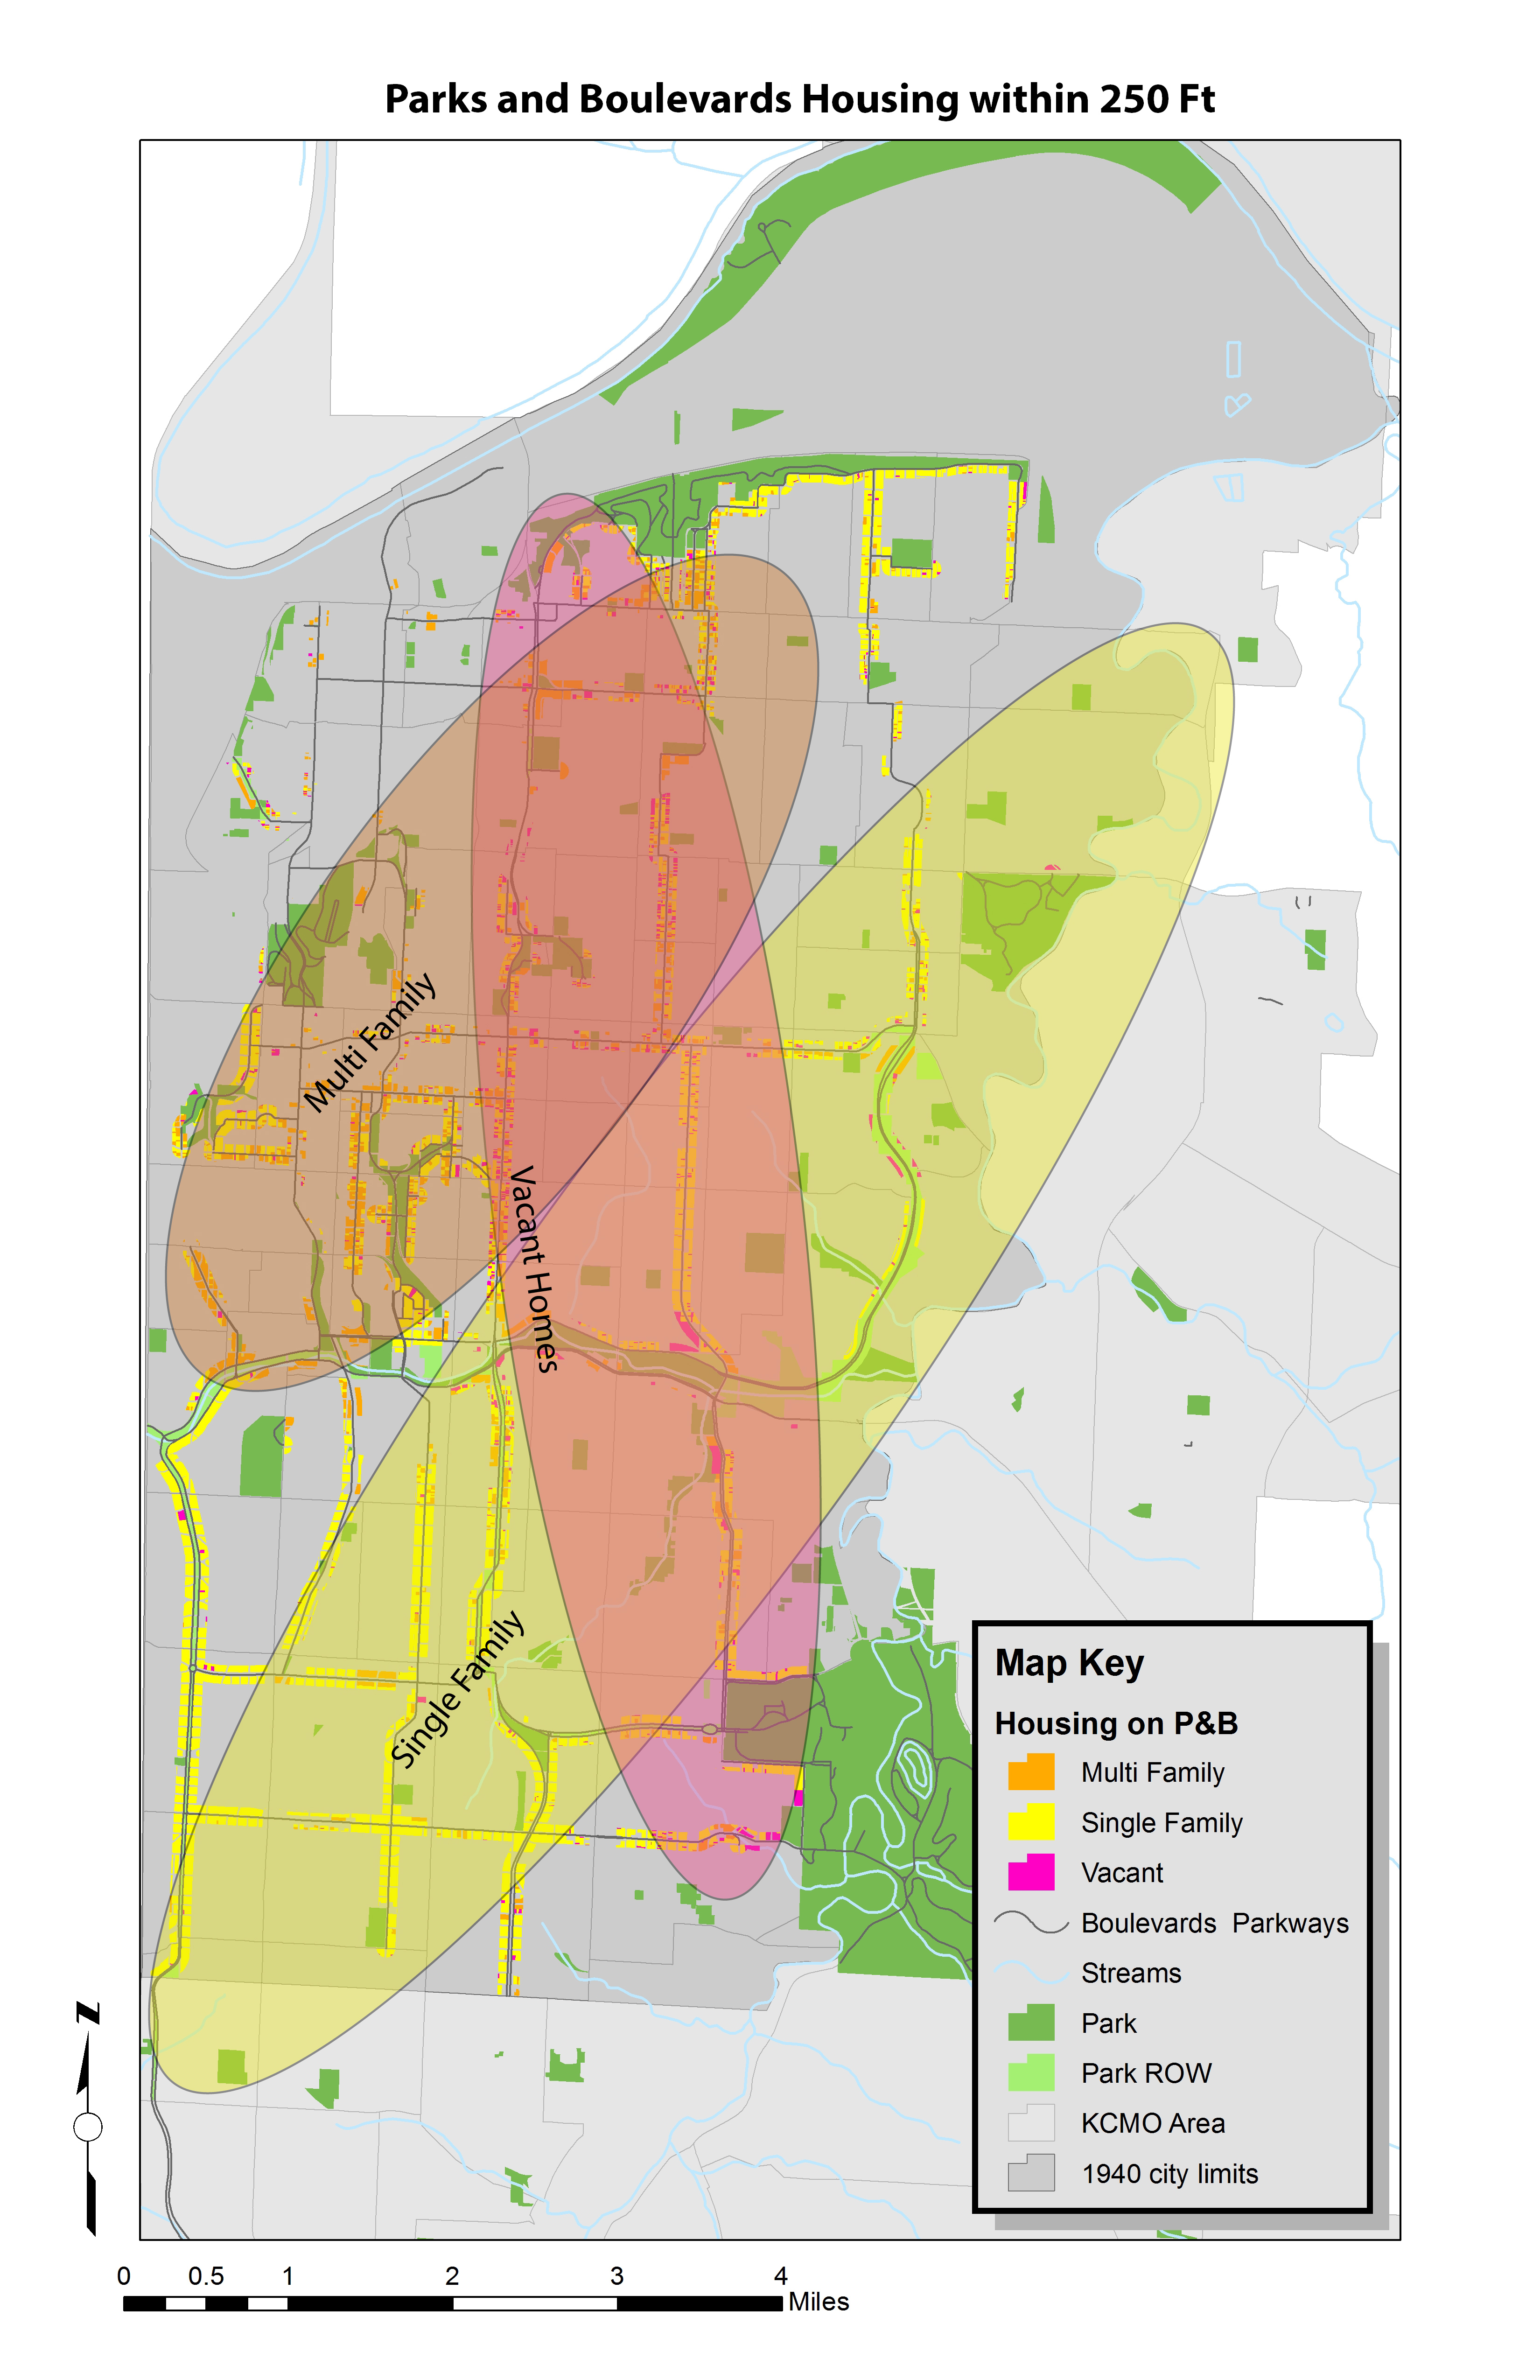
There are generalized areas that can be seen when grouping the different kinds of housing types. To the south and east, there are generally single family homes. To the north, the inner ring around the city contains many of the multi-family housing units that line the parkways and boulevards. There is also a long band of vacant properties that stretch from north to south along the east side of Paseo Boulevard.
Regions of Generalized Housing Type
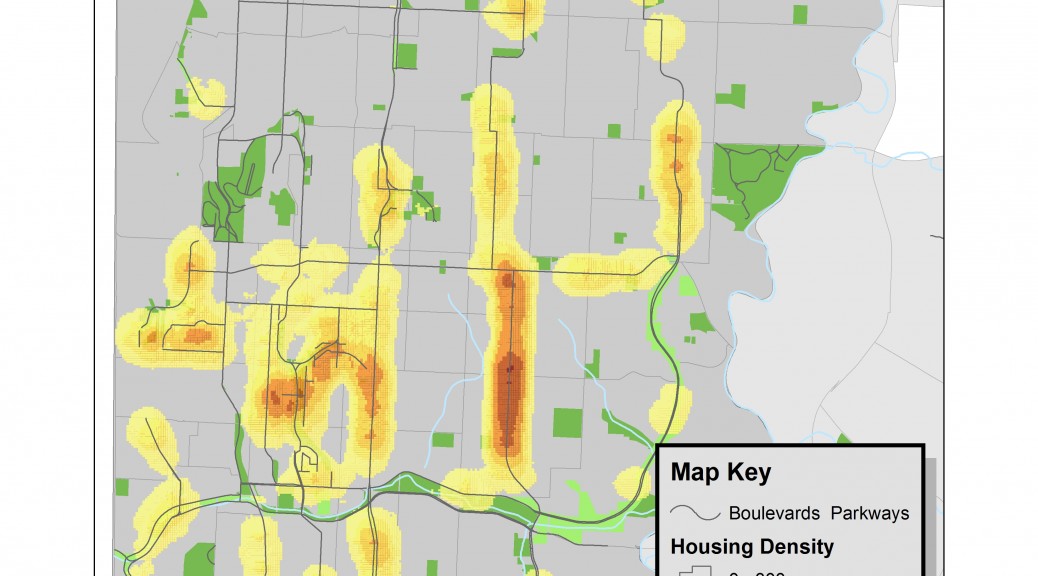
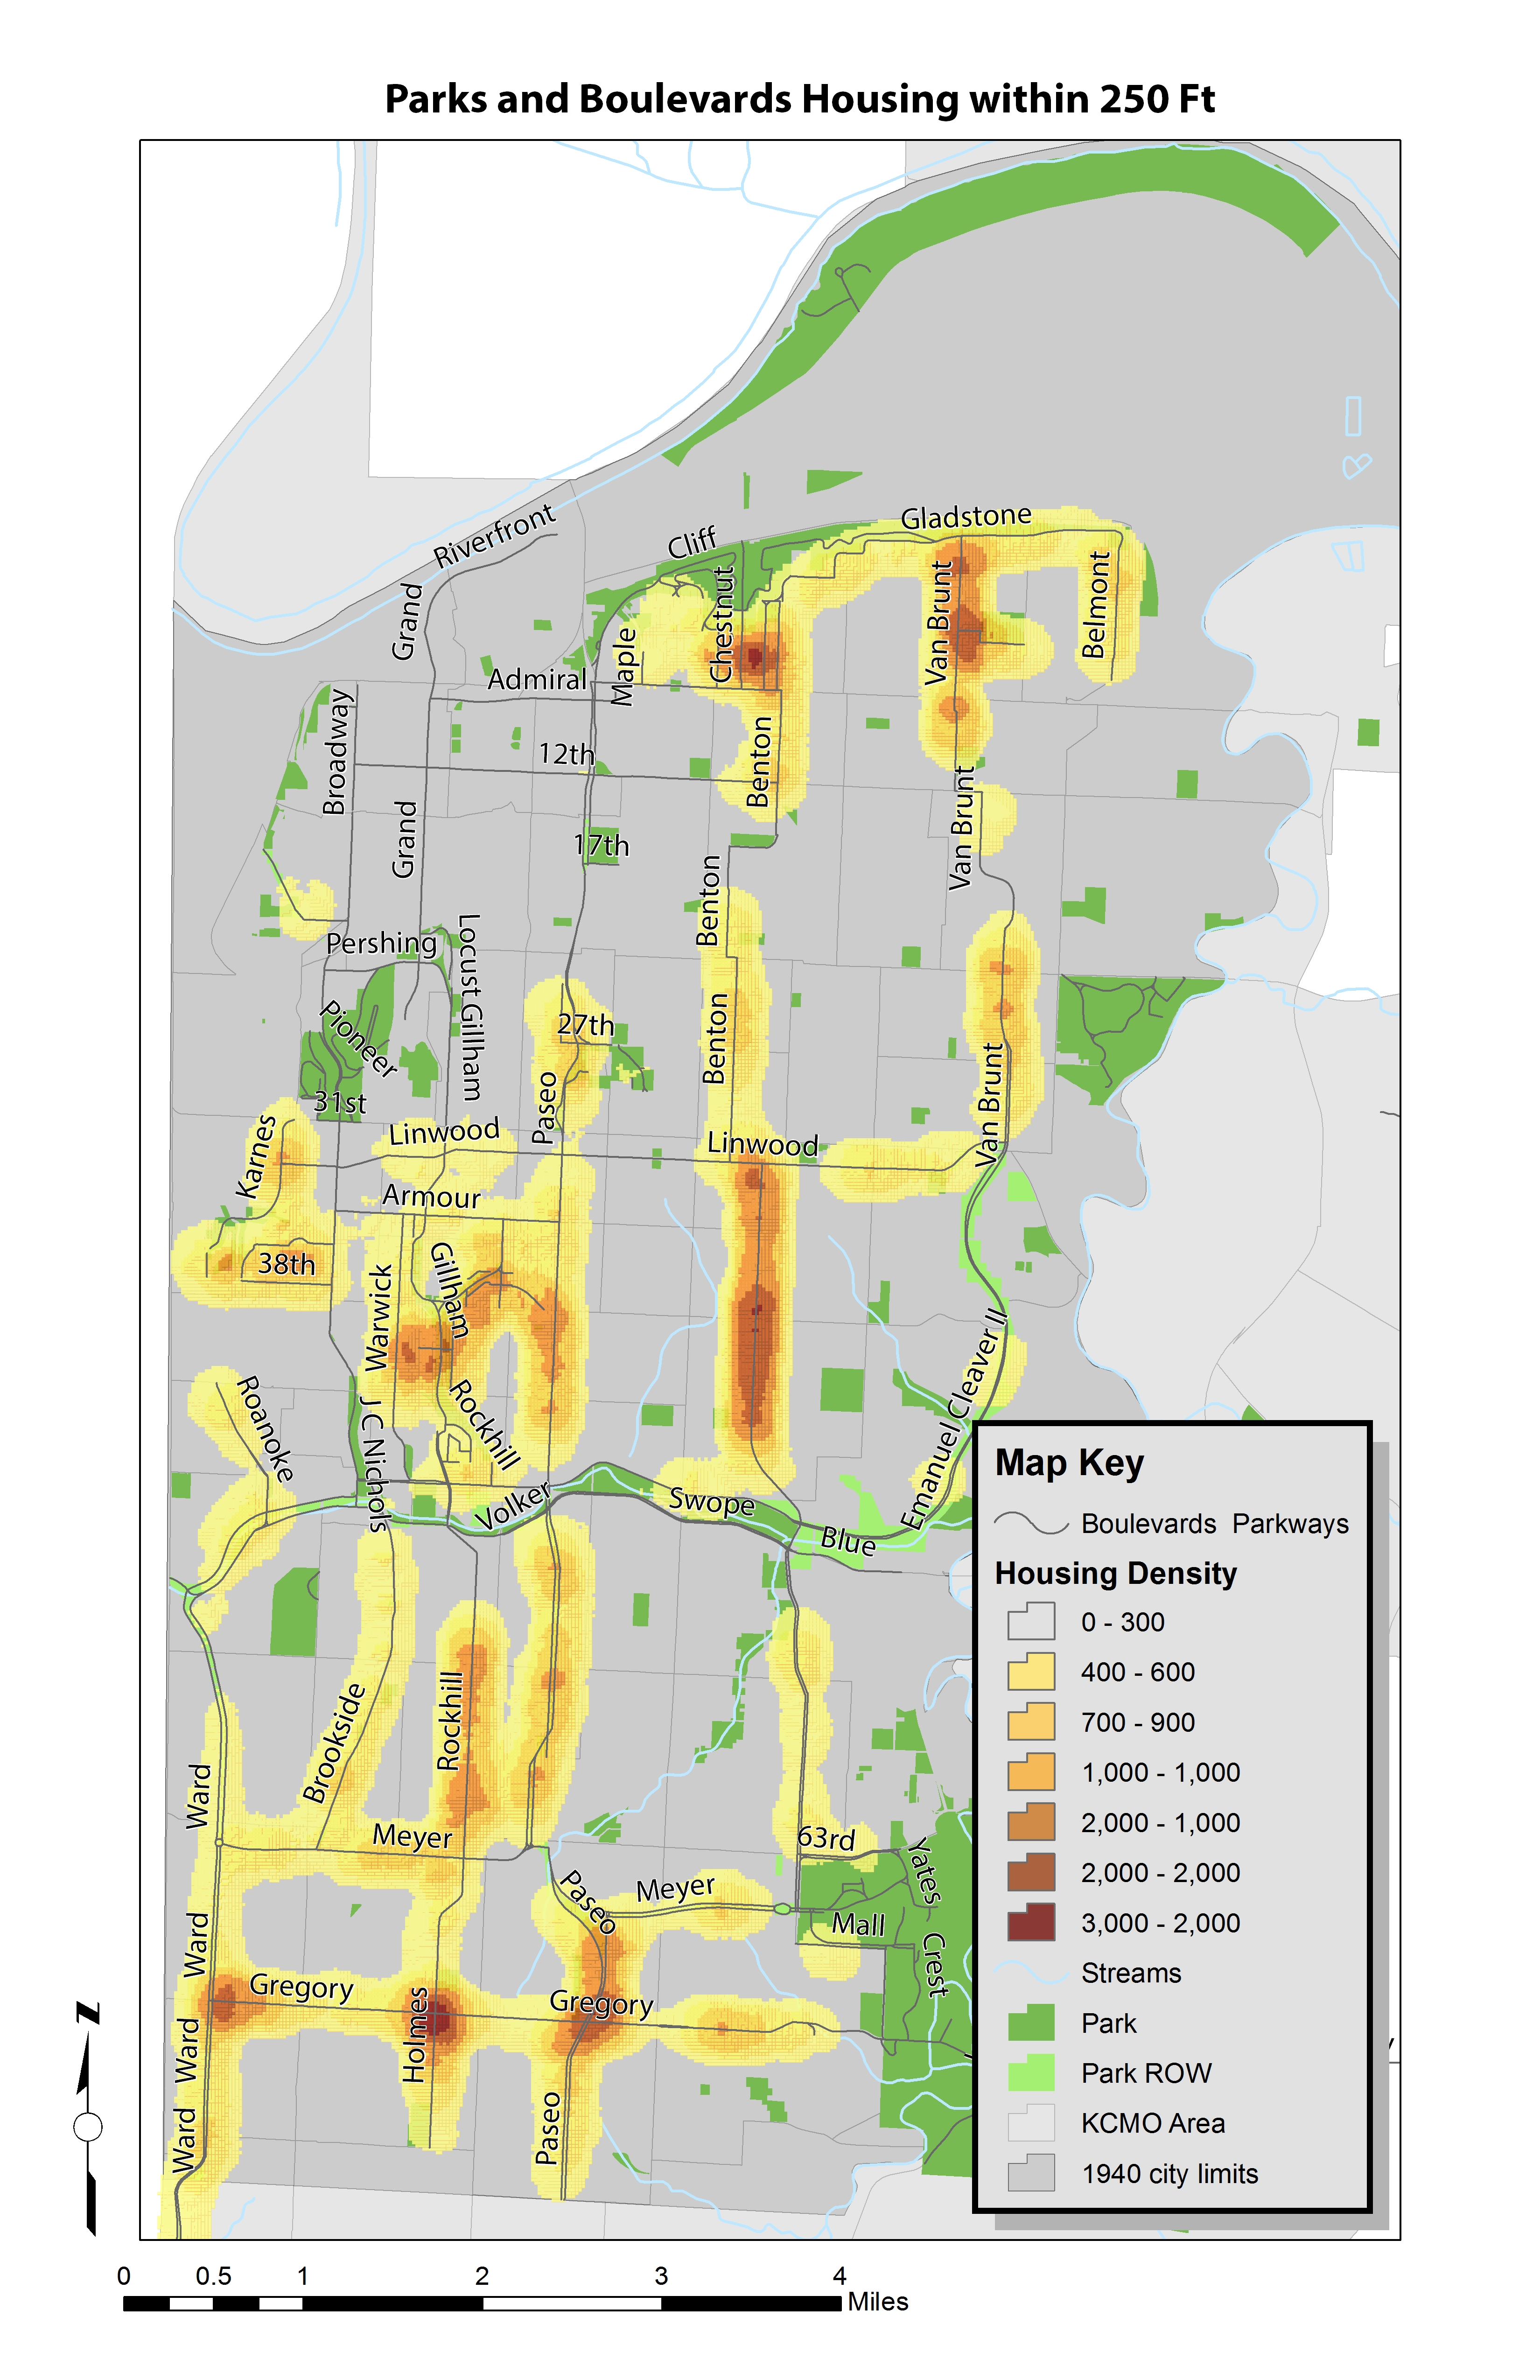
This next map shows the relative density of housing units along the parks and boulevards. Several of the ‘hot spots’ occur along Benton, Gillham and at Gregory and Holmes.
Density of Housing on Parkways and Boulevards
Land Use and Zoning
The following two maps show that Land Use and Zoning along the parks and boulevards.
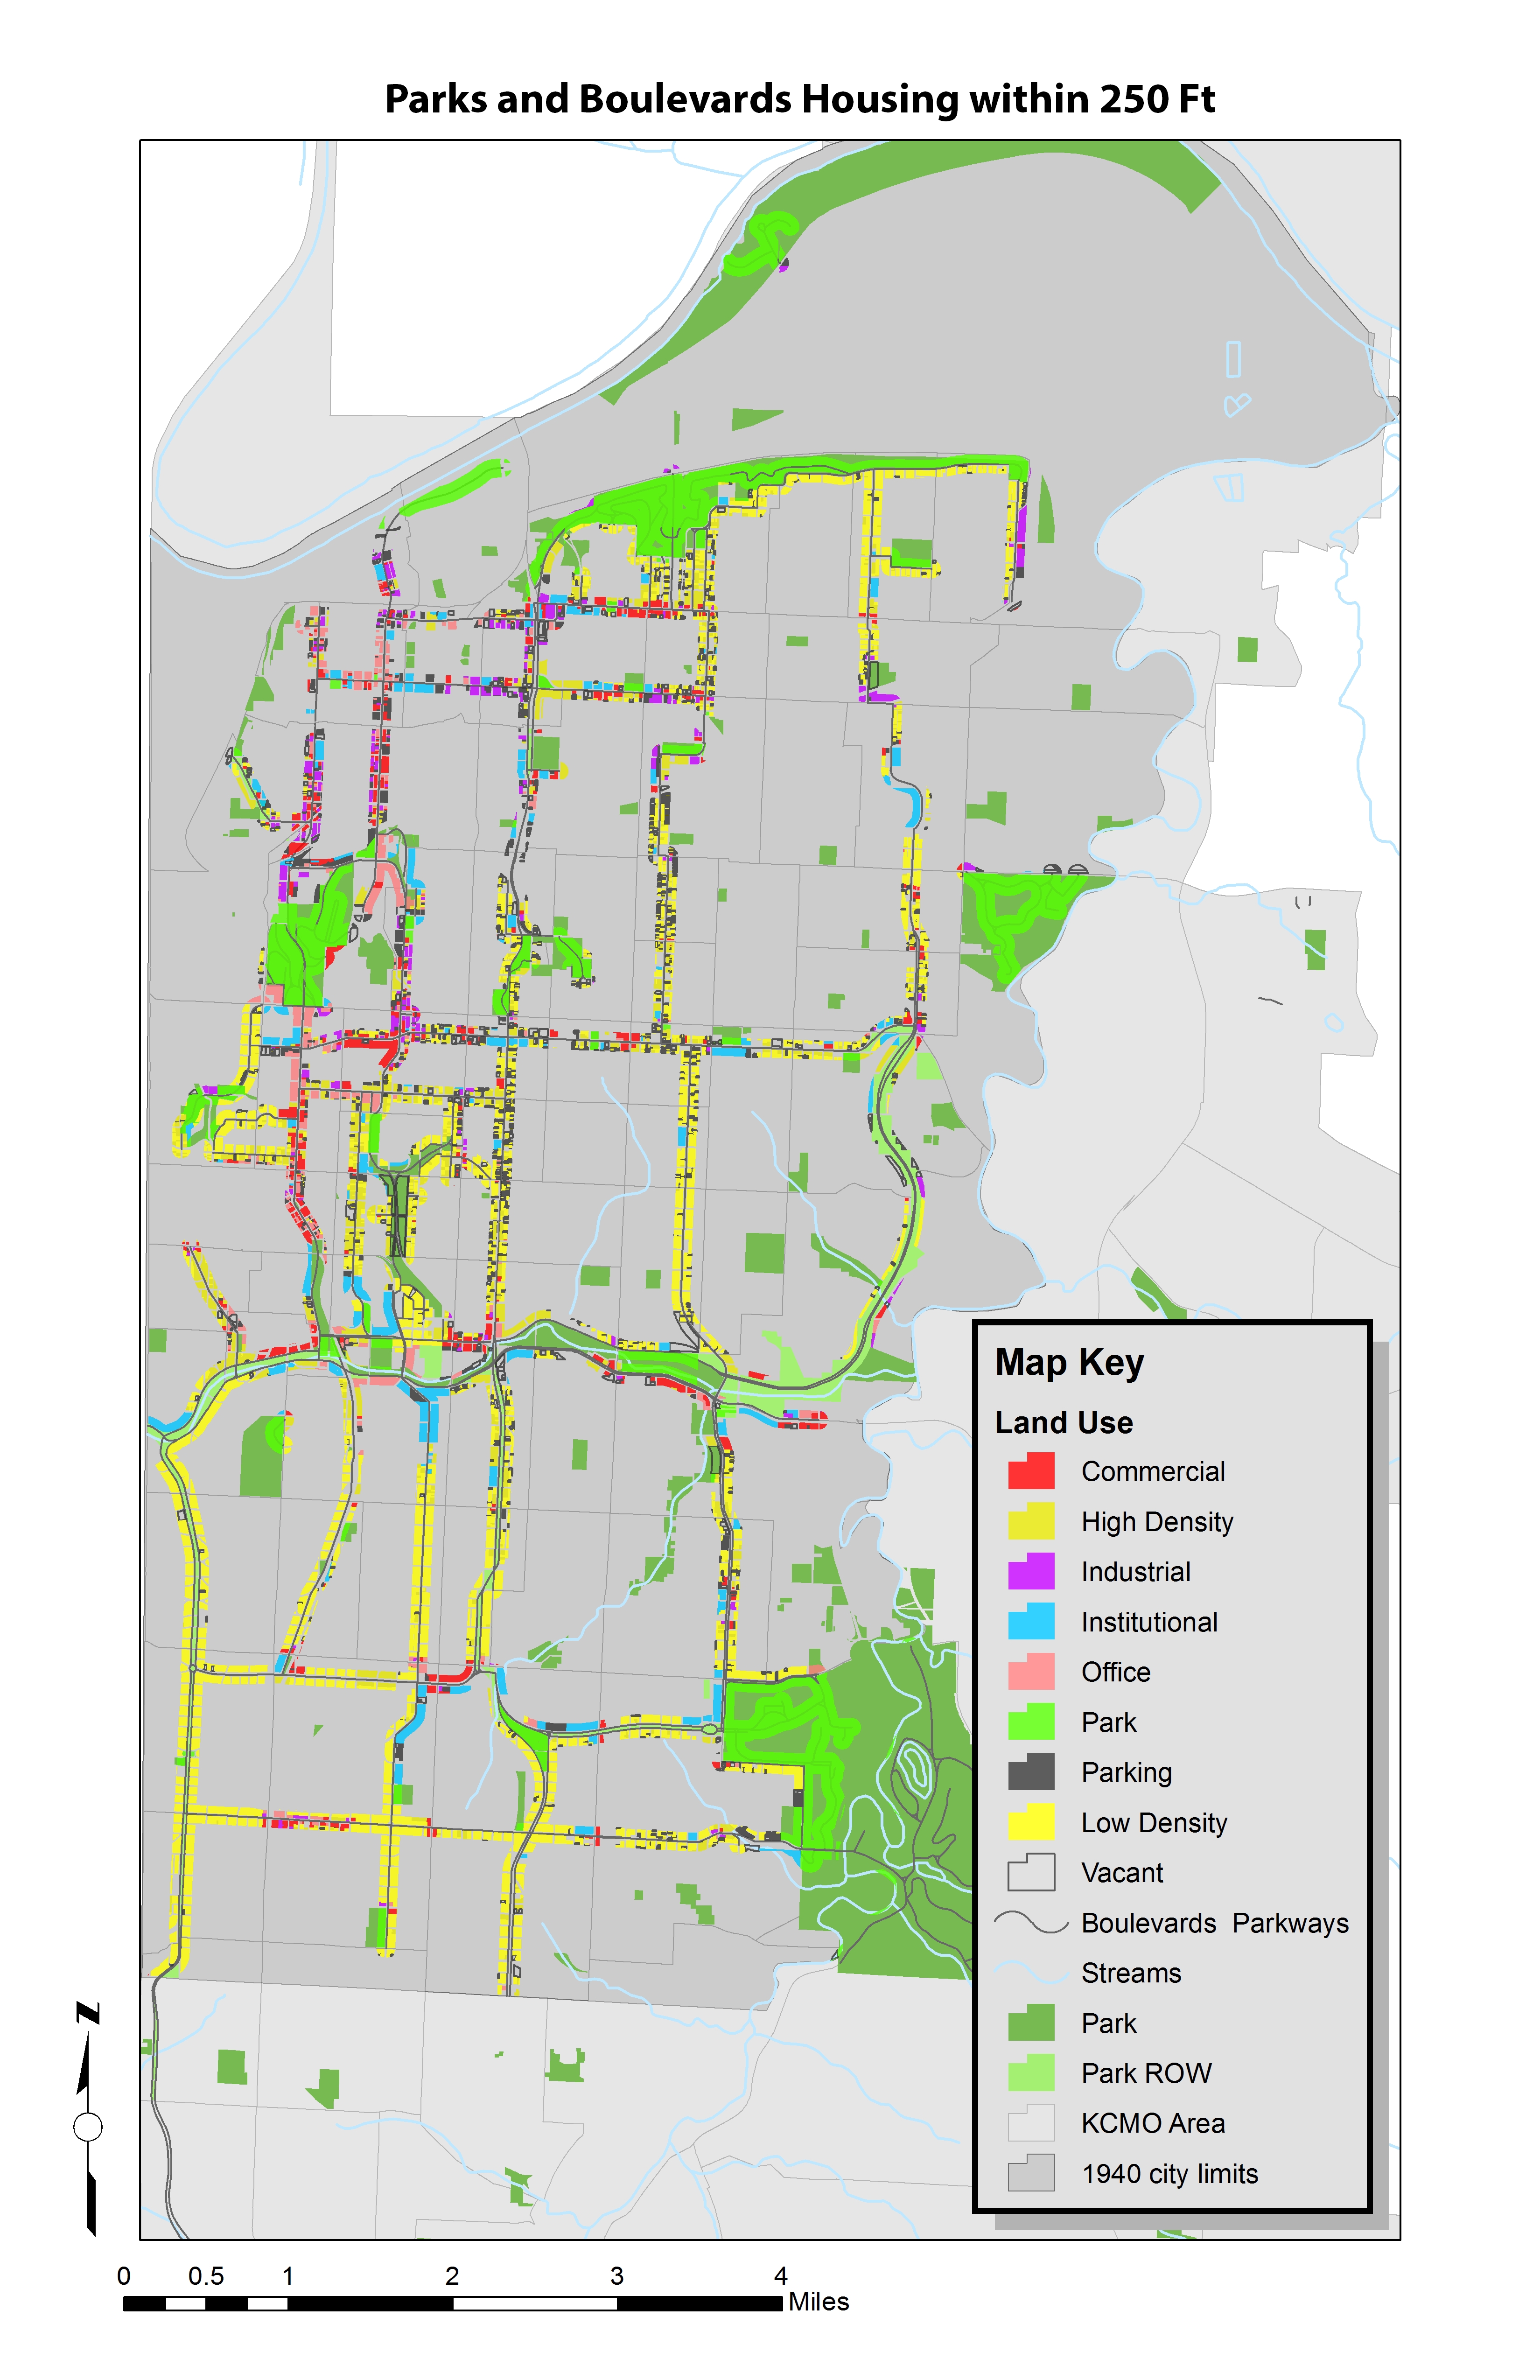
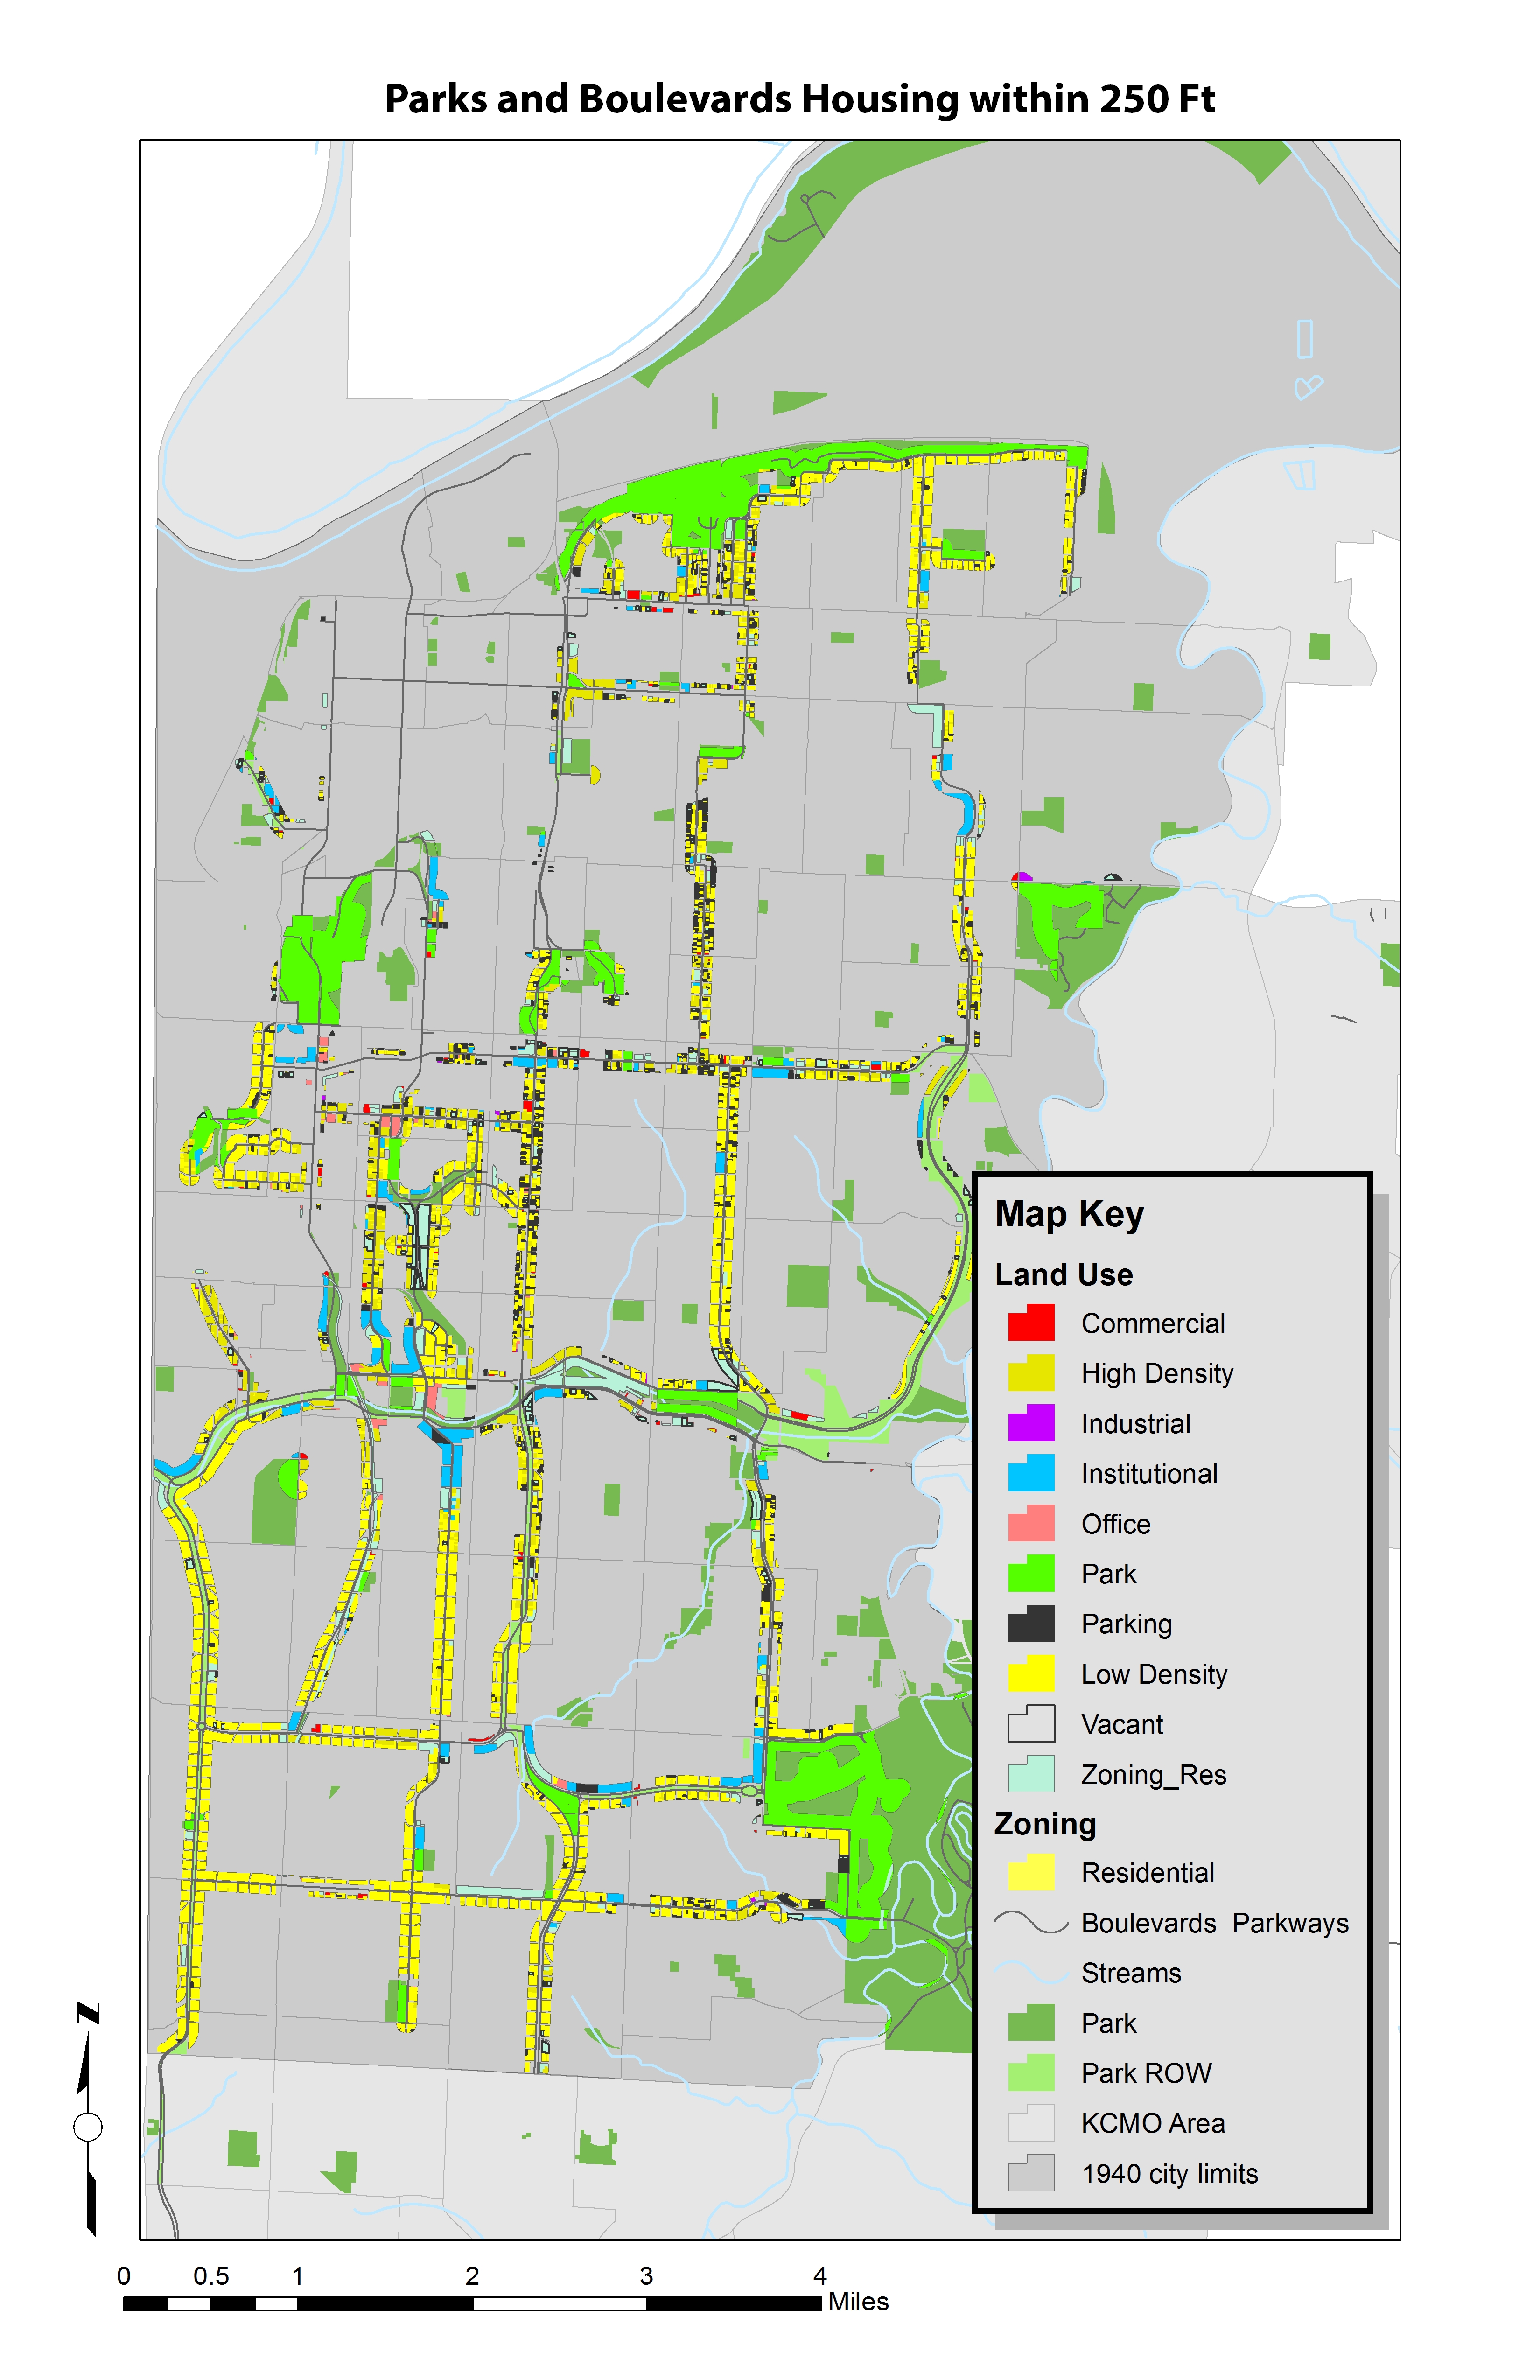
Land Use
Land Use on Parkways and Boulevards
From this map, we can clearly see the separation of the mostly residential areas towards the extents and the Industrial and Commercial areas towards the center of the city.
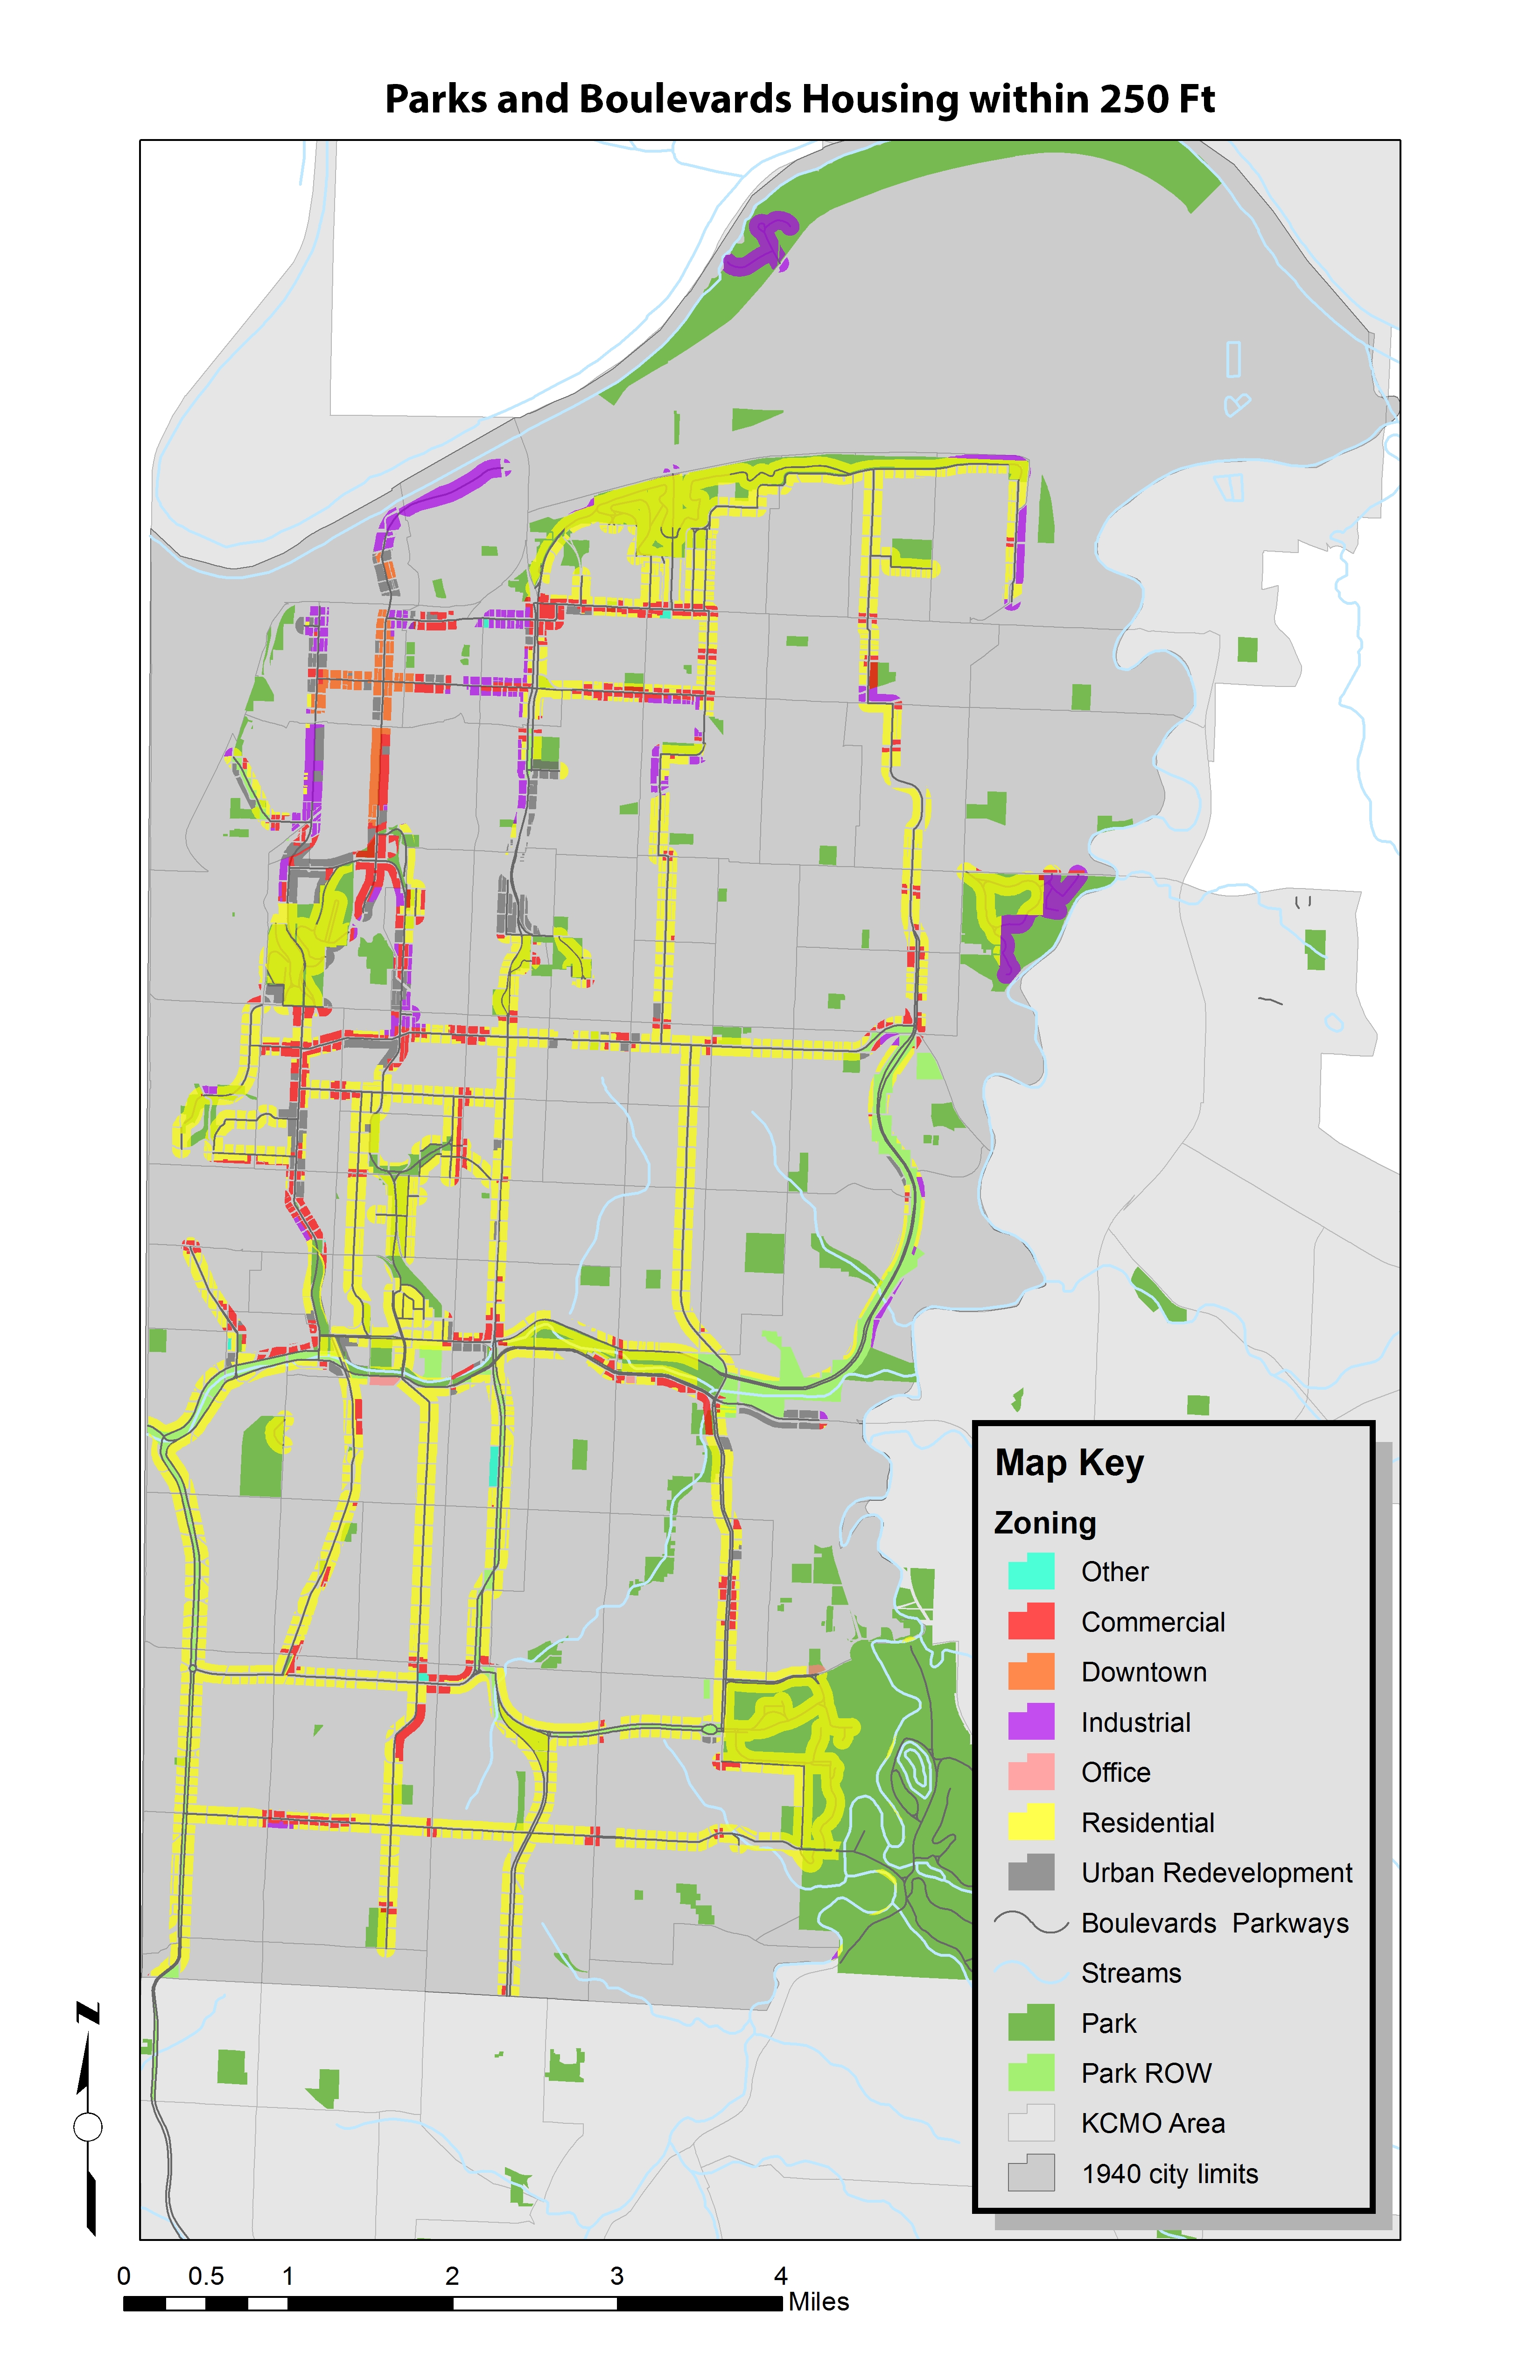
Zoning
Zoning on Parkways and Boulevards
There are long bands of zoned areas on the system. These show that towards the CBD – Central Business District – there are large zoned industrial, commercial and office plats of land. Several of the knuckles that we have been studying are also zoned commercial.
Land Use in Residential Zoned Areas
Land Use in Residential Zoned Areas
This map is particularly interesting. It shows all the land uses that are within residential zoned areas. We can see that these conflicts of land use are quite common. There are many institutions that are located within these residentialy zoned areas. There are also several commercial, office and industrial land uses that are within the residential areas.
Building Footprints
Density of Building Footprints
This last map shows where buildings with the largest footprints are located along the system are. Many of the larger buildings are located downtown and in midtown. These are also the same locations where the land use was not residential, but commercial, industrial and office space. How do these building forms and land uses work on the parks and boulevard system?
These kinds of analysis are beneficial in determining areas of improvement within the parks and boulevards system in Kansas City.
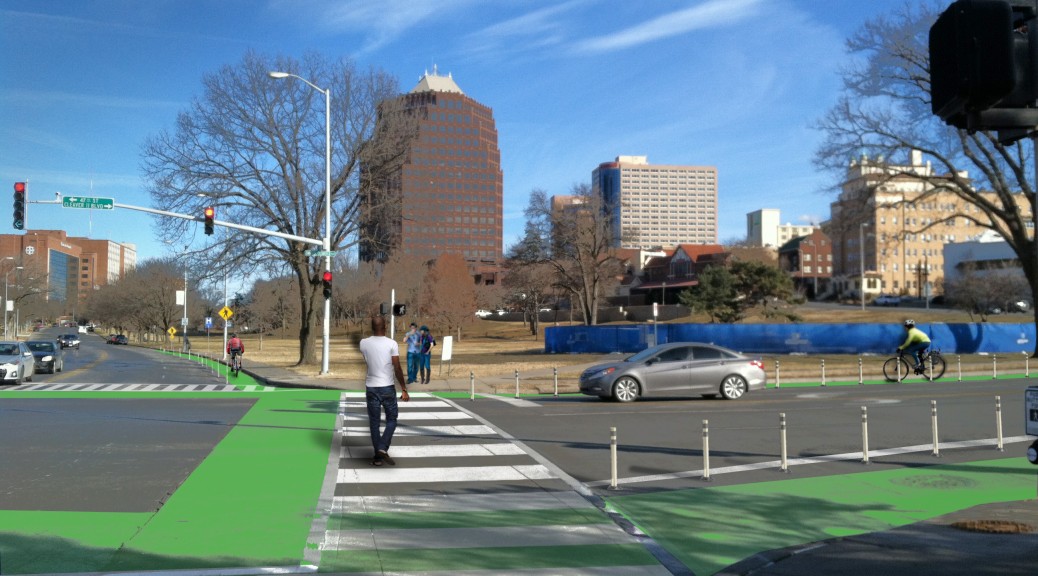
A quick look at an iconic boulevard shows the Parks system can be intensely urban
Last week was like a boot camp for planning students. We have studio three times a week, and it’s usually relatively laid back: we work on projects, get feedback from professors. (Laid back is the wrong term it’s always fast-paced and stressful
But last week, the pressure was raised a notch. In each class period, we were assigned a “quick analysis” assignment to complete in the three hours of class time. On Monday, for instance, we were assigned a demographic variable to study at the scale of Kansas City, MO. In three hours we had to produce at least one GIS map visually representing the spread of the variable, do any background research, write 600 words about what we found.
Not only is that really challenging, it’s almost impossible to do. Still, it’s impressive what you can learn about a place in two hours and fifty minutes.
While the first “quick analysis” was at the city scale, the next two — on Wednesday and Friday, respectively — dealt with the same, specific location on the city’s Parks and Boulevards system. I was assigned to look at Armour Boulevard near where it intersects with Troost Avenue — specifically between Kenwood Ave. on the west and Forest Ave. on the east. (See map below.)
On Wednesday, the assignment was to look at the history of the urban “morphology” (how streets are laid out, where buildings are, what kind of buildings they are, etc.).
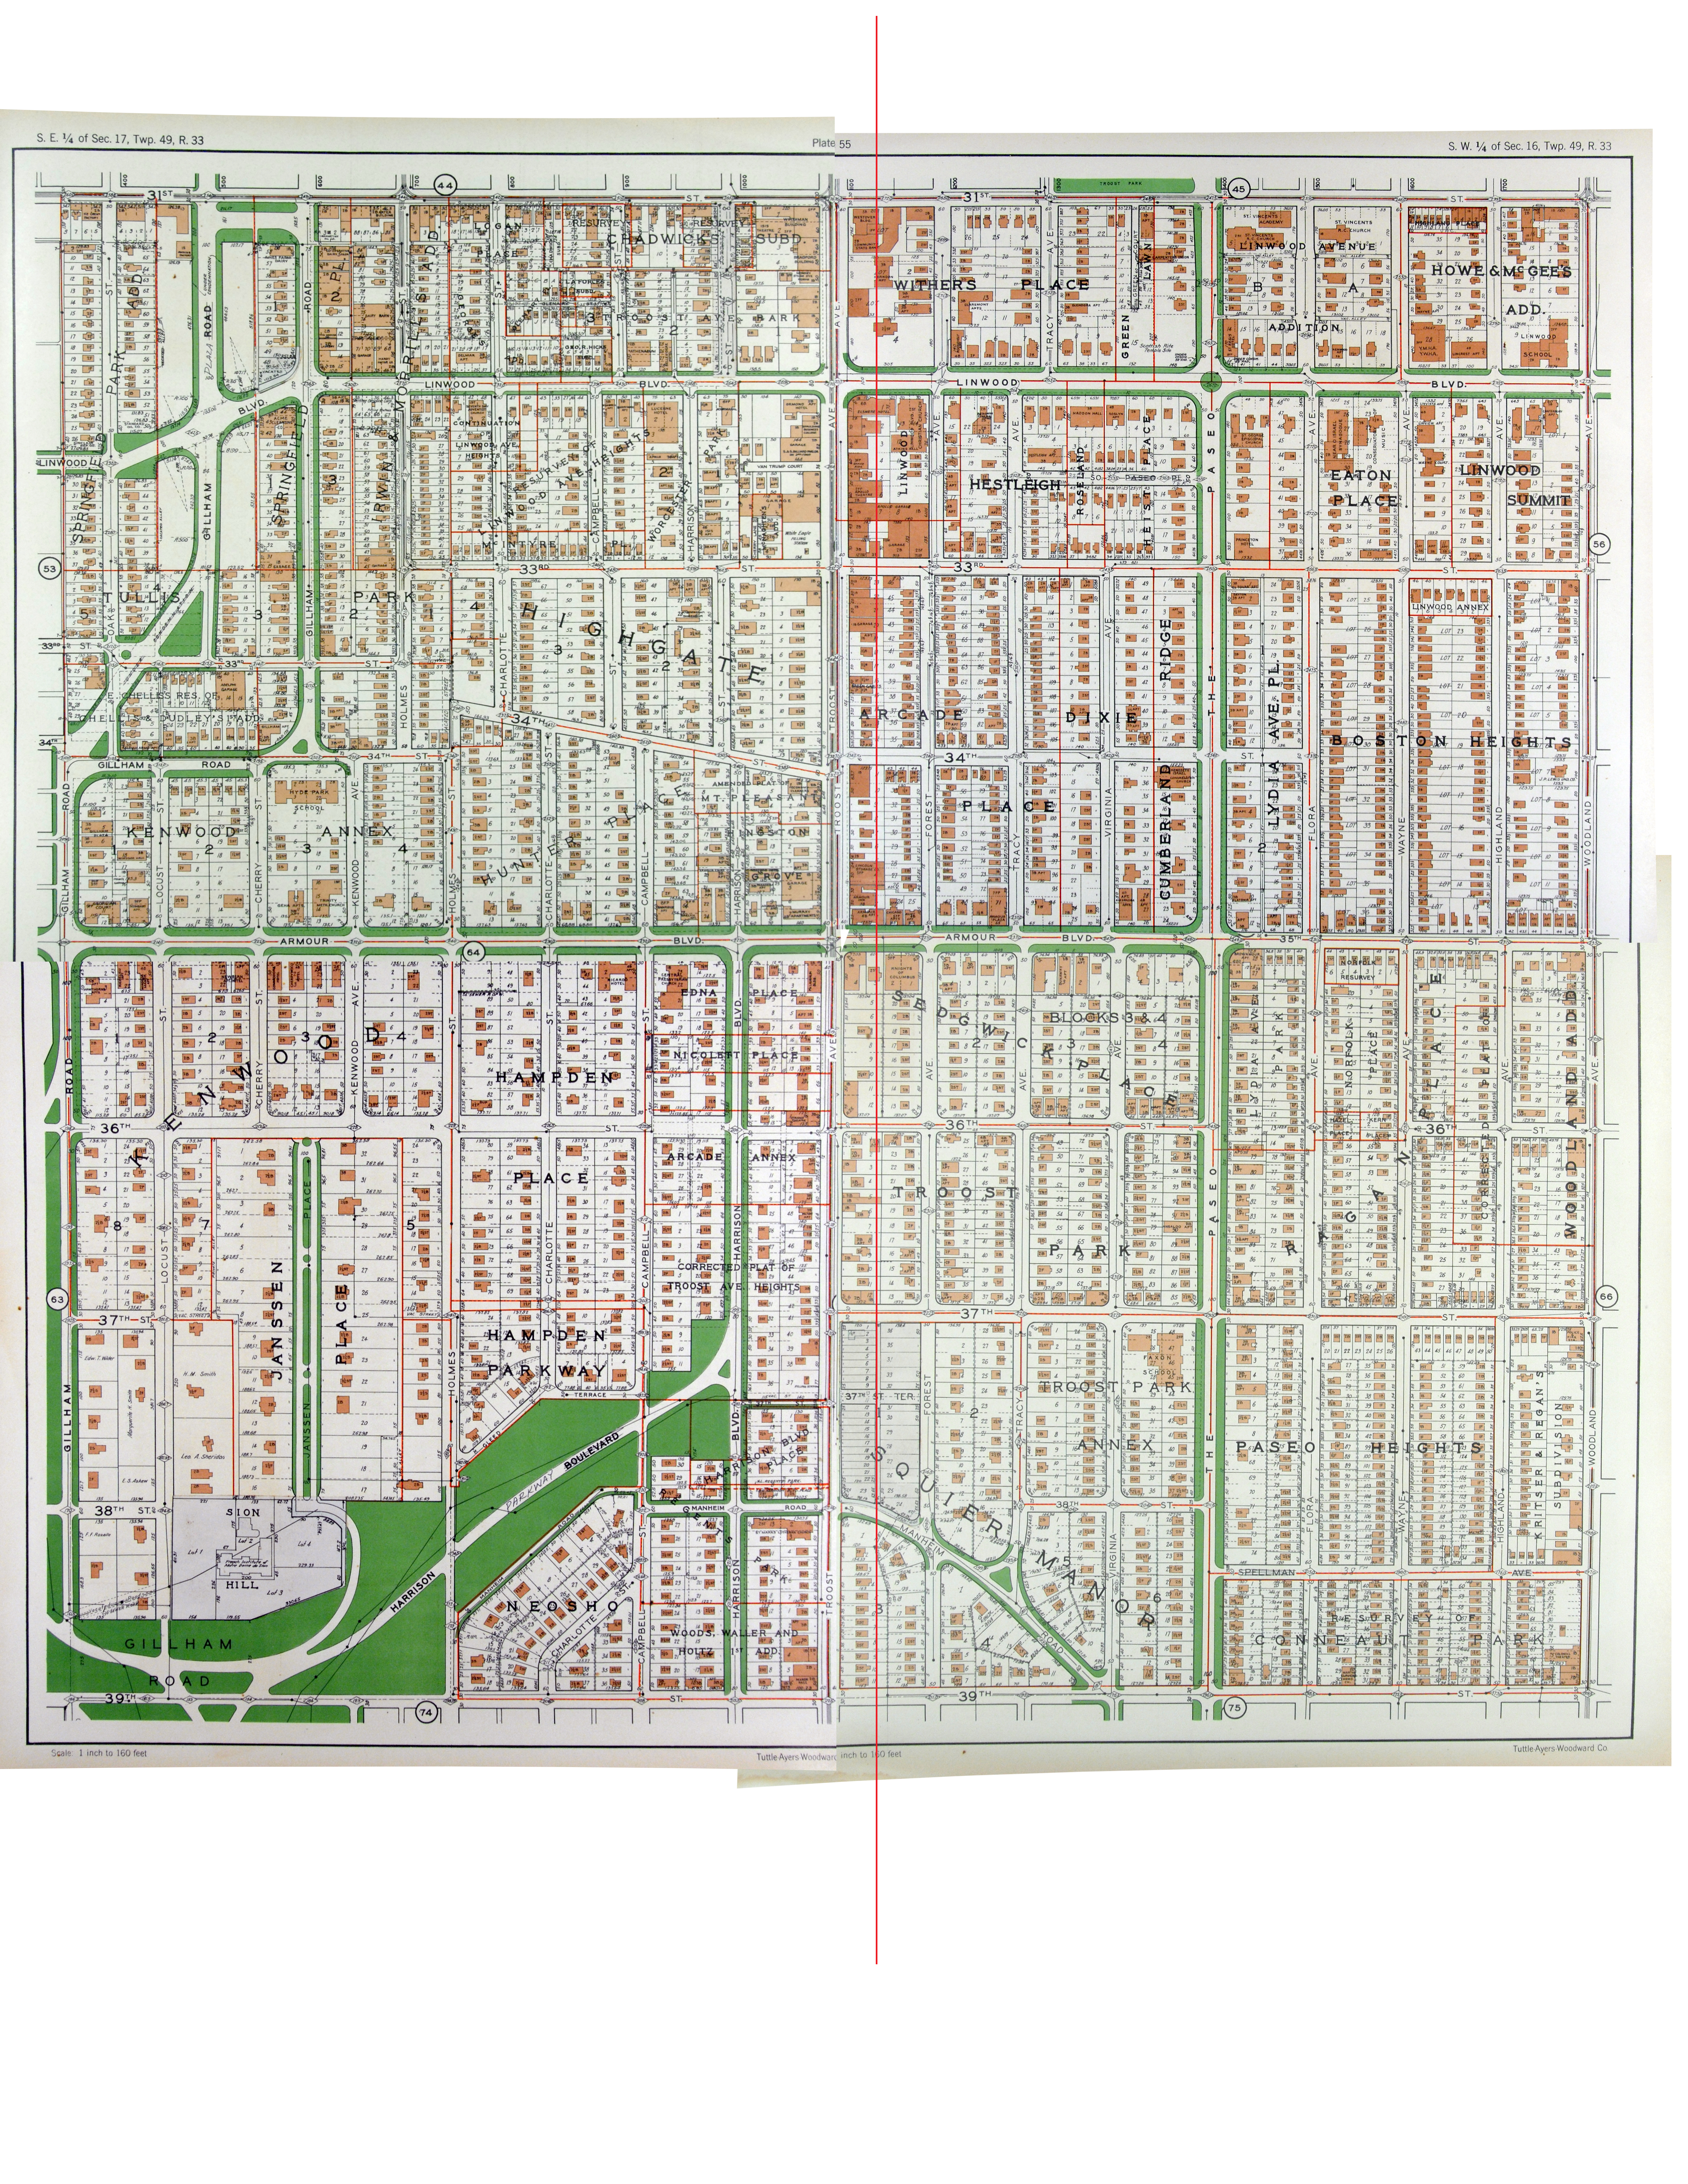
Although maps do go farther back in time, we started our research in 1925 (we only had three hours, after all). Why 1925, specifically? Because an “atlas” of the city was produced for that year, showing streets, streetcar lines and building footprints.
If you look closely at the map of my assigned area from 1925 (you can expand by clicking on it), you’ll notice a couple patterns. First, the area is largely filled by single-family homes. There are exceptions, though, most notably along Armour itself and Troost, where higher-intensity uses — apartment buildings, churches, and along Troost particularly, commercial spaces — are found. Another important pattern is seen in clusters of empty, undeveloped lots — this suggests the neighborhood was fairly new at the time. (And in fact, the city limits at the time would have been just a mile south near 47th Street.) The concentration of gathering places and commercial uses along Armour and Troost suggests they provided the framework for the development of the neighborhood — Armour as an attractive boulevard thoroughfare and Troost as a throroughfare and streetcar line.
1950
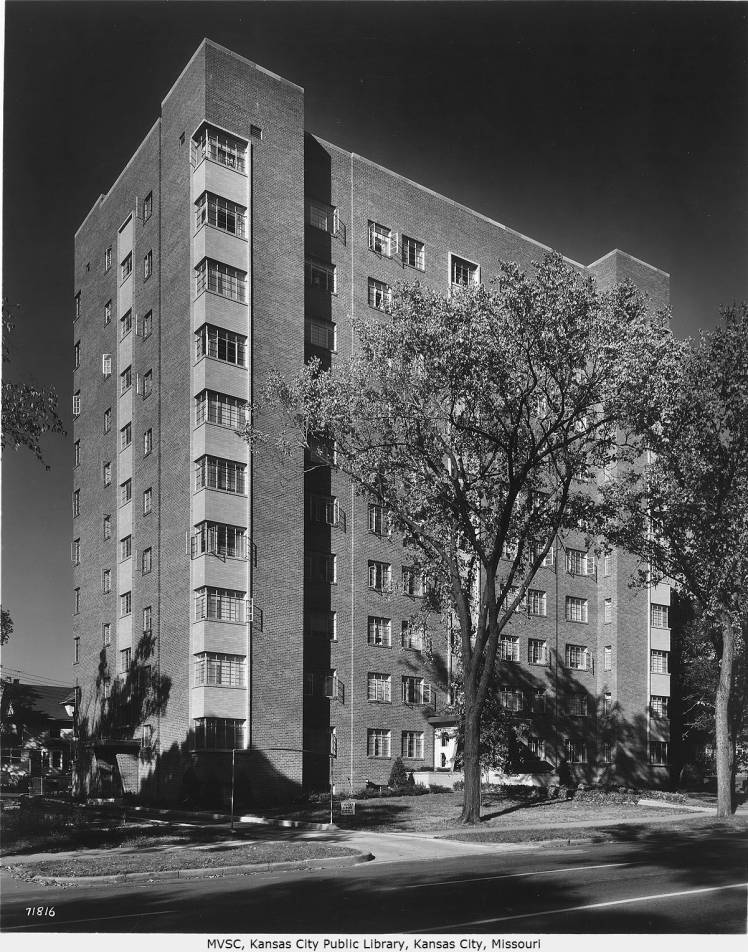
Not much seems to have changed by 1950, the next point on the timeline we were supposed to look. A few more lots have been filled in with structures. Several mid-rise apartment buildings, which were already numerous to west near Gillham Rd., have appeared along this stretch of Armour. The Armour Tower apartments, in a photo from around 1952, are exemplary of that kind of development.
Armour Tower, northwest corner of Armour and Campbell, 1952, Missouri Valley Special Collections
An undated photo (probably from the same period based on the style of cars) is even more telling: It shows the area was bustling and vibrant and had an urban scale.
Today
Contrast the above photo with one from today at the same spot
Continuing our research analysis on the Parks and Boulevard system, our studio was assigned to complete our analysis and presentation work. Each student was assigned to three different groups to combat the analysis research and presentations. The analysis topics were decided on after a SWOT analysis was done over our previous work. Today, I will be covering a work example from each of my three topics. All maps will use the 1940’s Kansas City, Missouri boundaries.
Park System Metrics
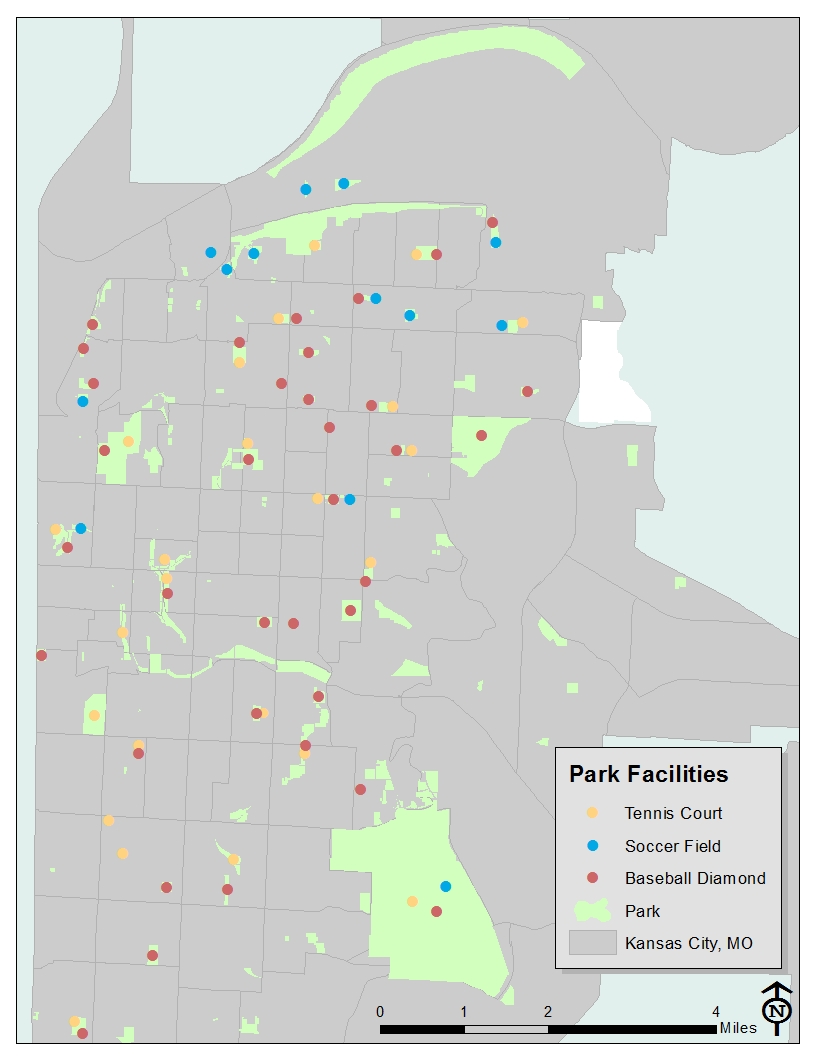
Park System Metrics covers a wide range of elements when analyzing the Parks and Boulevards system. Because there are no specific classifications with the topic, it have many different overlaps. Figure 1. (seen below), is a location map produced by my group partner and I. It identifies the locations of different park facilities such as Tennis Courts, Soccer Fields, and Baseball Diamonds within the Parks system. This map can be used when identifying areas of the city, which may lack certain facilities within the park system. Another great thing about this map is that it can be used with census data to identify inequality in locations of minority and low income areas.
Figure 1. Park Facilities throughout the 1940 KCMO boundaries.
Parks and Demographics
Demographic analysis in most cases, can be the most important tool to when studying a geographical location. Figure 2. (shown below) is a map using census block level data to show areas with the majority of residents being Hispanic or Latino. This map can be used for many things, such as identifying inequality in the total number of park acreage within the majority Hispanic neighborhoods, or to identify areas to locate specific facilities based on residential culture.
Figure 2. Majority Hispanic/Latino location map according to 2010 Census Block data within the 1940 KCMO boundaries.
Parks and Transportation
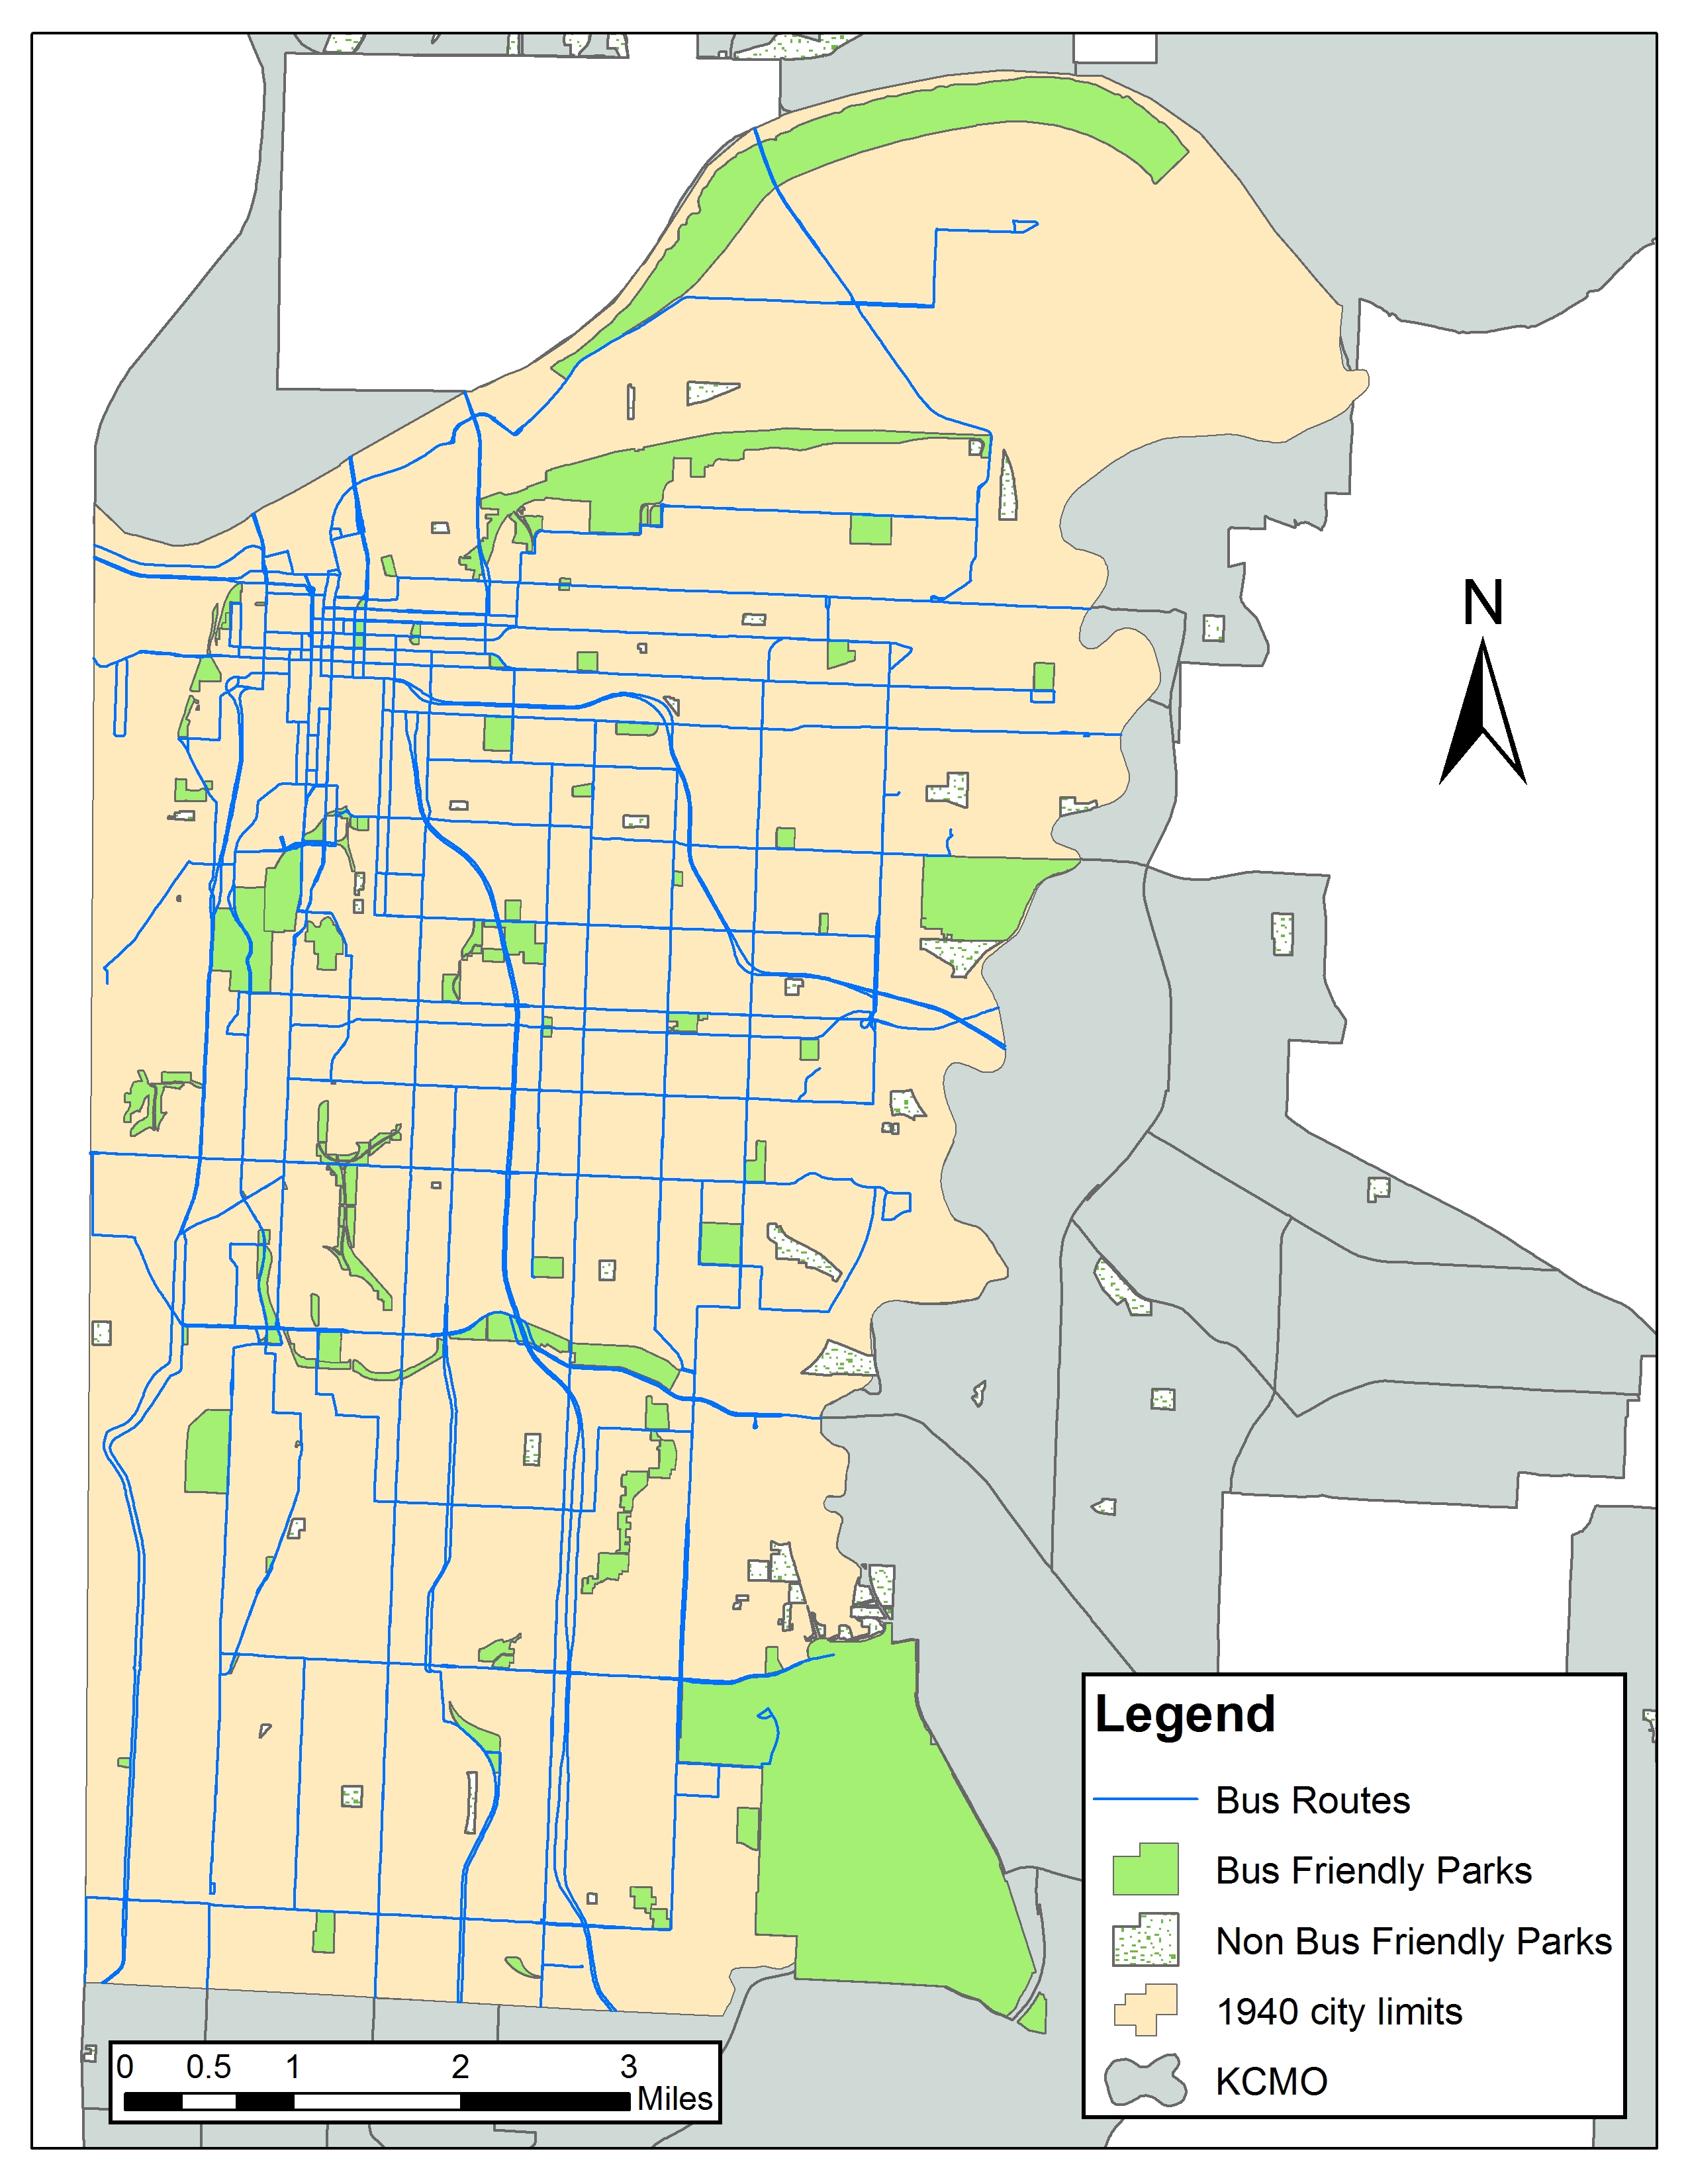
When analyzing the Kansas City Parks and Boulevard system, the location of the specific analysis is important because although most of Kansas City has been shaped by suburbia, the inner core is still very reliant on public transportation. As you can see in Figure 3. (shown below), and the prior two maps, we have been using the original 1940 Kansas City, Missouri boundary area for the analysis. Image 3 is a map showing the parks that are, and are not within 100 feet of a bus route. This map can be useful when planning for bus route extensions, or identifying a lack of park space along a certain corridor.
Figure 3. Parks within 100 ft. of a weekend service Bus Route within the 1940 KCMO boundary.
“A Parks and Boulevards system that better serves the recreational needs of all existing residents, more effectively activates and connects the city’s activity centers, and becomes a source of pride for 21st century Kansas Citians ”
“The future of Kansas City’s Parks and Boulevards System depends on the analysis of the system’s history and the recognition of currents needs and concerns, in order to make wise decisions that build upon the existing foundation. Once the physical parameters of the spaces are modified to accommodate today’s environment, elements such as bike and pedestrian trafficways, street furniture and park structures can be updated to fit the layout. Upon the implementation of these new ideas, the Parks and Boulevards System will increase interest in and activity to the surrounding neighborhoods.”
“A leader in new high density housing, and mixed use development. A leader in expanding the shared-use trail system with separate bike lanes. A tool used to help strengthen struggling neighborhoods.”
“We strive to better our urban spaces through creating more diversity In our parks. By responding to the changing landscape of values in Kansas City, the 21st century of parks and boulevards will continue to be a asset to our city. The parks and boulevards act as a valuable structure that need not only be preserved but responded to by future development.”
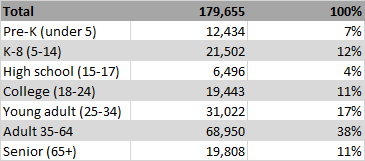
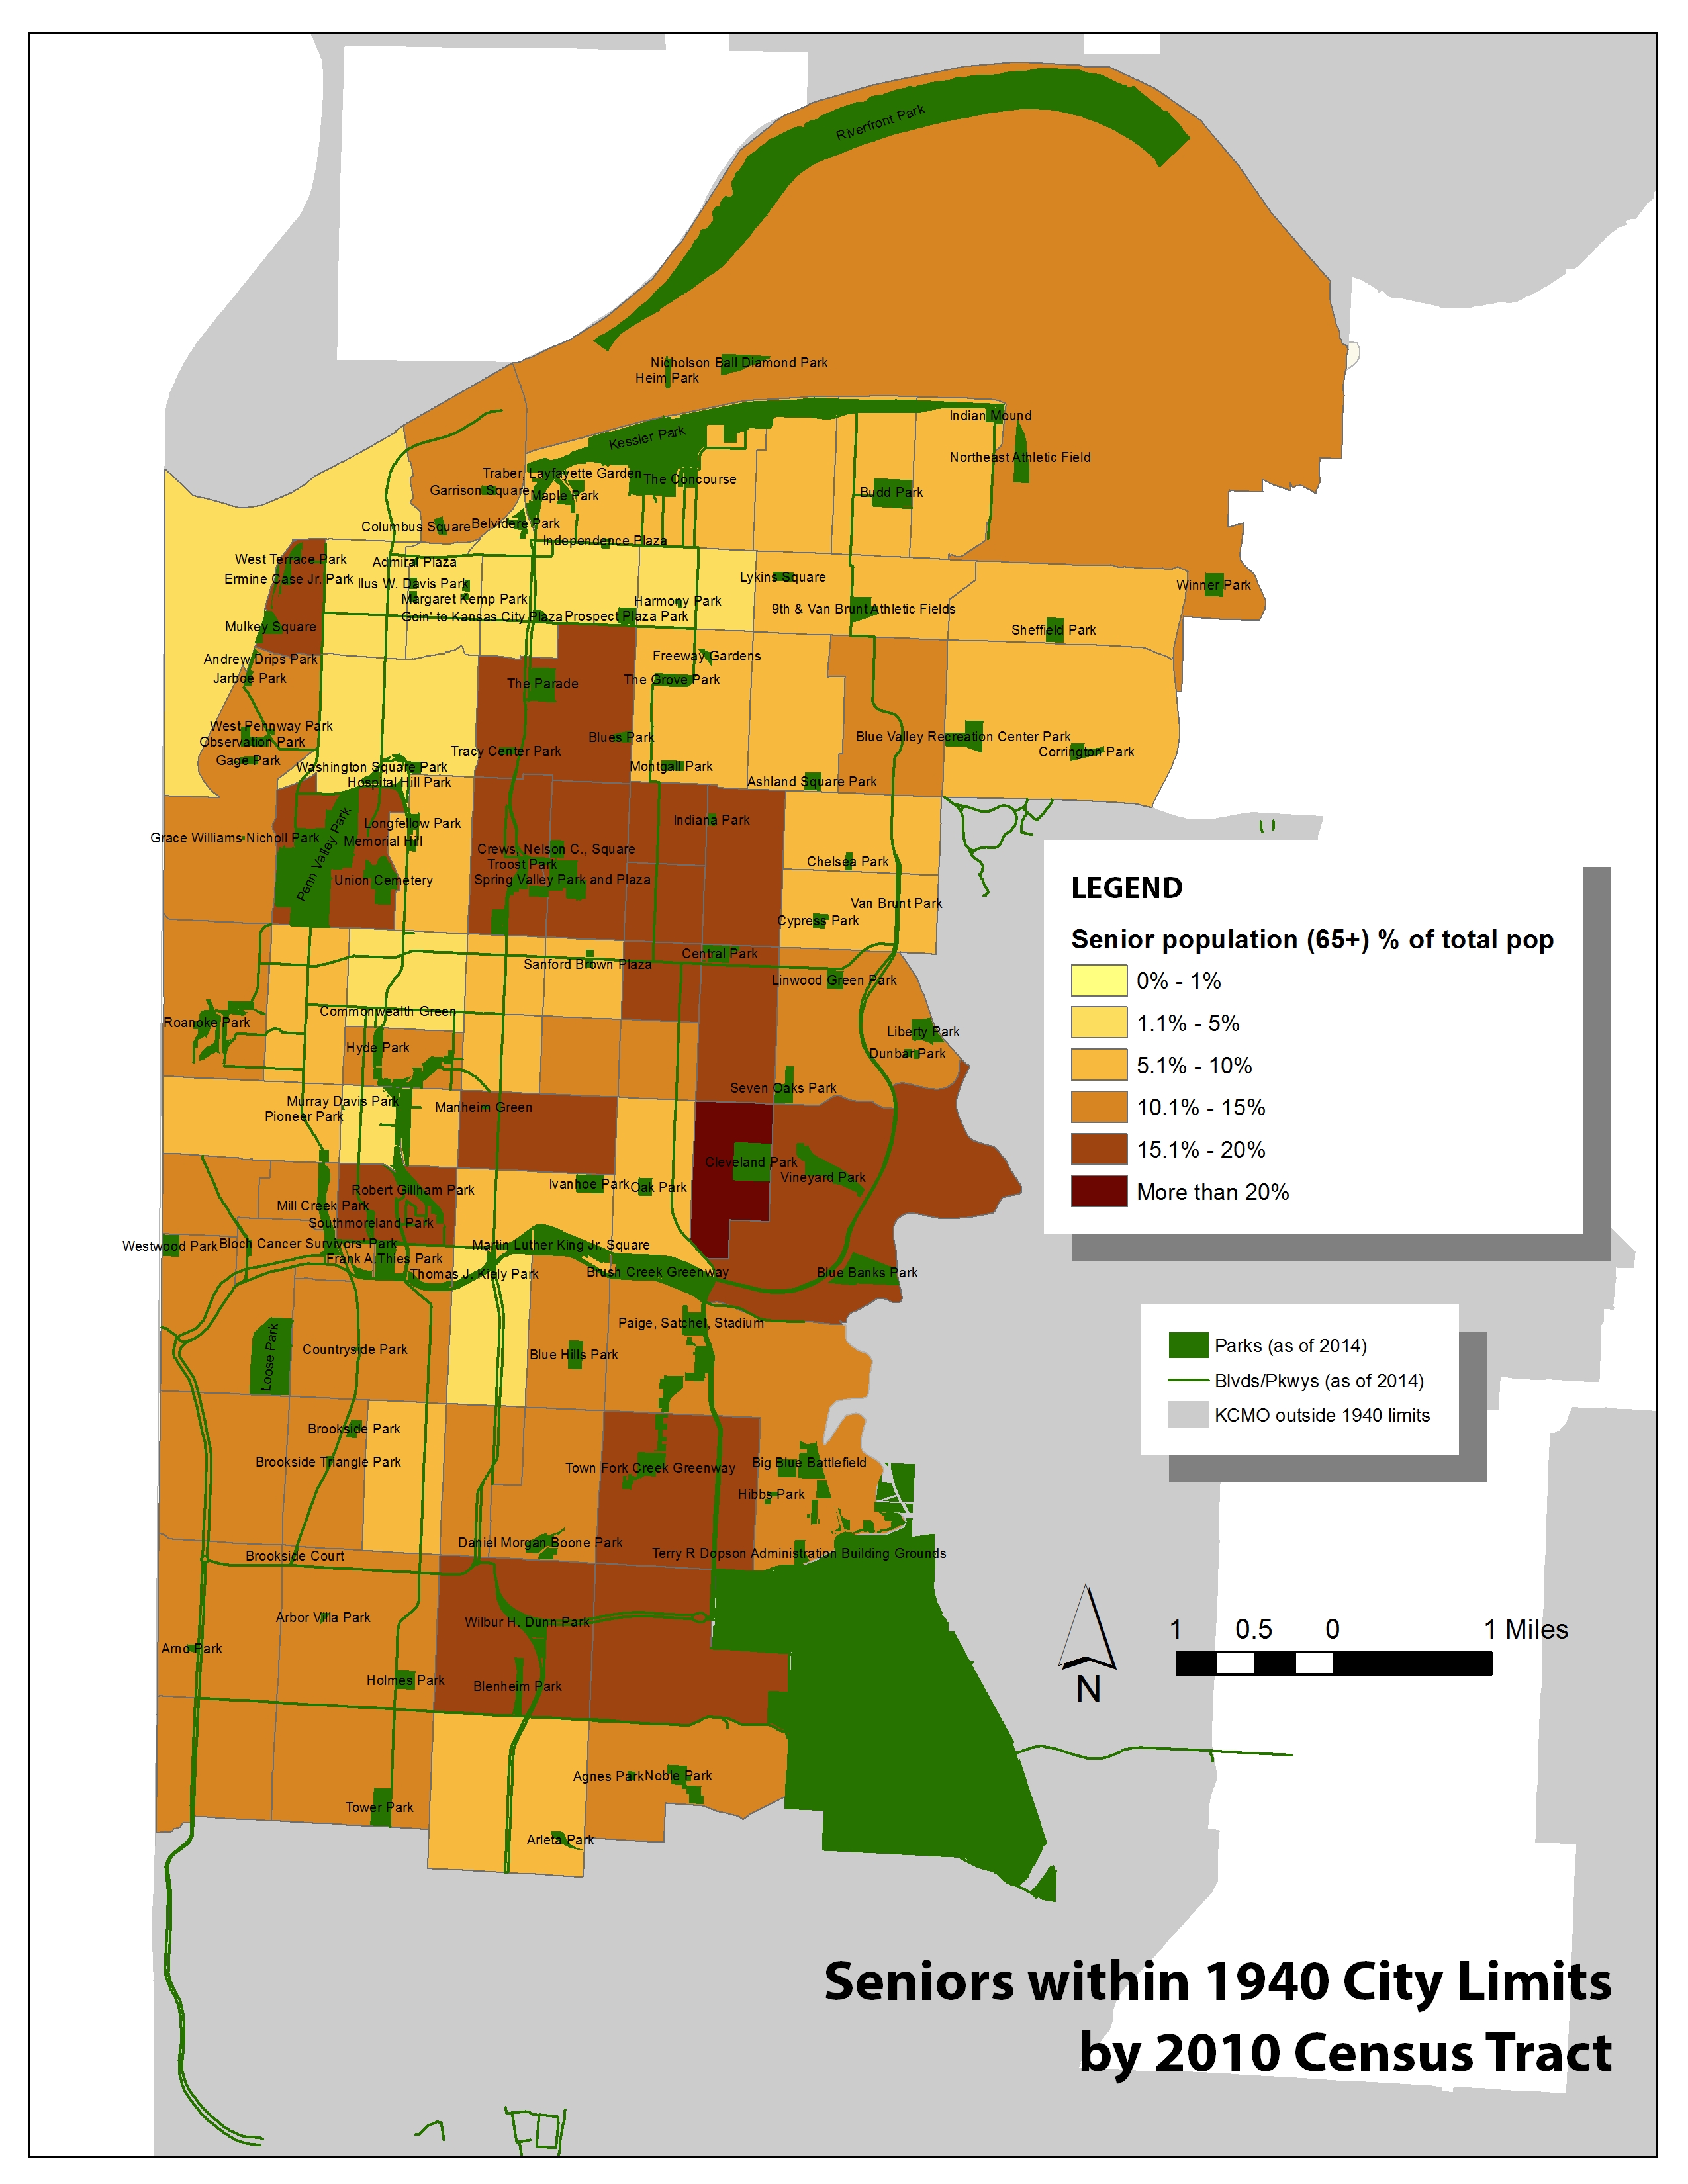
Among one of the ways any city’s population differs noticeably is in age. Kids, teens, young adults, other adults, and seniors — they characterize a city, even affecting its built form, as they might live in different areas and need different facilities.
Within that area, the population breaks down this way today:
Approximately 40% of the city’s total population lives here today.
The way the Census Bureau breaks down age makes it difficult to classify age groups, or “cohorts”. The “high school” cohort I’ve created only goes up to age 17 because that’s where the Census Bureau defines the end of a group.
Still adults — “young adults” and “adults 35-64” combined — are clearly the most populous group. Now, that’s likely because they are the largest groups in terms of age — both groups combined make a 40-year span.
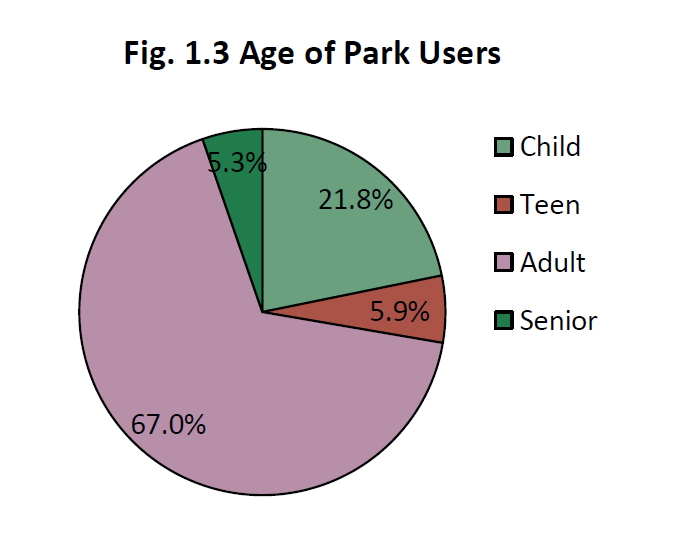
But the seemingly imbalanced breakdown is very telling when compared with the right data — for instance, park users by age.
Researchers from the University of Missouri — Columbia and Kansas State University undertook the Kansas City Parks and Physical Activity Project, beginning in 2008. They survey park users at four major Kansas City parks (all of which fall in the 1940 city limits), looking at demographic characteristics and at how those users used the park.
The ages of users broke down like this:
What’s interesting here is that the age breakdown of park users largely matches that of the Kansas City population in general. So in terms of age, Kansas City’s parks seem to adequately serve each group of residents. I also ran the distribution of park acreage across the city through a test in our GIS program — it came back as “random,” meaning there’s no measurable spatial clustering. (I did not include huge Swope or Riverfront parks in the test, to be clear.)
But different age groups are dispersed a little differently across the city.
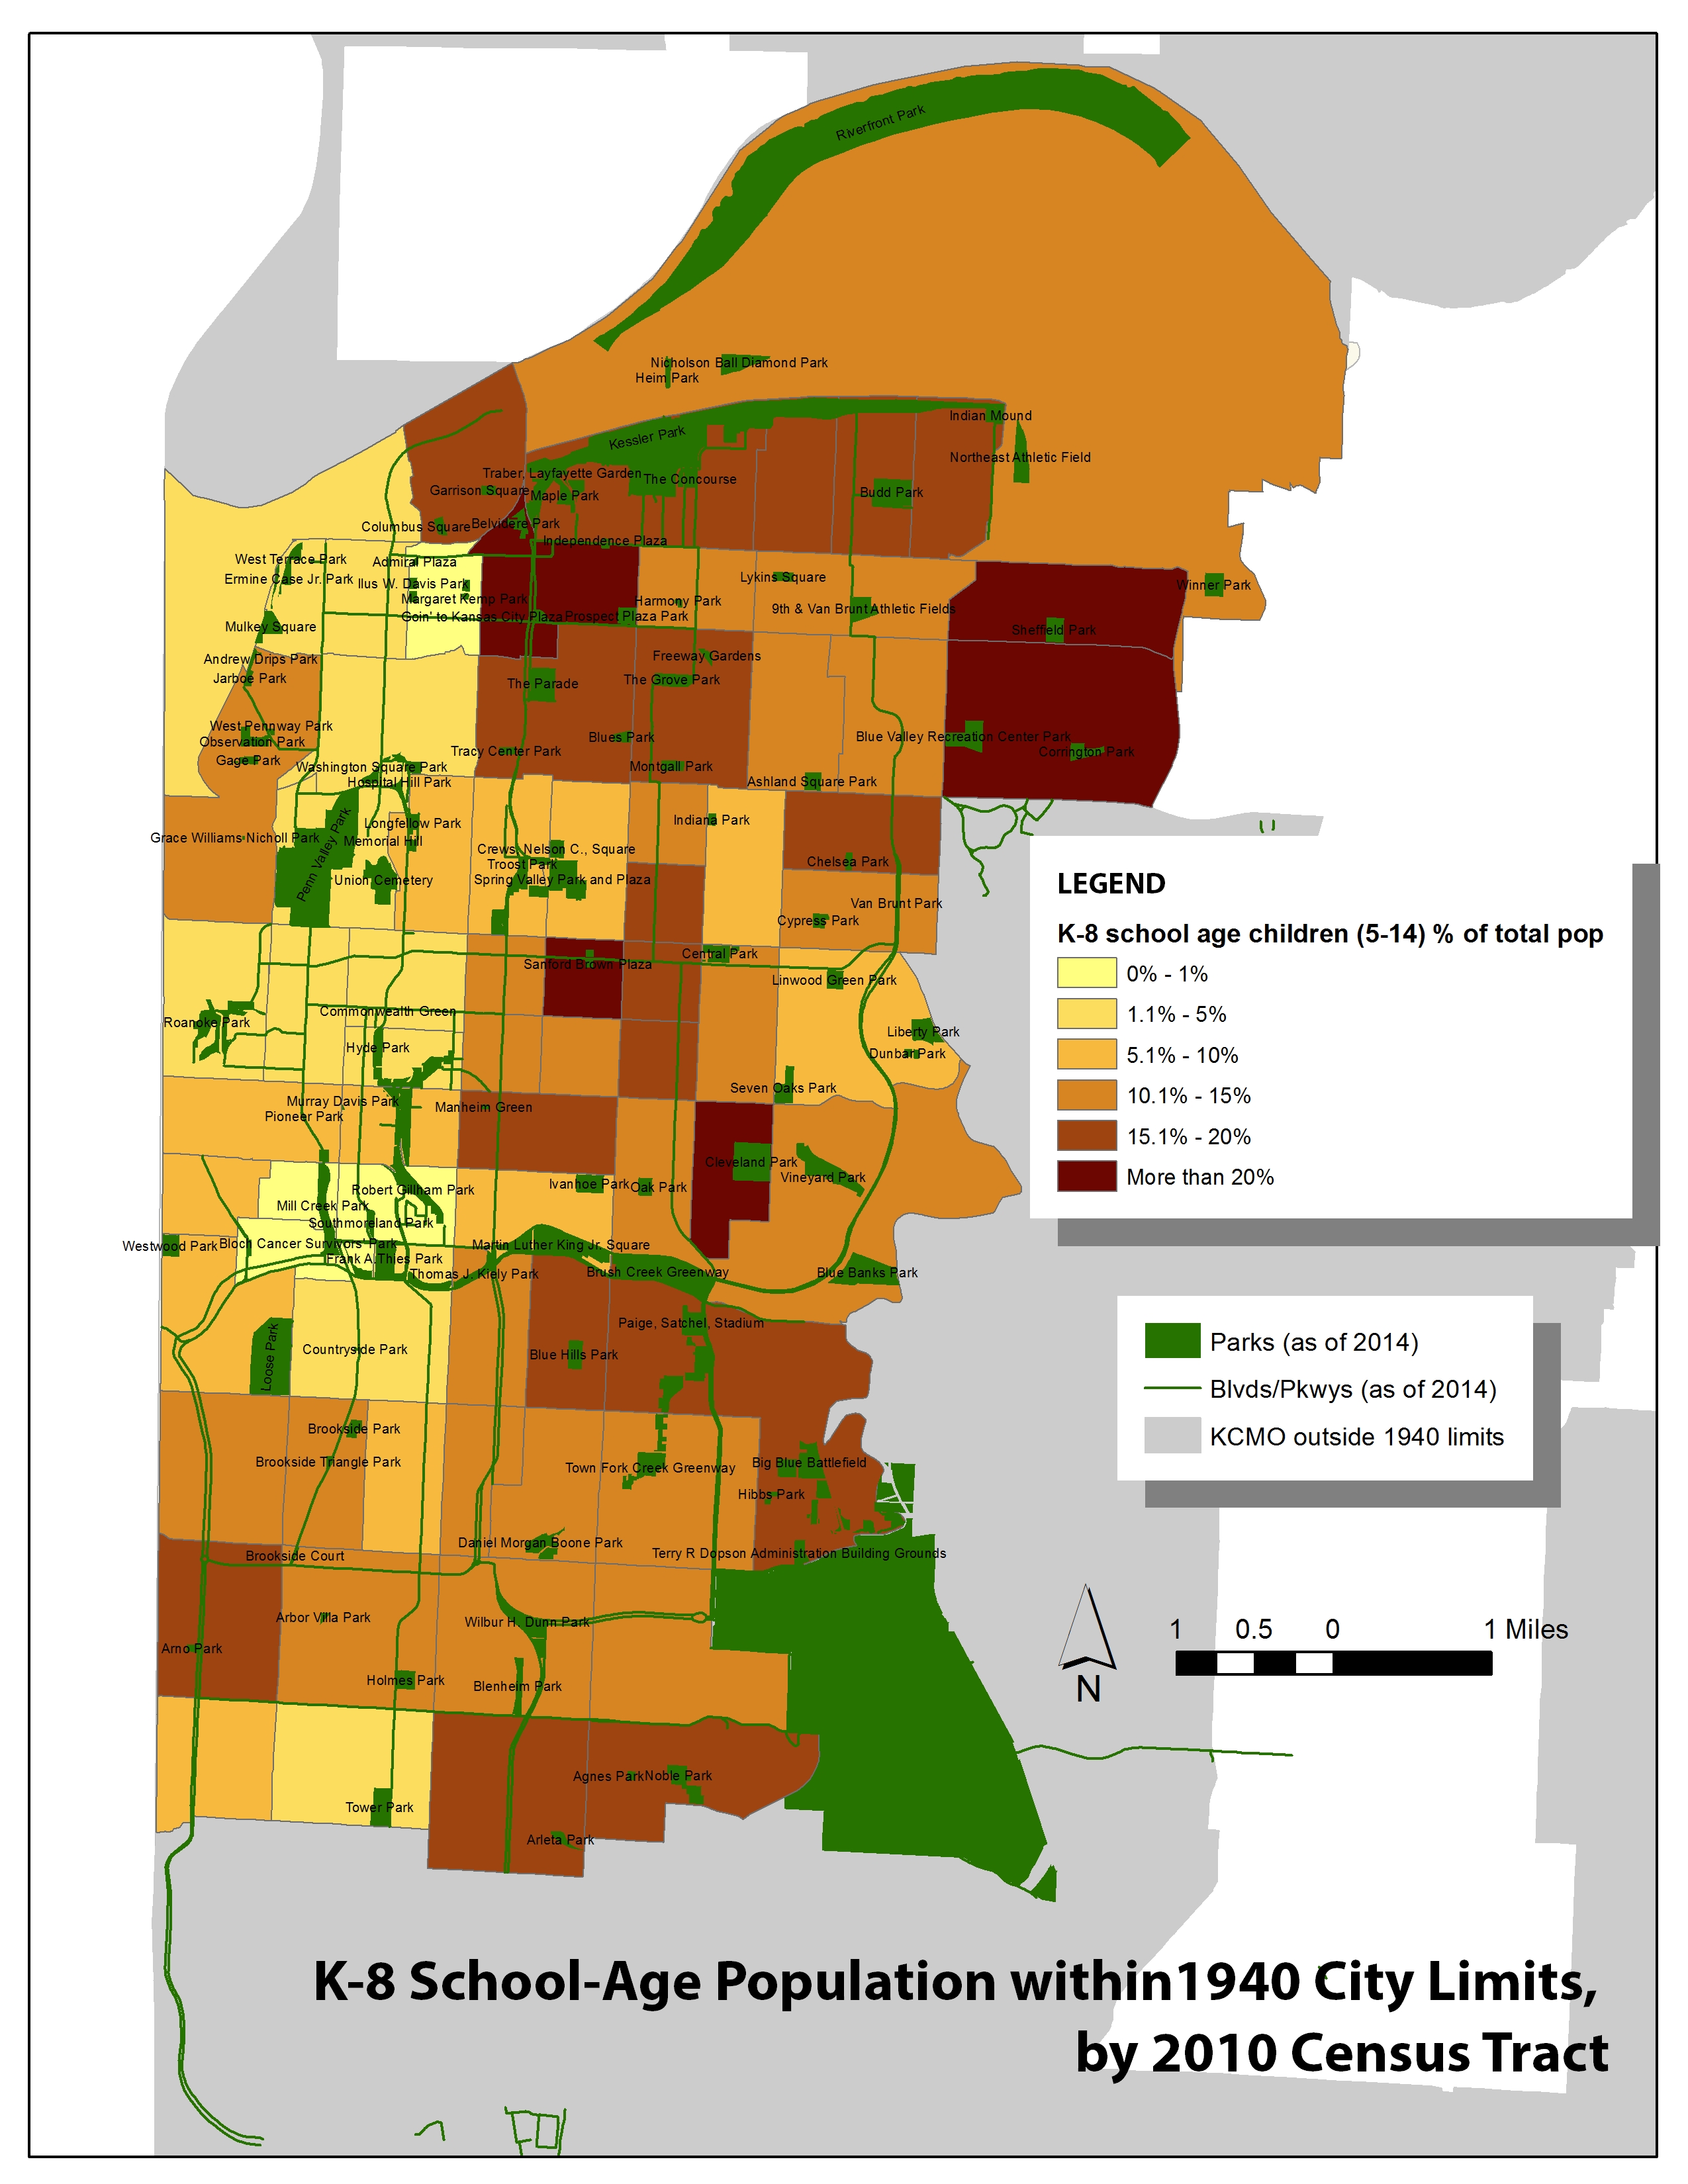
The youngest people — those who might use playgrounds — are more concentrated to the east and north of the 1940 city, as seen in the two maps below.
Many of the tracts where more children live have parks; some don’t, though. (I’m working on getting playgrounds into a map to see where they land.)
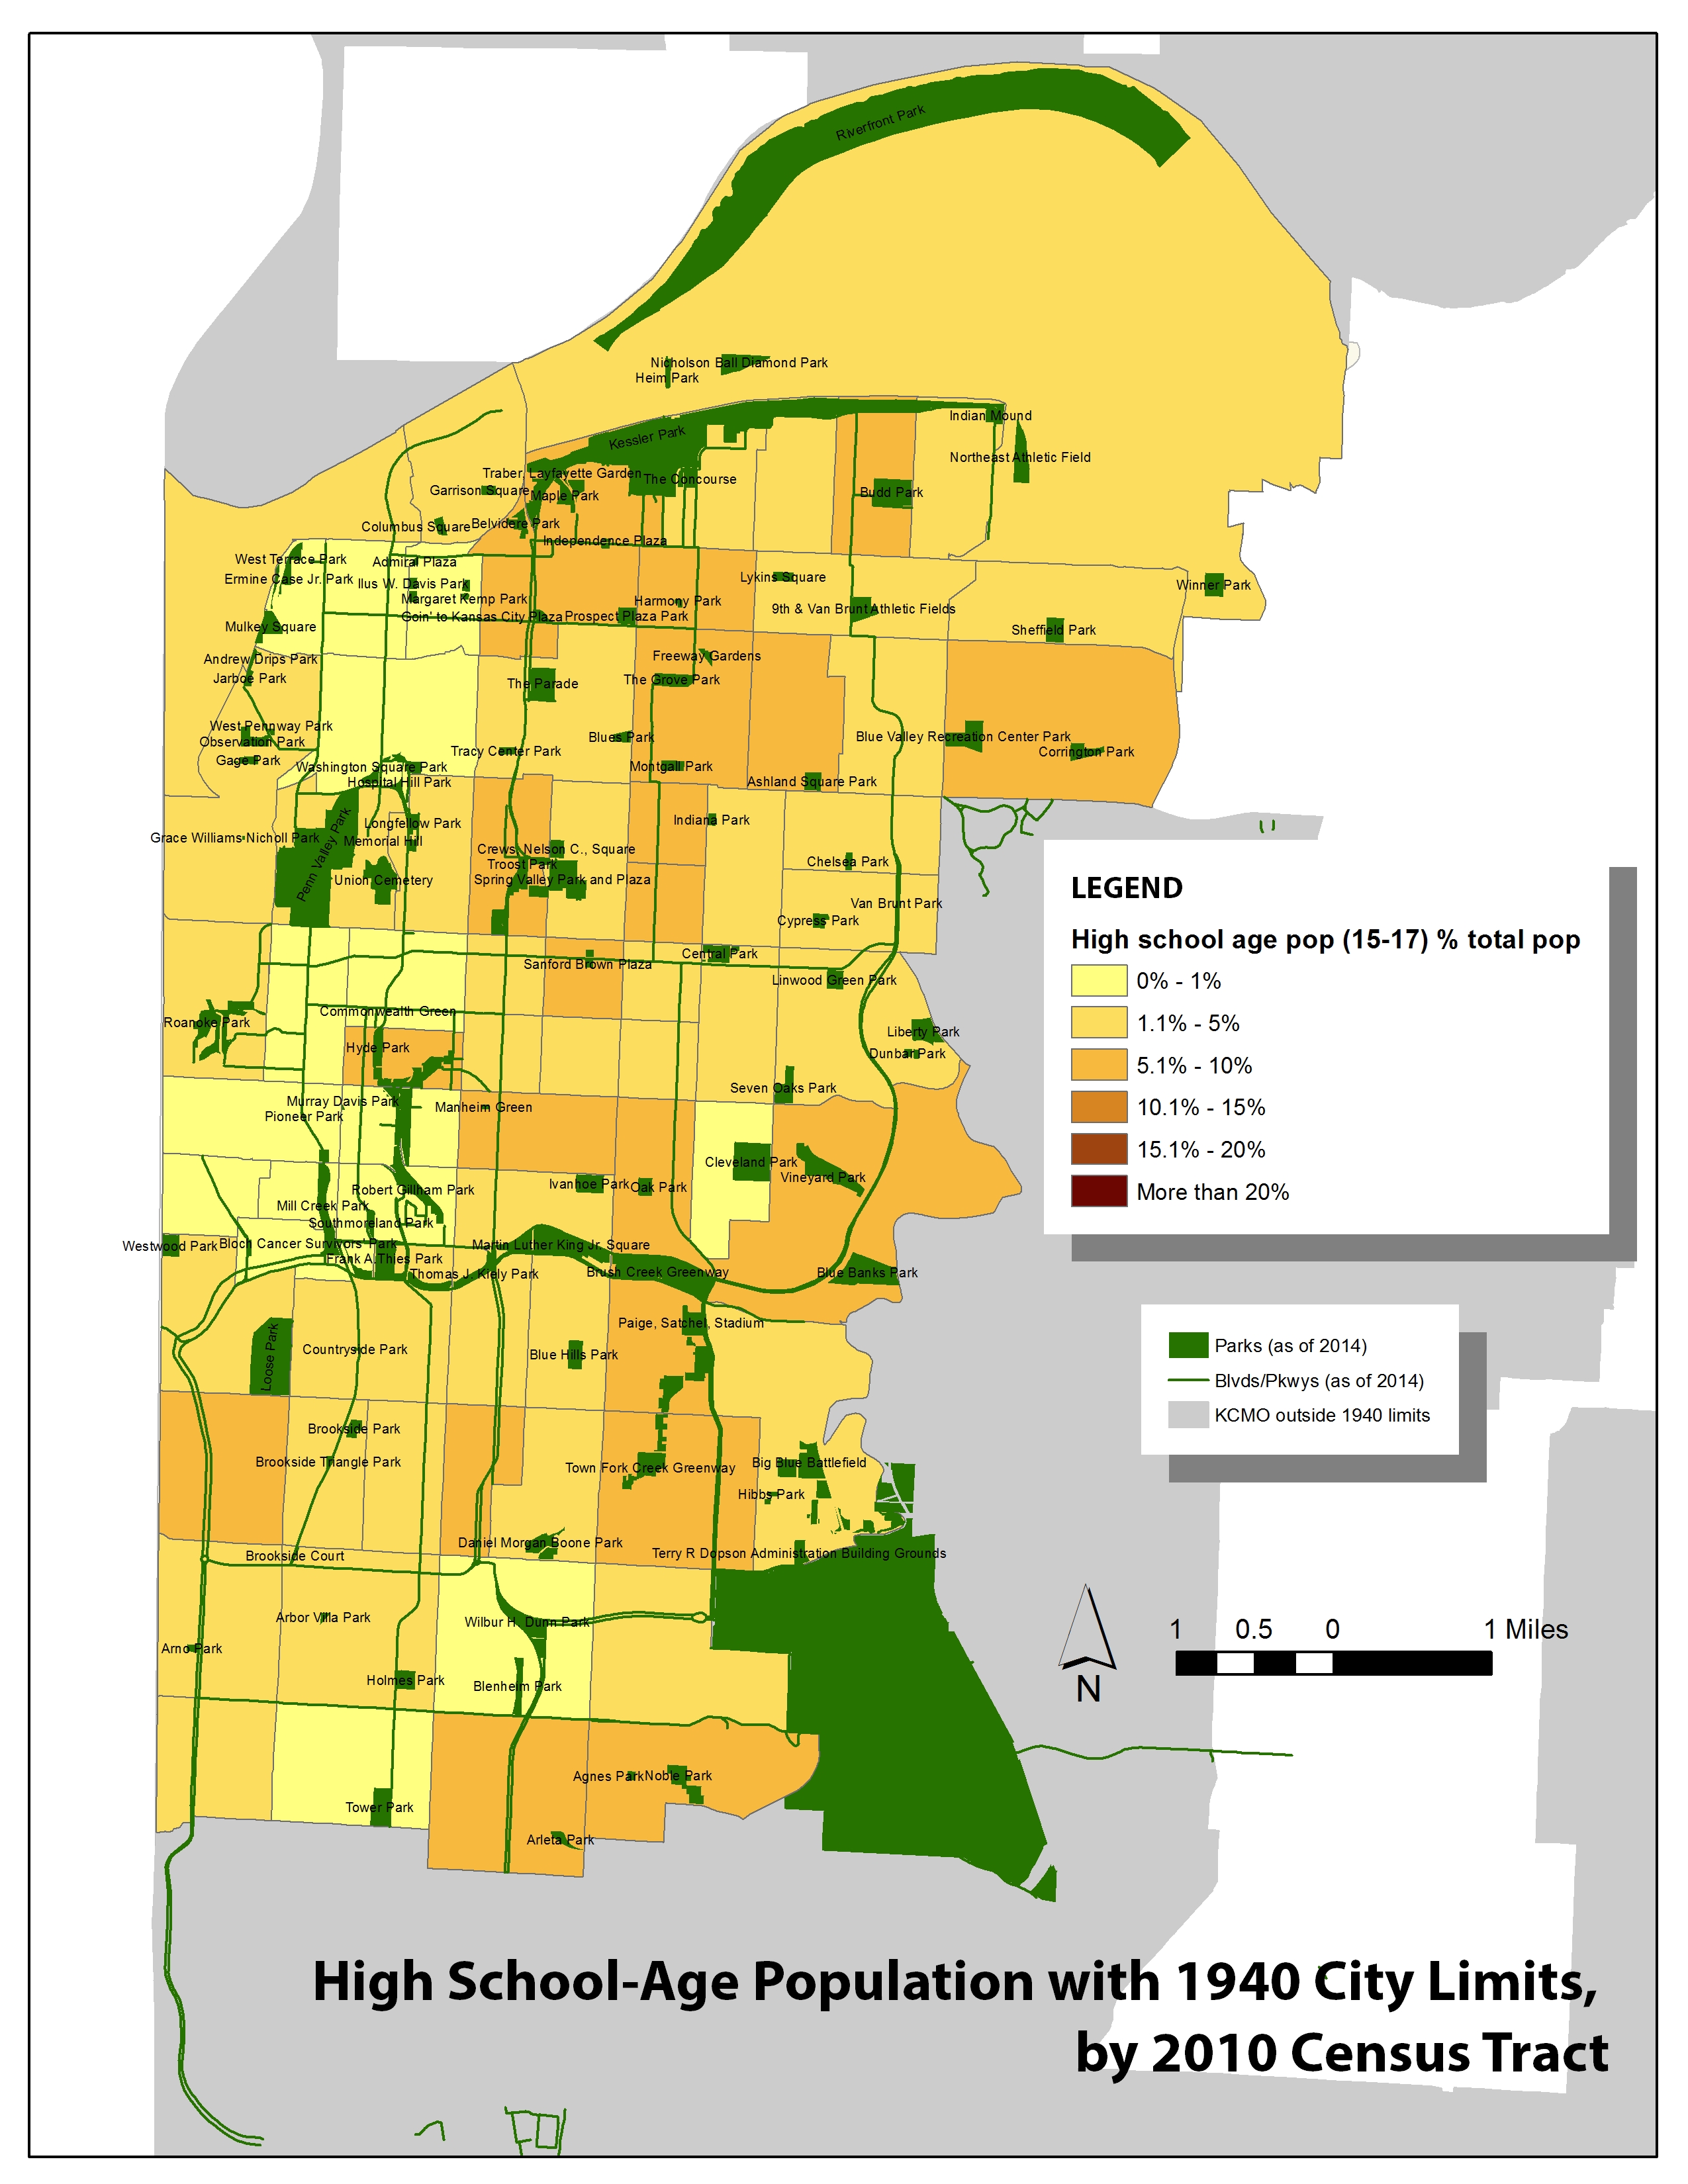
High school-aged Kansas Citians, who might use park differently, are concentrated the same — though there are simply fewer of them.
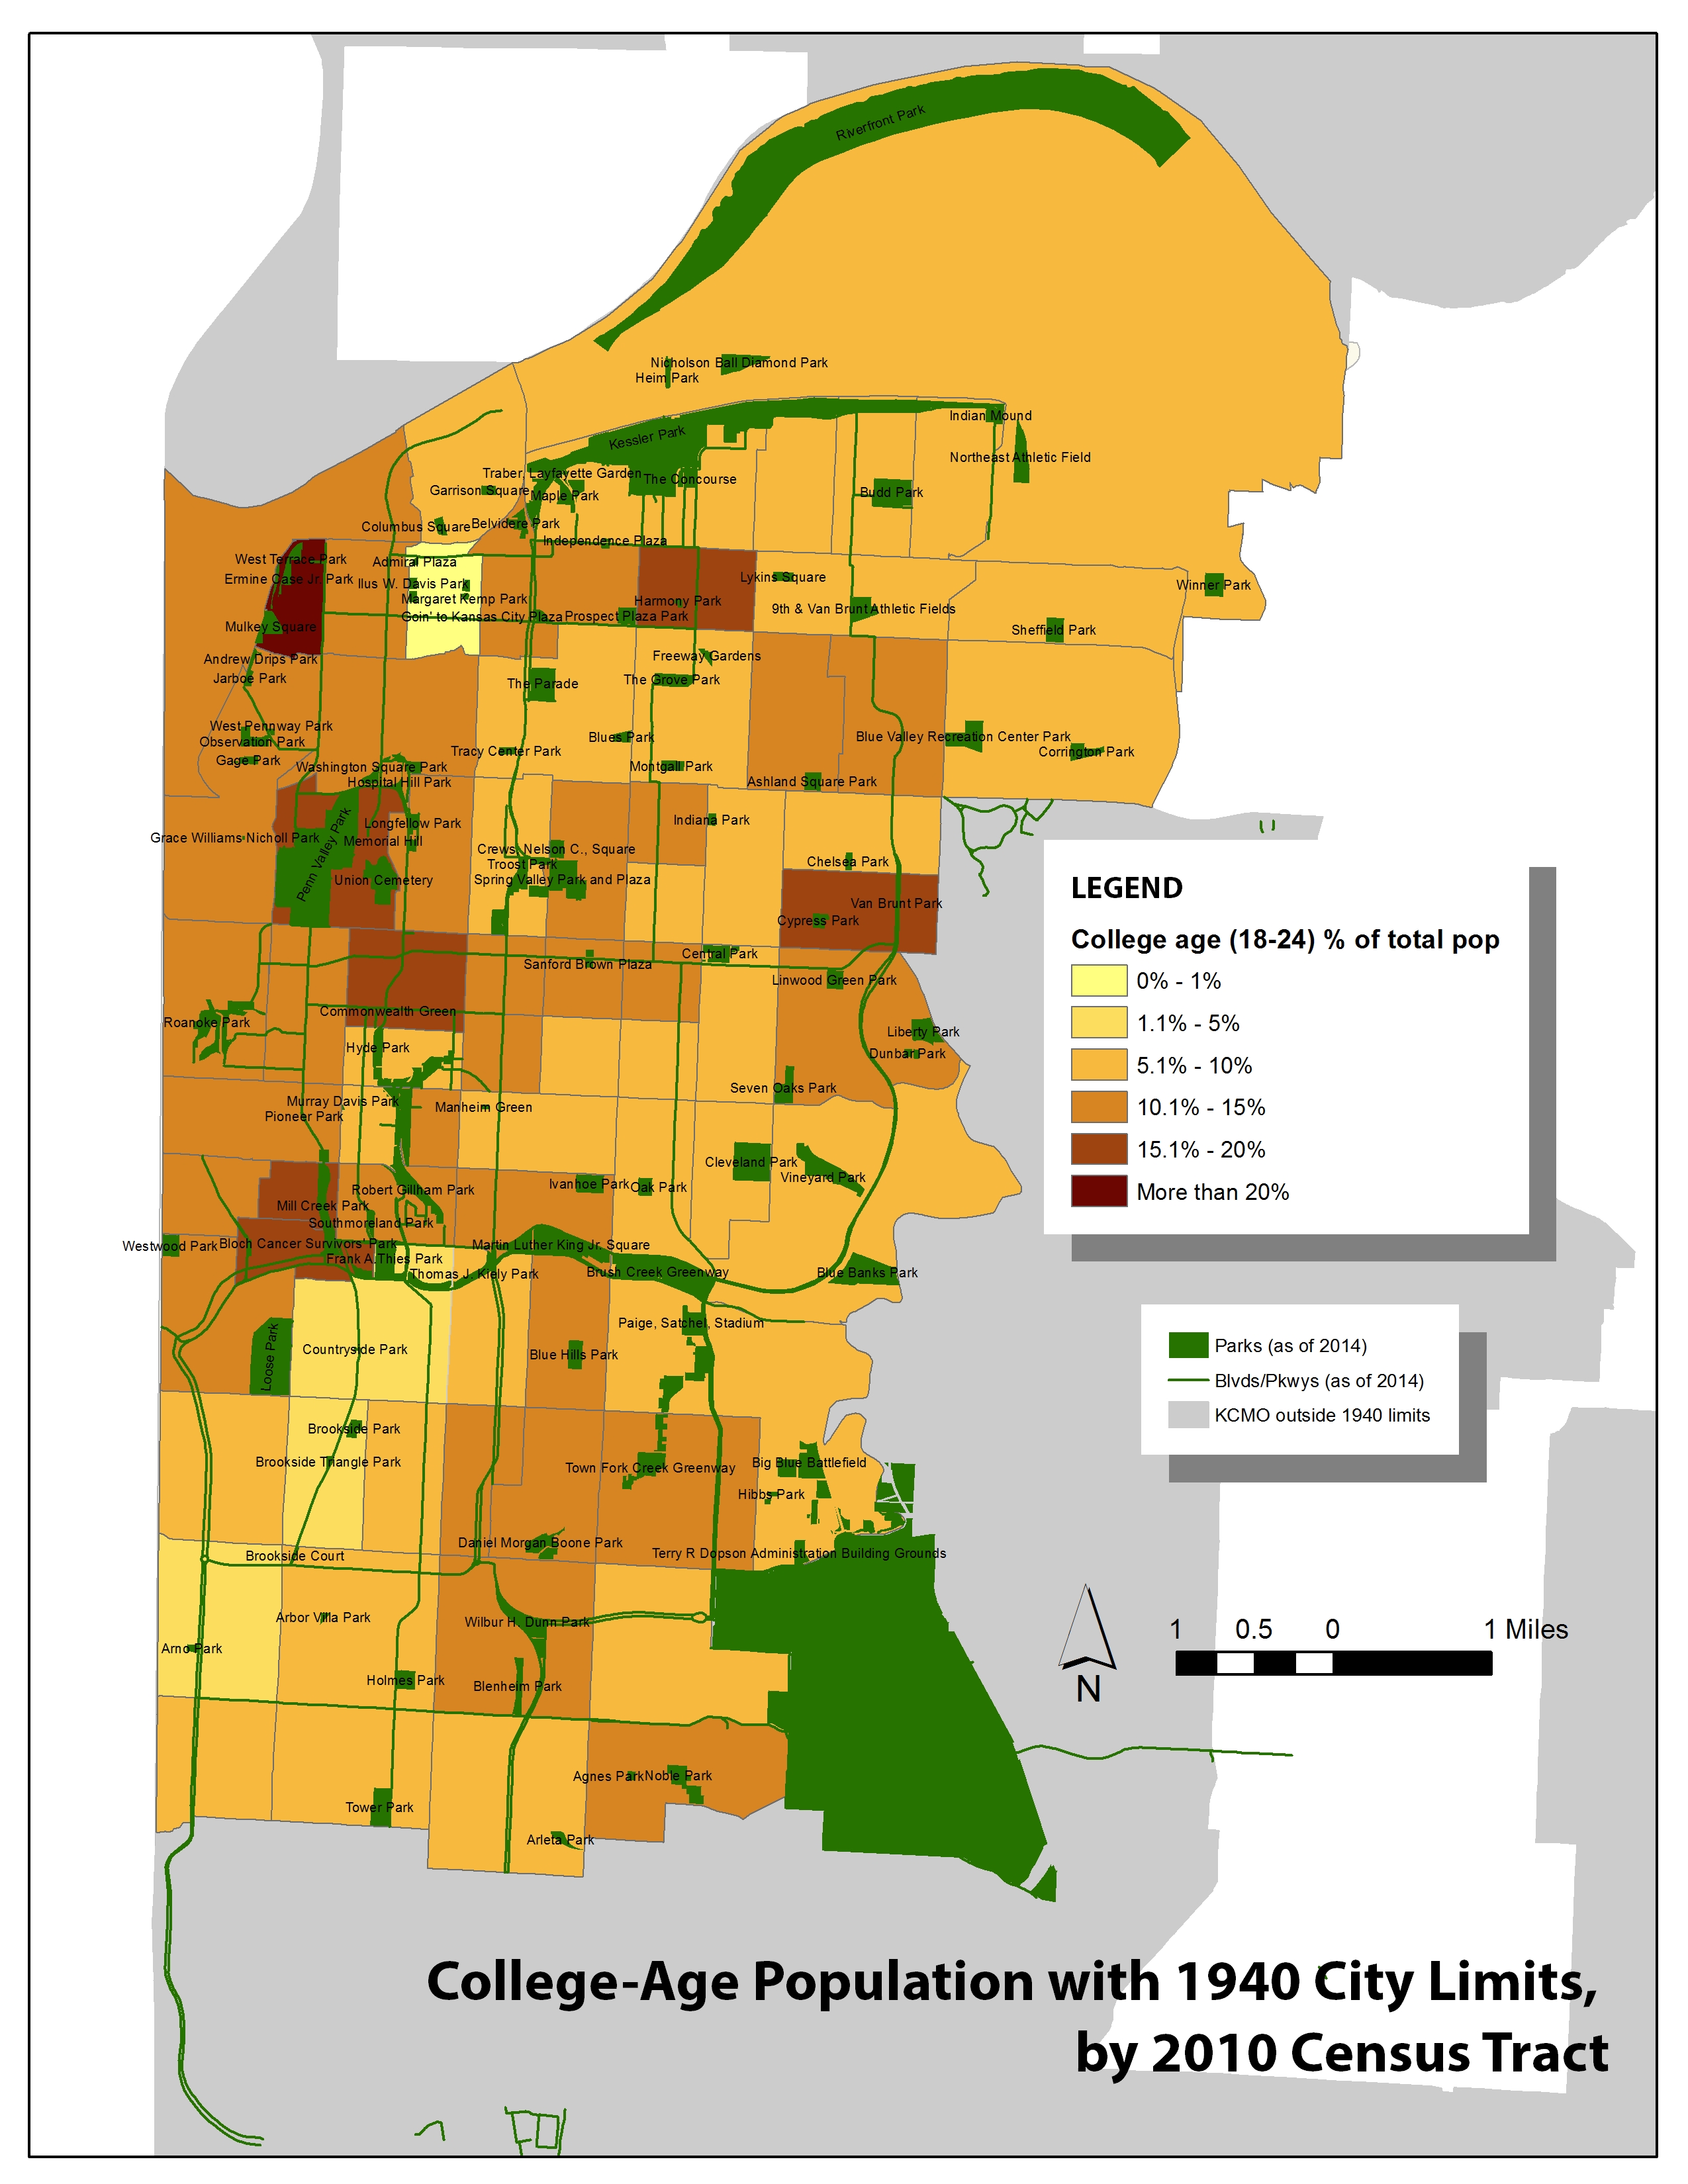
College-age residents (which is not to say college students, necessarily) are skewed more the north and west of the part of the city we’re studying. In fact, they seem clustered around some of the city’s most popular parks, like Penn Valley and Mill Creek. It’s doubtful that this age group is choosing to locate around parks specifically — but what about these popular parks affects the neighborhoods around them such that these young people want to live there?
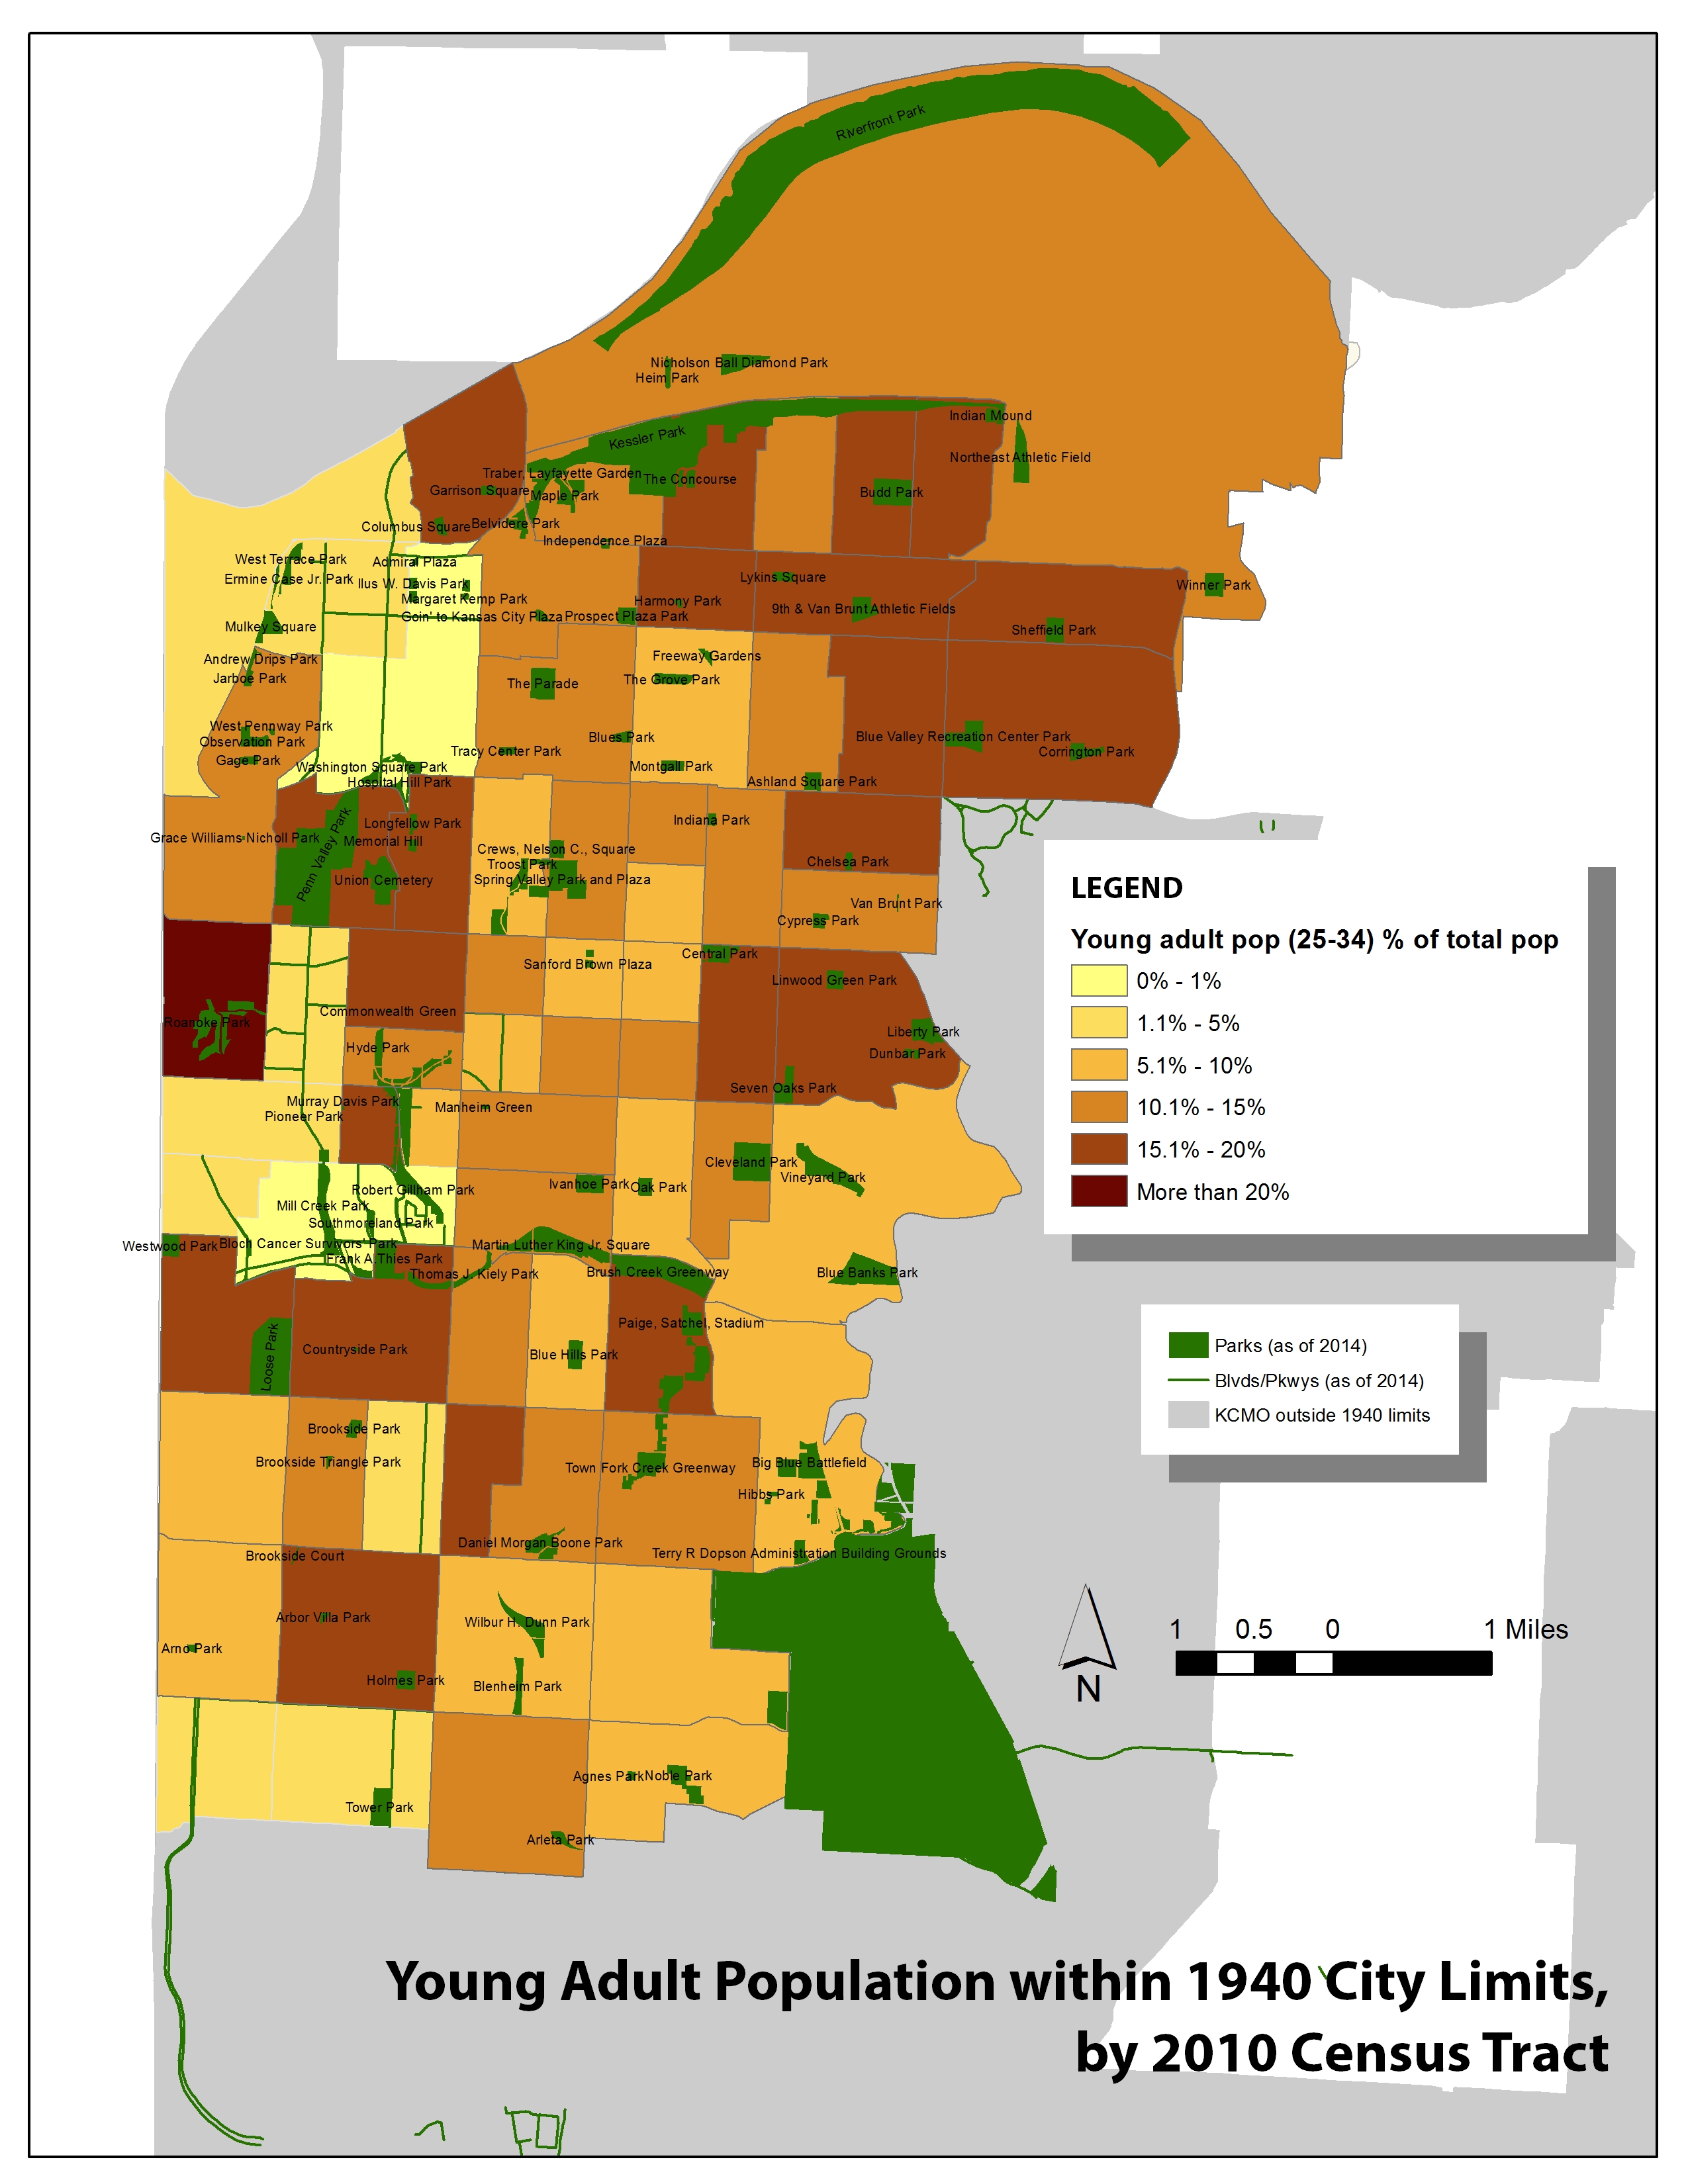
Young adults, which I’m defining as people aged 25-34, appear more spread out. (There are more of them — it’s a bigger age group.) The most popular area for this group is the Roanoke neighborhood, which is centered around Roanoke Park.
The population aged 35-64 is skewed a little towards the east, not “unserved” by parks, but far from the most iconic ones.
Seniors are spread out, but clustered towards the heart of the city, in areas generally served by a large park. There is also some clustering around Mill Creek and Penn Valley Park again.
Without more data, it’s impossible to know how these clusters of different age groups feel about the parks around them. But what is clear some age groups are found are certain parks. Meanwhile, many people — many young people — appear to not have any access to a park. More work is needed, but these patterns are a start.
Quick analysis skills are essential in the planning vocabulary, in the sense that they allow you to break down and analyze various types of research and data, and illustrate findings in an expeditious manner. A series of in class quick analyses looked at multiple characteristics of Kansas City’s Parks and Boulevards, including a thematic comparison, illustrating the relationship of demographic and socio-economic data and the distribution of parks, as well as past and present patterns in land use and zoning.
The boundaries of study for this series of analyses represent the 1947 city limits, with the Missouri River to the north, the Blue River to the east, 79th Street to the south, and State Line to the west.
THEMATIC ANALYSIS
This first analysis was intended to show either the direct or indirect relationship between the amount of available park space and median household income. To begin analyzing the data, an inventory of 117 parks spread out across 86 Census Tracts were mapped using ArcMap GIS Software, in combination with income information from the 2012 American Community Survey.
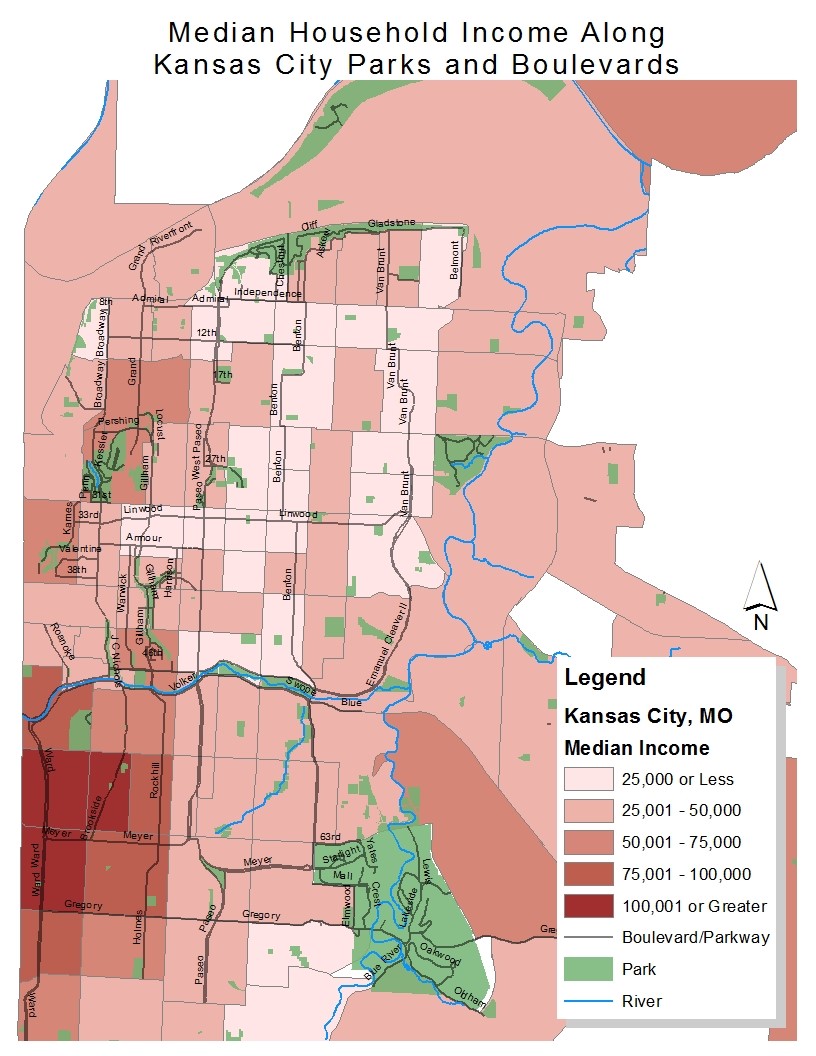
Figure 1: Median Household Income of Kansas City, MO (2012)
Figure 1 shows the locations of parks across multiple census tracts in Kansas City, and illustrates several patterns related to income levels and park access. The map shows that many of the larger sized parks, including Kessler Park, Blue Valley Park, Swope Park, Loose Park, and Penn Valley Park are all located towards the outskirts of the study boundaries. Together, these parks account for nearly 2,600 acres of park space, more than half of the total park acreage for the entire study area, which is roughly 5,055 acres.
A second pattern, pertaining to income levels, is that the majority of high median income residences ($75,001 or greater) are located in census tracts to the western boundary of the analysis area. These tracts include a large number of residences in the Brookside neighborhood, as well as several from the South Plaza area. Coincidentally, these are also the location of some of the higher quality parks listed on Kansas City’s Parks and Boulevard System. Loose Park, arguably one of the systems gems, is located to the north of the Brookside Neighborhood, and is surrounded by tracts with median household incomes of $75,001 or greater.
Similarly, areas of Kansas City with a lower quality or parks, or a lower concentration of park space in general were often associated with lower income levels ($25,000 or less). Looking at the Eastern part of Kansas City, along Van Brunt Boulevard, from 12th Street to 31st Street, Figure 1 shows a very low concentration of parks. This 2 mile stretch of Van Brunt hosts only 6 parks, totaling 60 acres
The conclusion of this analysis determined a relationship between park accessibility and median household income, in the sense that areas with lesser park space were often associated with areas of lower income. Areas with a higher number of parks, and in most cases, a larger concentration, showed higher levels on income.
ZONING AND LAND USE ANALYSIS
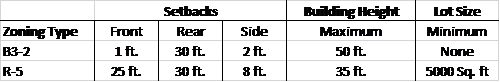
The second analysis focused on land use patterns and zoning requirements, and how they differ based on location. The scope for this assessment focused on Roanoke Road, from 39th Street to Valentine Road, which is currently zoned for B3-2 commercial uses, and R-5 residential use.
Table 1: Bulk Zoning Requirements – Kansas City, MO
Regulations for residential development in this area are comparable to surrounding neighborhoods. Regulations for development in the B3-2 zone are slightly stricter however. Since commercial developments in this area are abutted against a residential zone, additional regulations are imposed.
Figure 2: Land Use in Midtown Kansas City
In this area, land use regulations determine where different types of development can take place. As I found in the last analysis, many houses along 39th Street were removed several years ago, and the area was rezoned for commercial use. Looking at Figure 2, you can see the development patterns of commercial use. Notice that although this corridor is zoned for B3-2 commercial use, there is a nonconformity of more than ten lots that are currently used for residential purposes along 39th. It is likely that this was enabled by the use of a variance, but the reason is unclear. Beyond 39th Street to the north, the remainder of lots are currently used for residential purposes, including single family and multifamily dwellings.
Doing rapid analysis can yield some pretty great results. When a time constraint is given to you, not only do you work faster, but you are forced to edit down to whats important.
Our studio did 3 separate 3 hour studies of the parks and boulevards system. We looked at the system as a whole, history of many of the “knuckles”, and the planning, zoning and land use in said areas.
PUBLIC TRANSPORTATION WITHIN PARKS & BOULEVARDS
Data Gathering
In order to study the relationship of public transportation and the parks and boulevards system in Kansas City, reliable data must be gathered and properly joined. The shape boundaries were taken from the 2010 Census Tract Boundary. The data fields that were used came from Social Explorer and included information from the 2008-2012 American Census Survey. Using commands in ArcGIS, the ACS data was joined to the Tract Boundary shape file and a data dictionary was used to rename specific fields.
The study boundaries for this analysis are from the Missouri River in the north, to the Blue River to the east, to 79th Street in the south, and State Line to the west. The New Park shape file and the ROW shape file were taken from the Parks and Recreation department from Kansas City, Missouri.
Process and Mapping
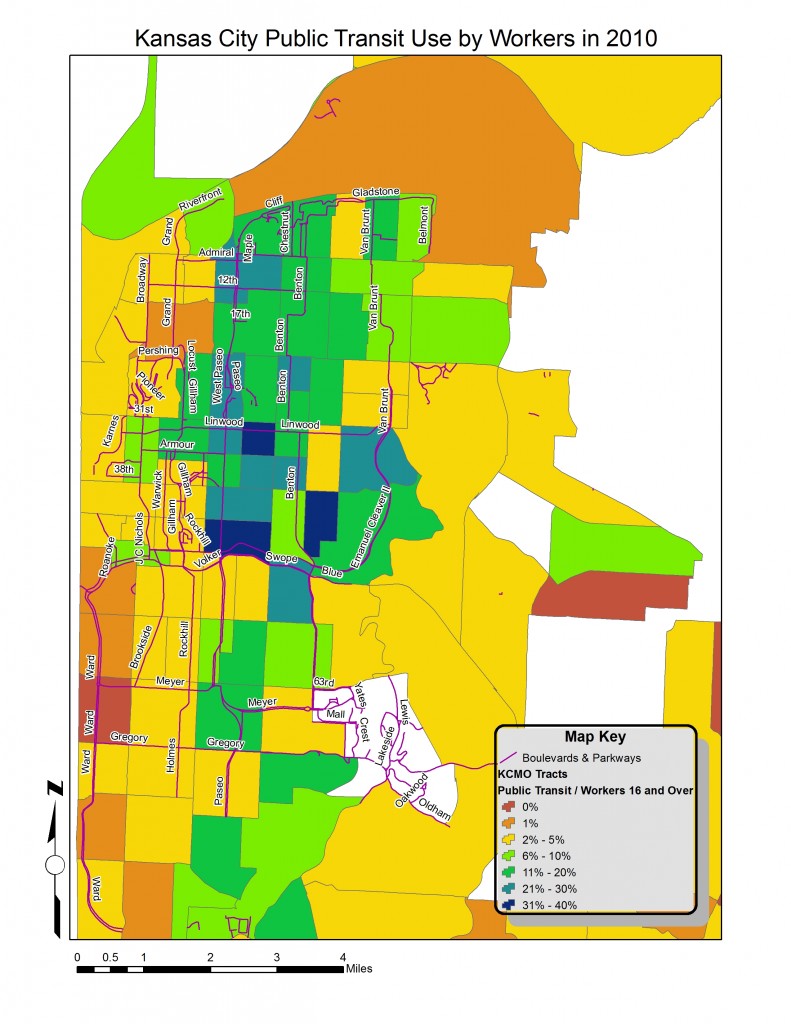
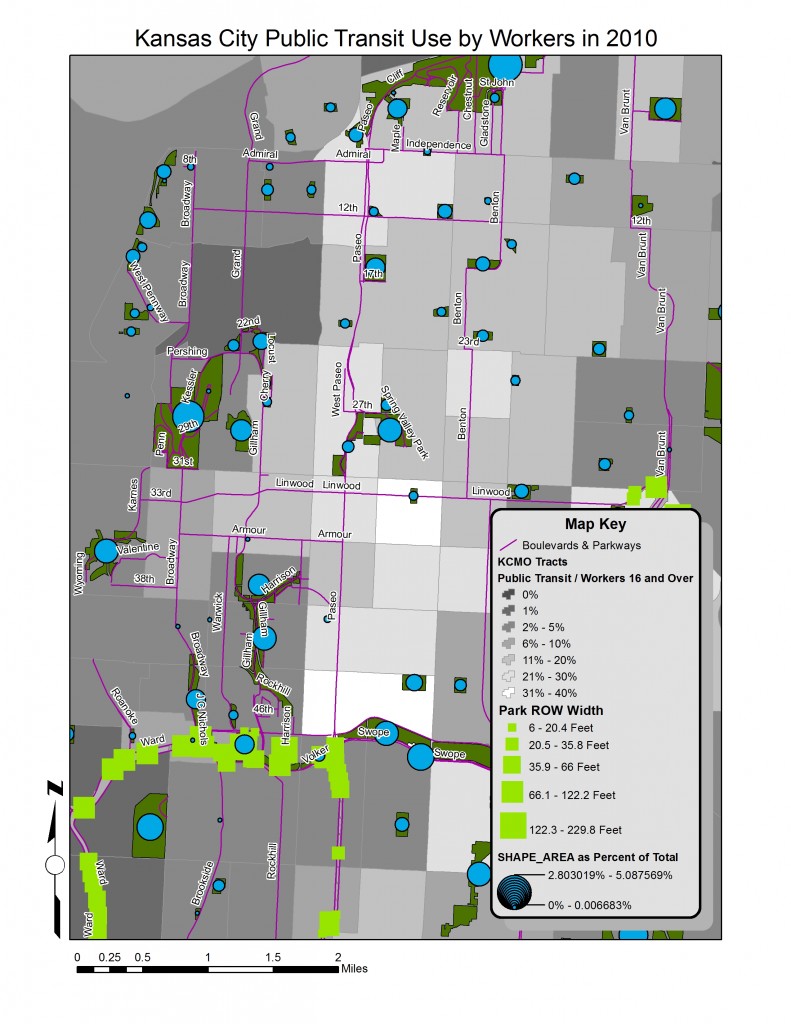
By using symbology, several things were able to be visually represented within the boundaries. The first thing that was vital to the map was a visual description of where people that use public transportation are. This was done by normalizing the (amount of workers who use) public transport data by the overall amount of workers. Another tool that was used were the shapefiles that show were the ROW parks and new parks are located.
By using symbology techniques, the ROW width was calculated by using a calculation of the area divided by the length of the polygon, the result was the width of the actual ROW. I then presented these sizes in an exaggerated rectangular green shape. The New park data was illustrated by showing the area of each park normalized by the total size of all the new parks. These were shown with blue circles whose size reflects the park size compared to the overall parks.
Analysis
There are several patterns that emerge when studying the maps that were created for this analysis. The first is that the majority of public transportation activity is located east of Troost and north of Emanuel Cleaver II/ Volker Parkway. There are census tracts that have 30% – 40% of its workers using public transportation to get to work. For all of Kansas City, MO there is a MEAN AVERAGE OF 6% that use public transportation, A MEDIAN OF 3%, and a STANDARD DEVIATION OF 8%. The AVERAGE WIDTH FOR THE PARK RIGHT OF WAY WIDTH WAS 42 FEET.
ROW’s tend to be in areas where there is low public transportation. When looking at the relationship between the amount of park space and ROW to the use of public transit, it can be seen that the areas using public transit the most, lack the most availability to the parks and boulevards system.
Design Strategies
History
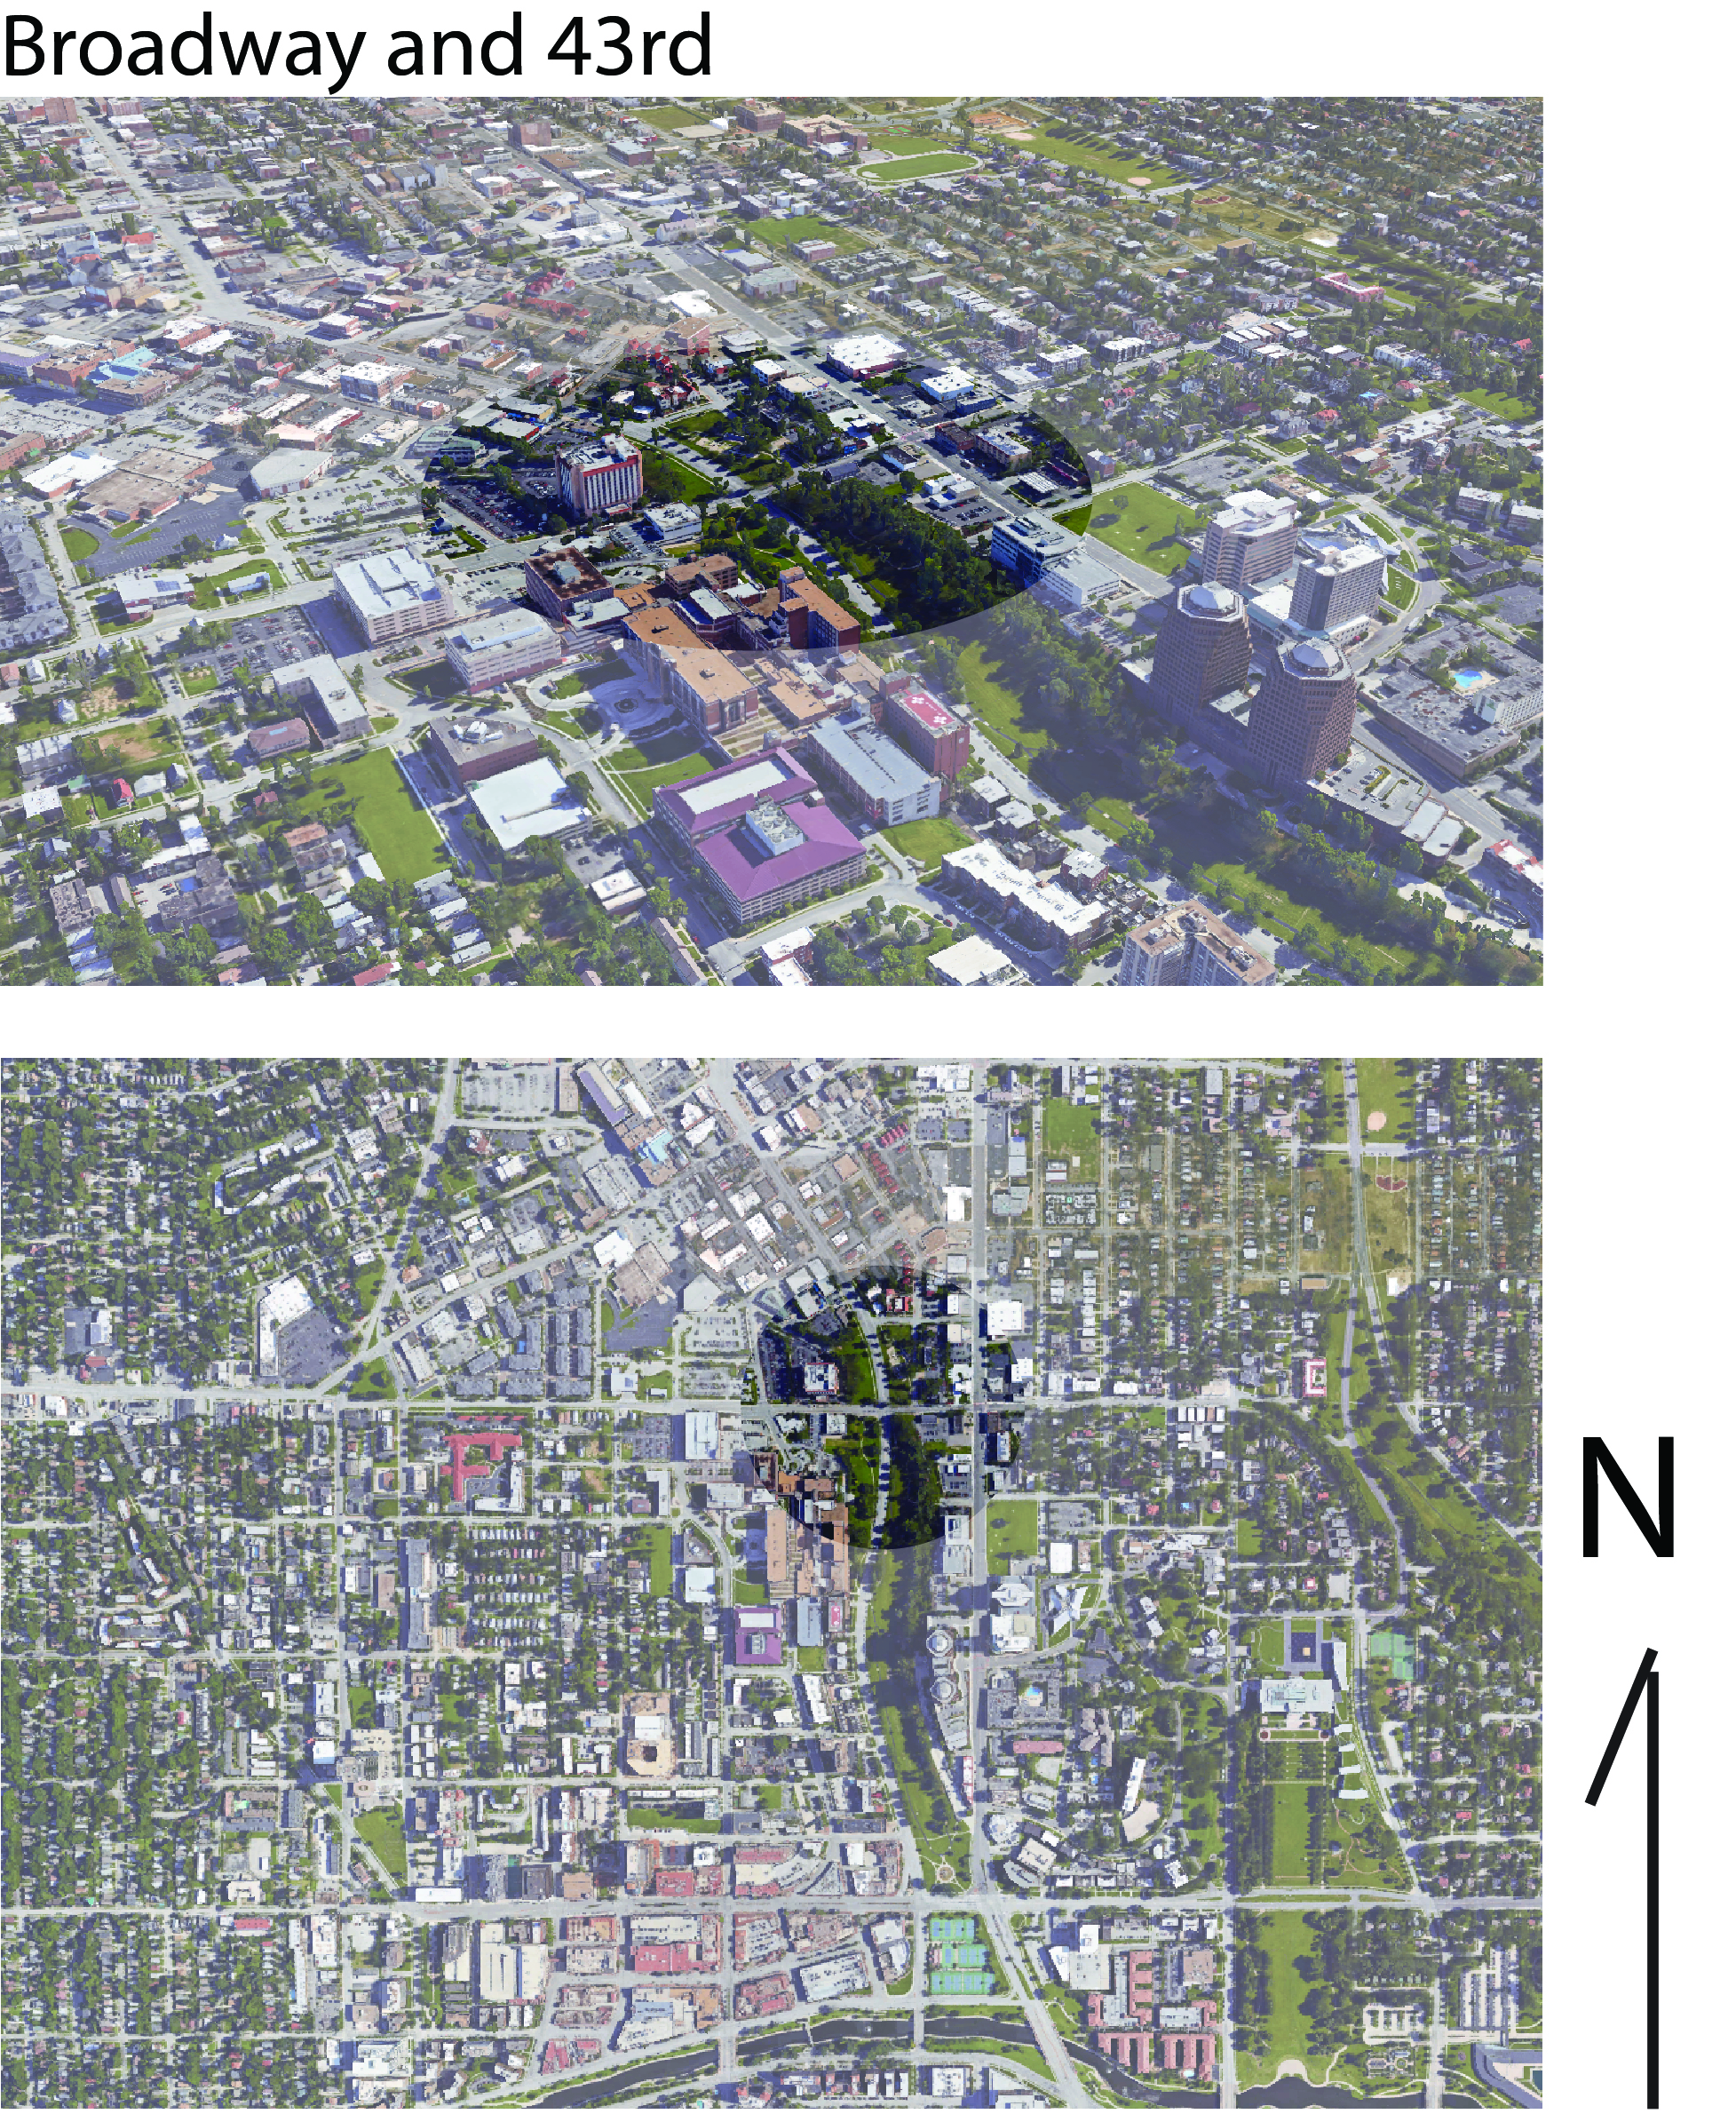
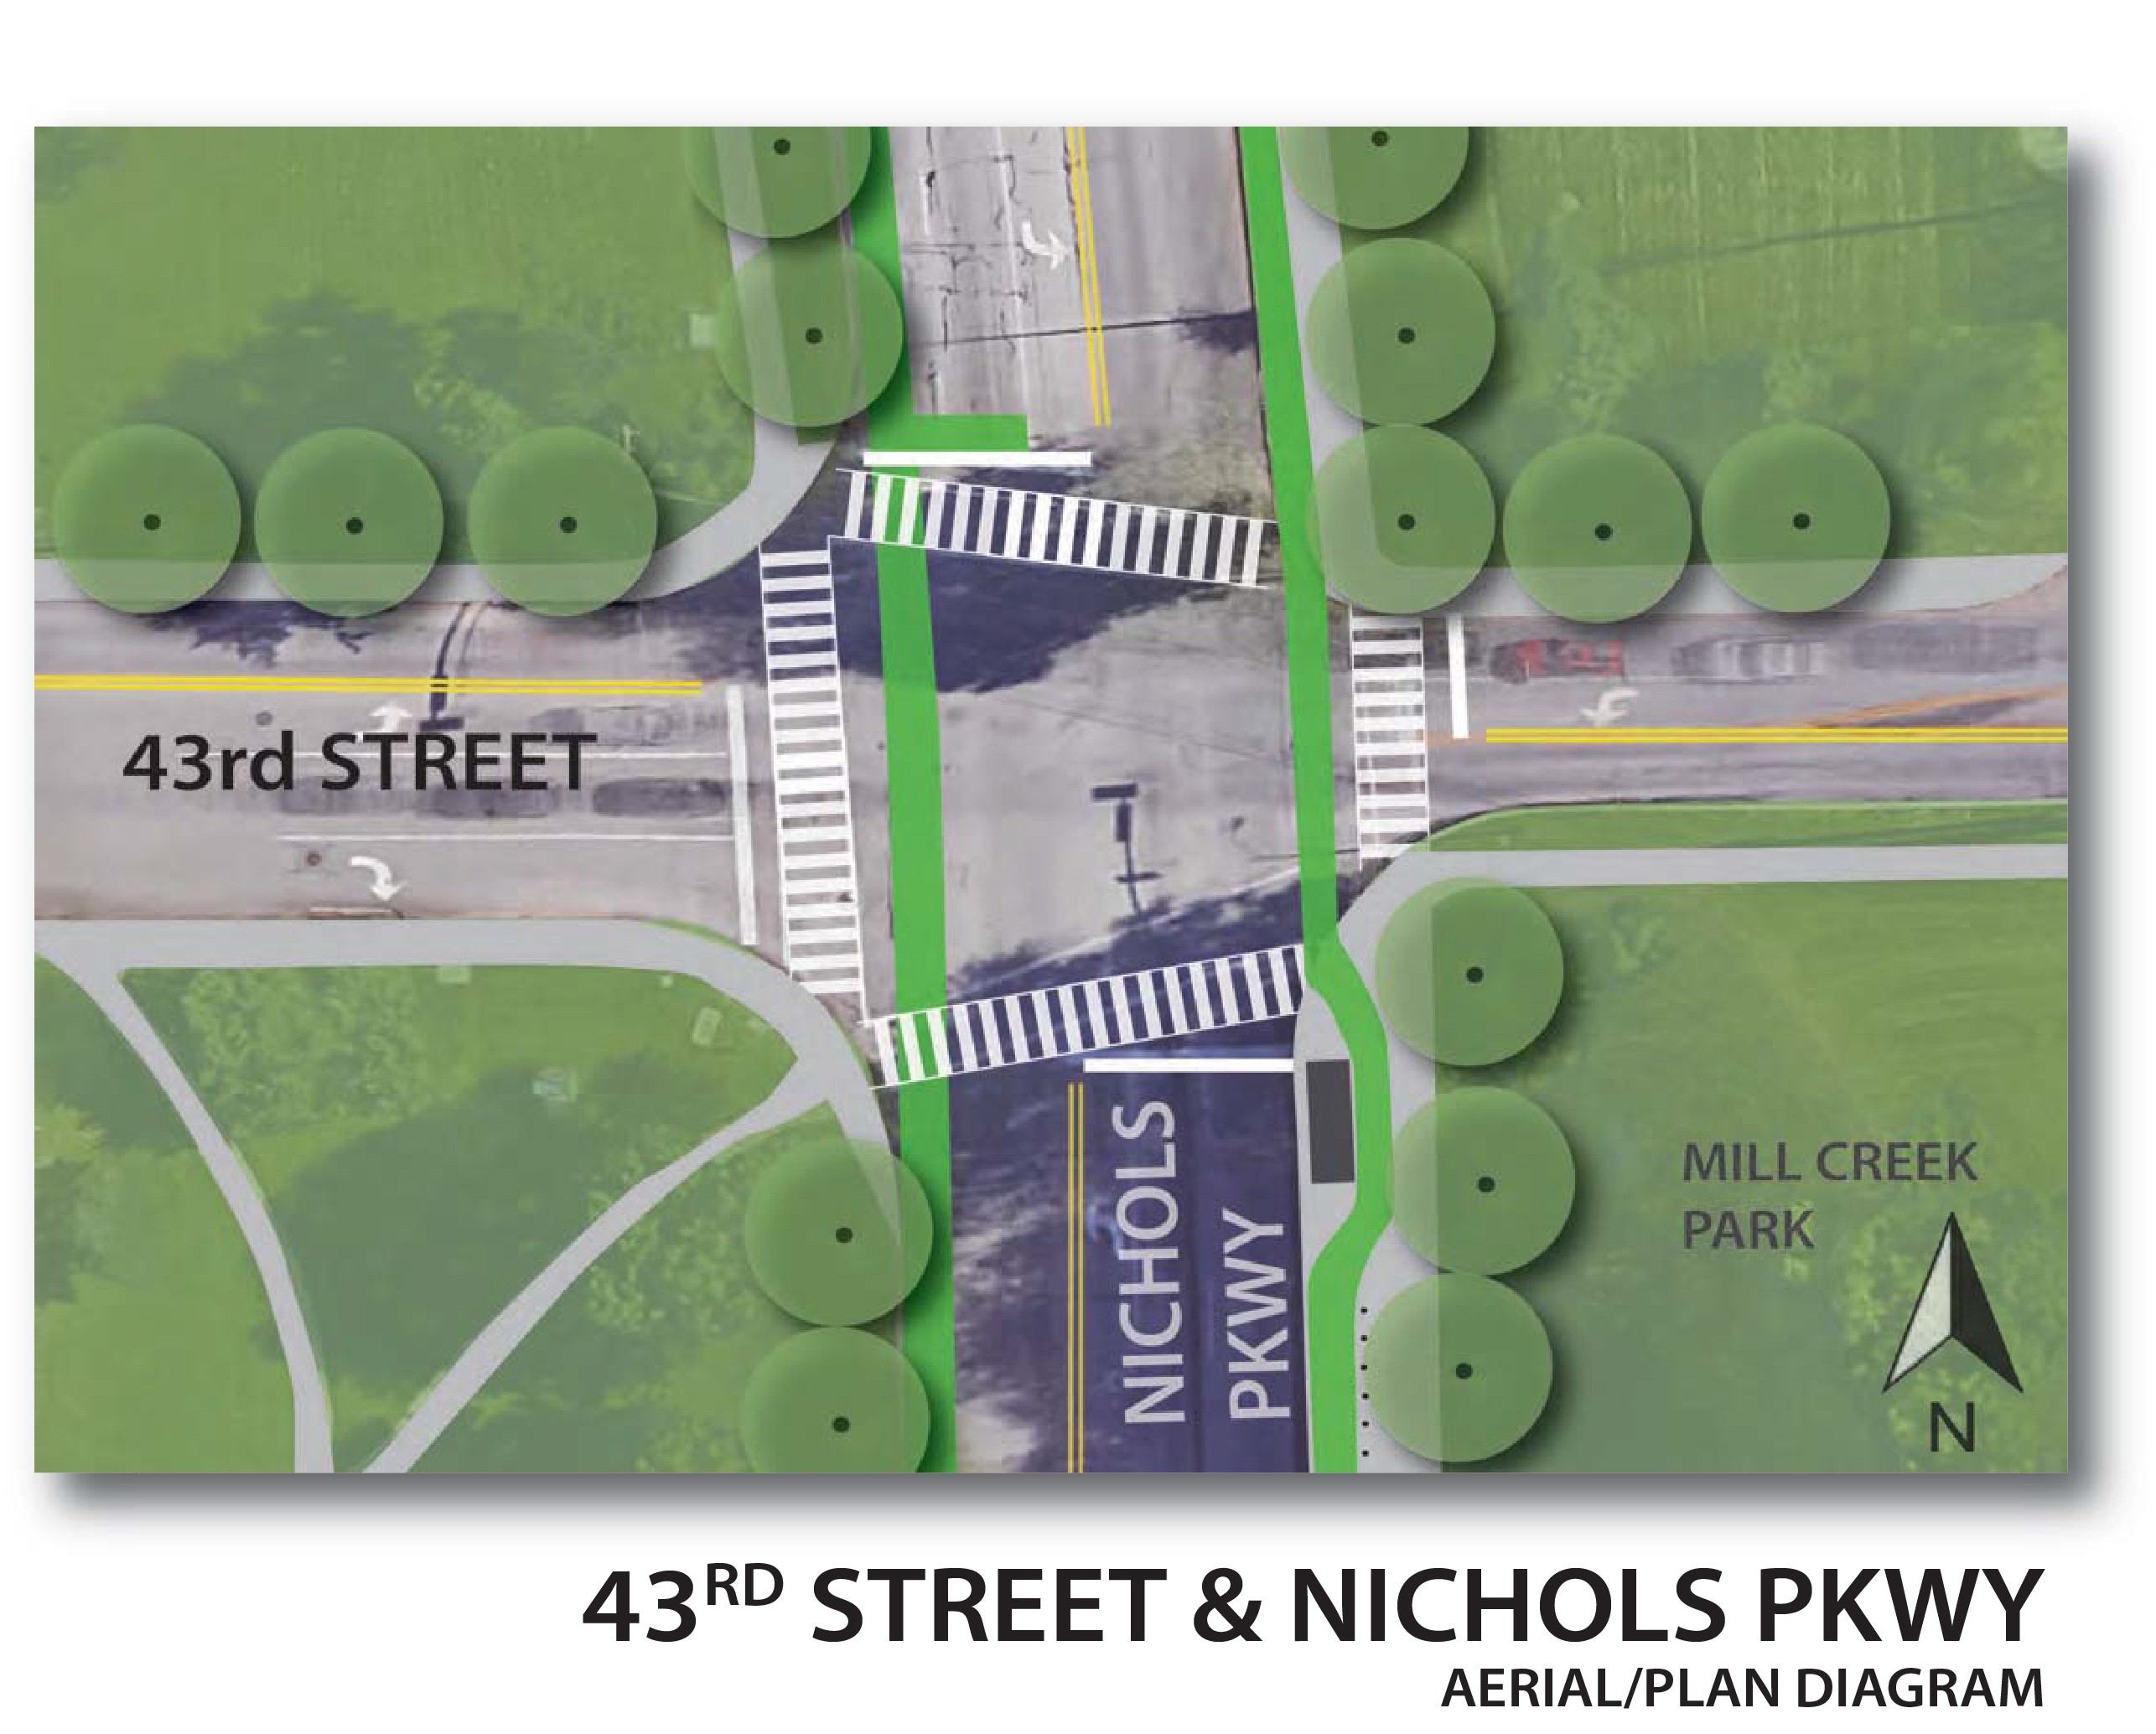
There are several noticeable changes that have happened at the intersection of Mill Creek/Broadway/ JC Nichols and 43rd street. The area in the parks and boulevard system is near the plaza and Westport. Up until the 1990s there was a railway bridge Westport area.
Changes
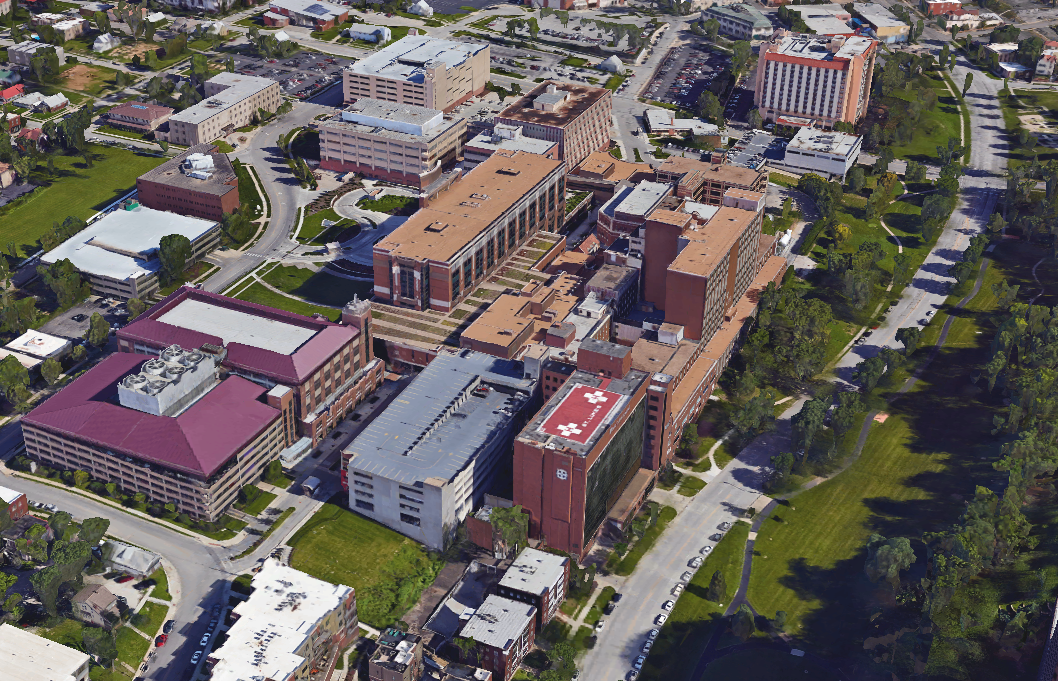
There is a vast change in several things besides the lack of a railroad. The street grid is completely altered. St. Luke’s hospital has changed the transit ways around the intersection and there is an almost completely different building foot print as well.
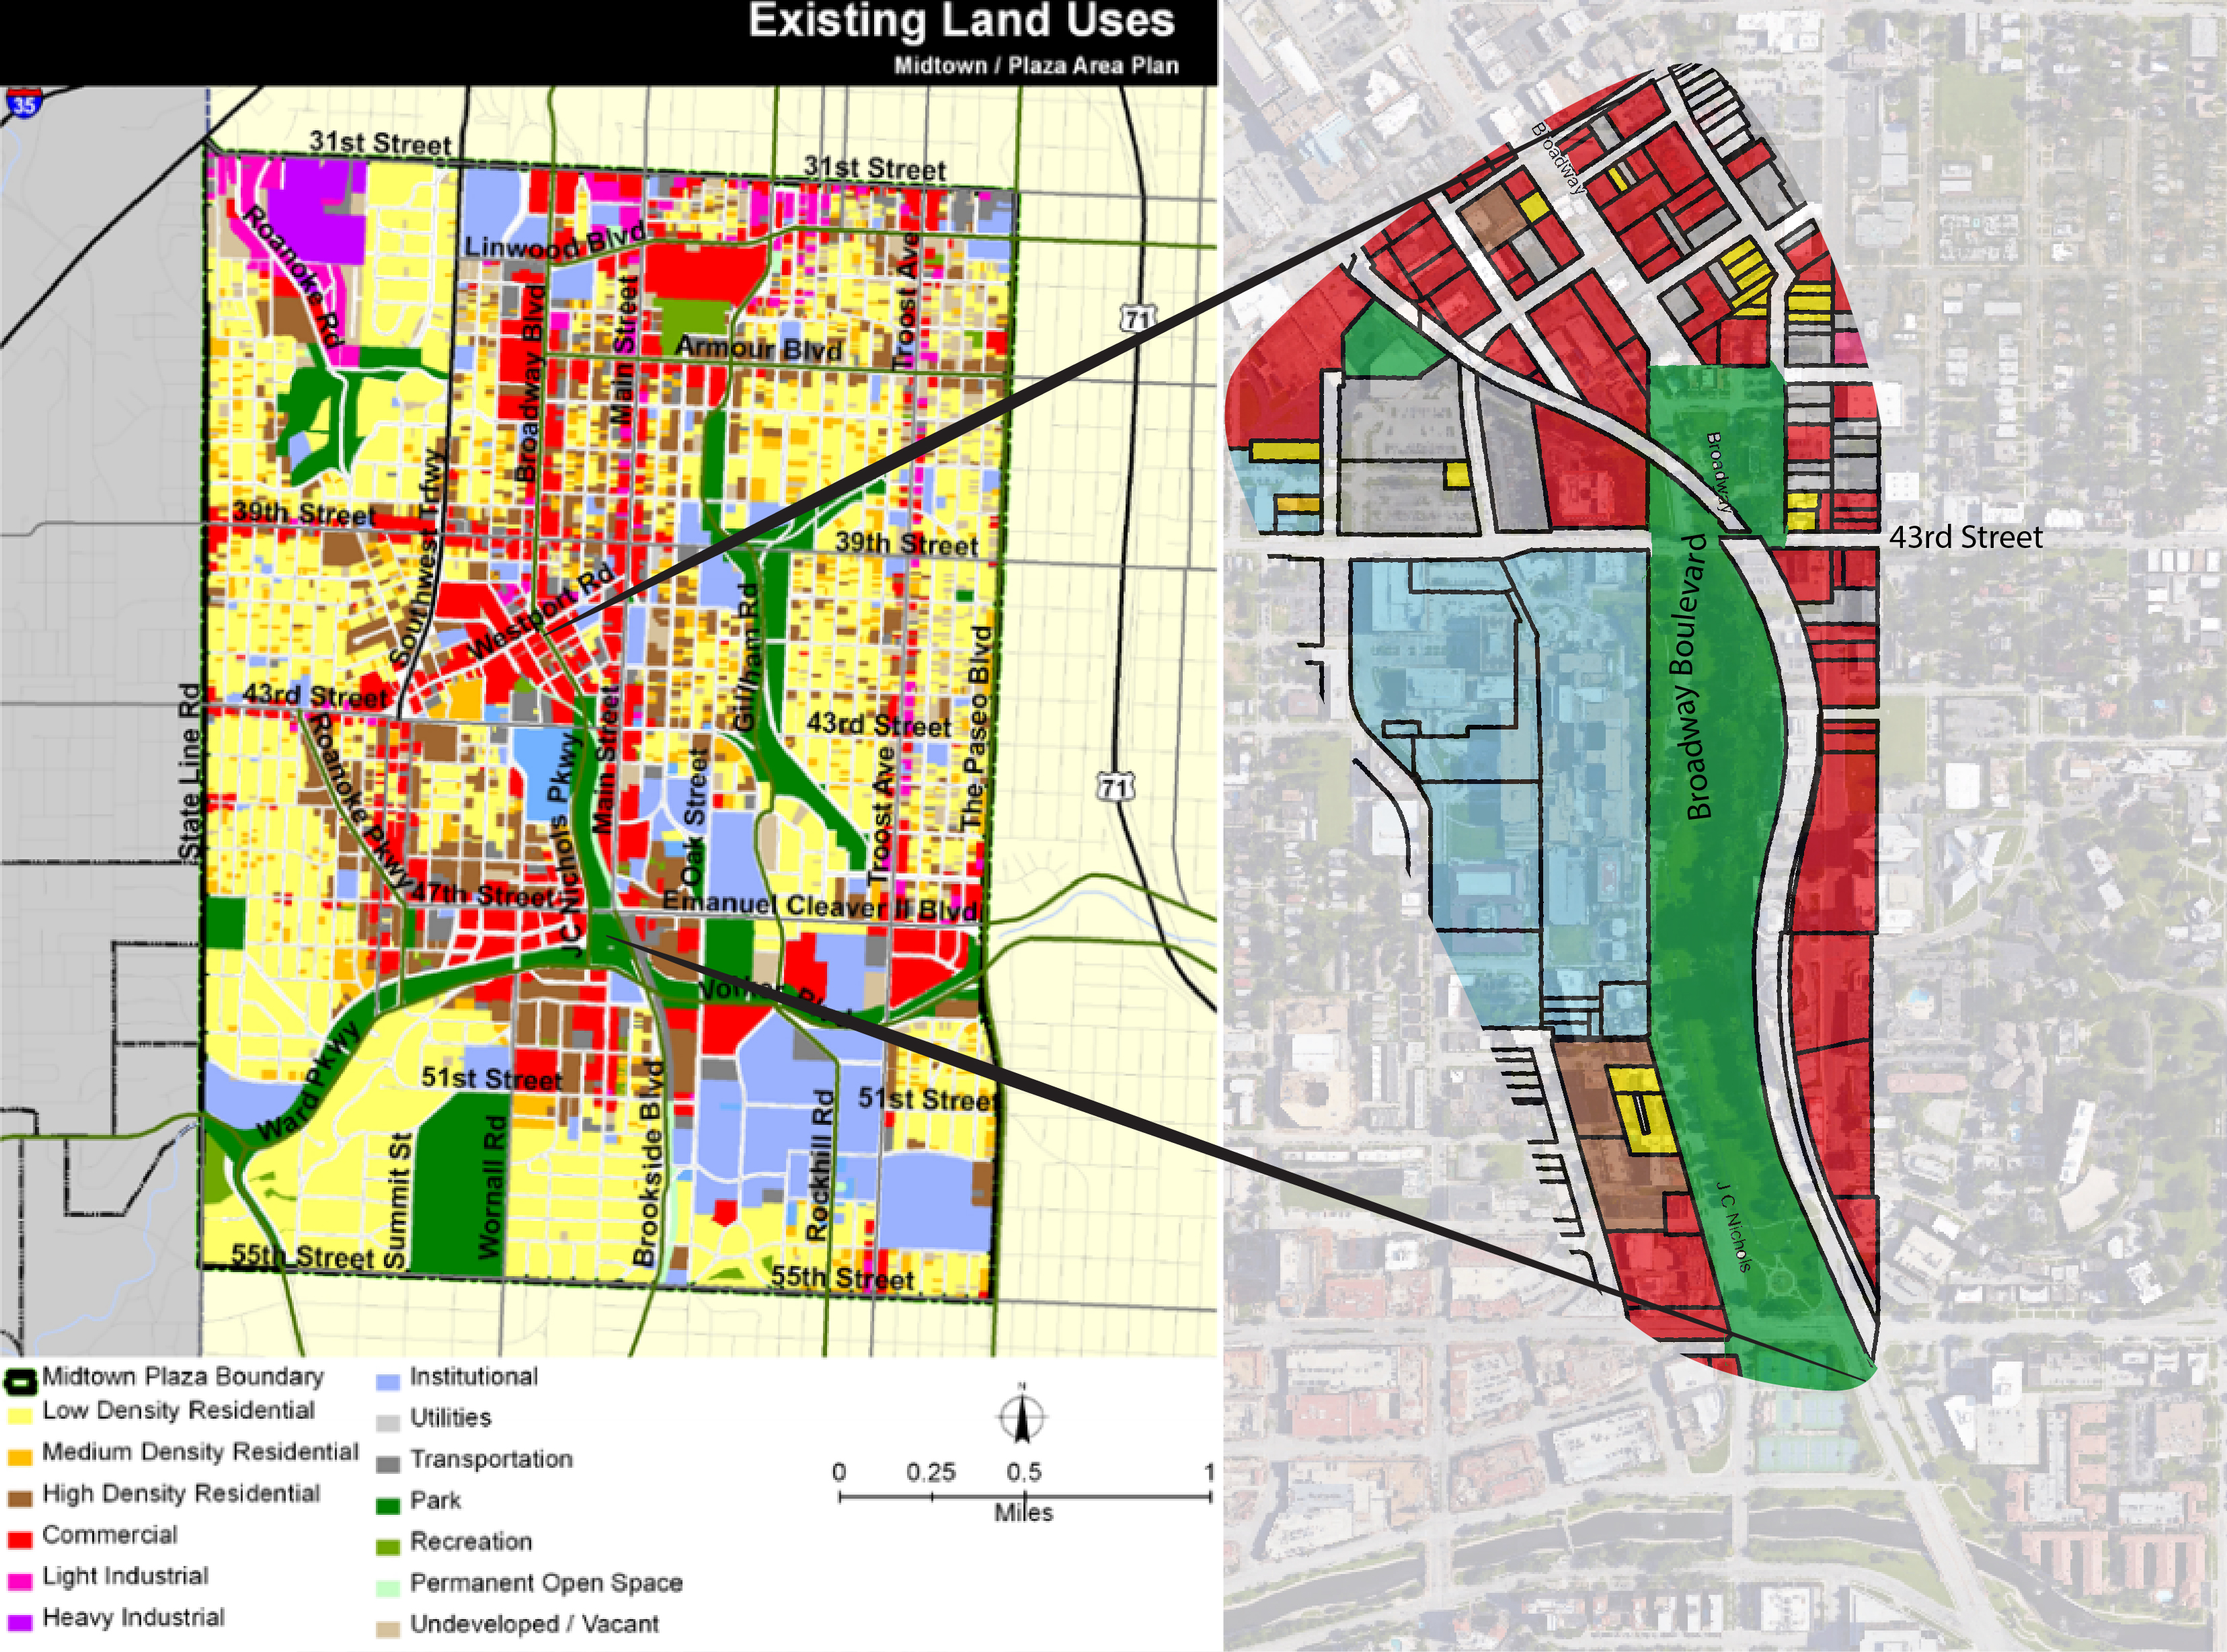
Land Use
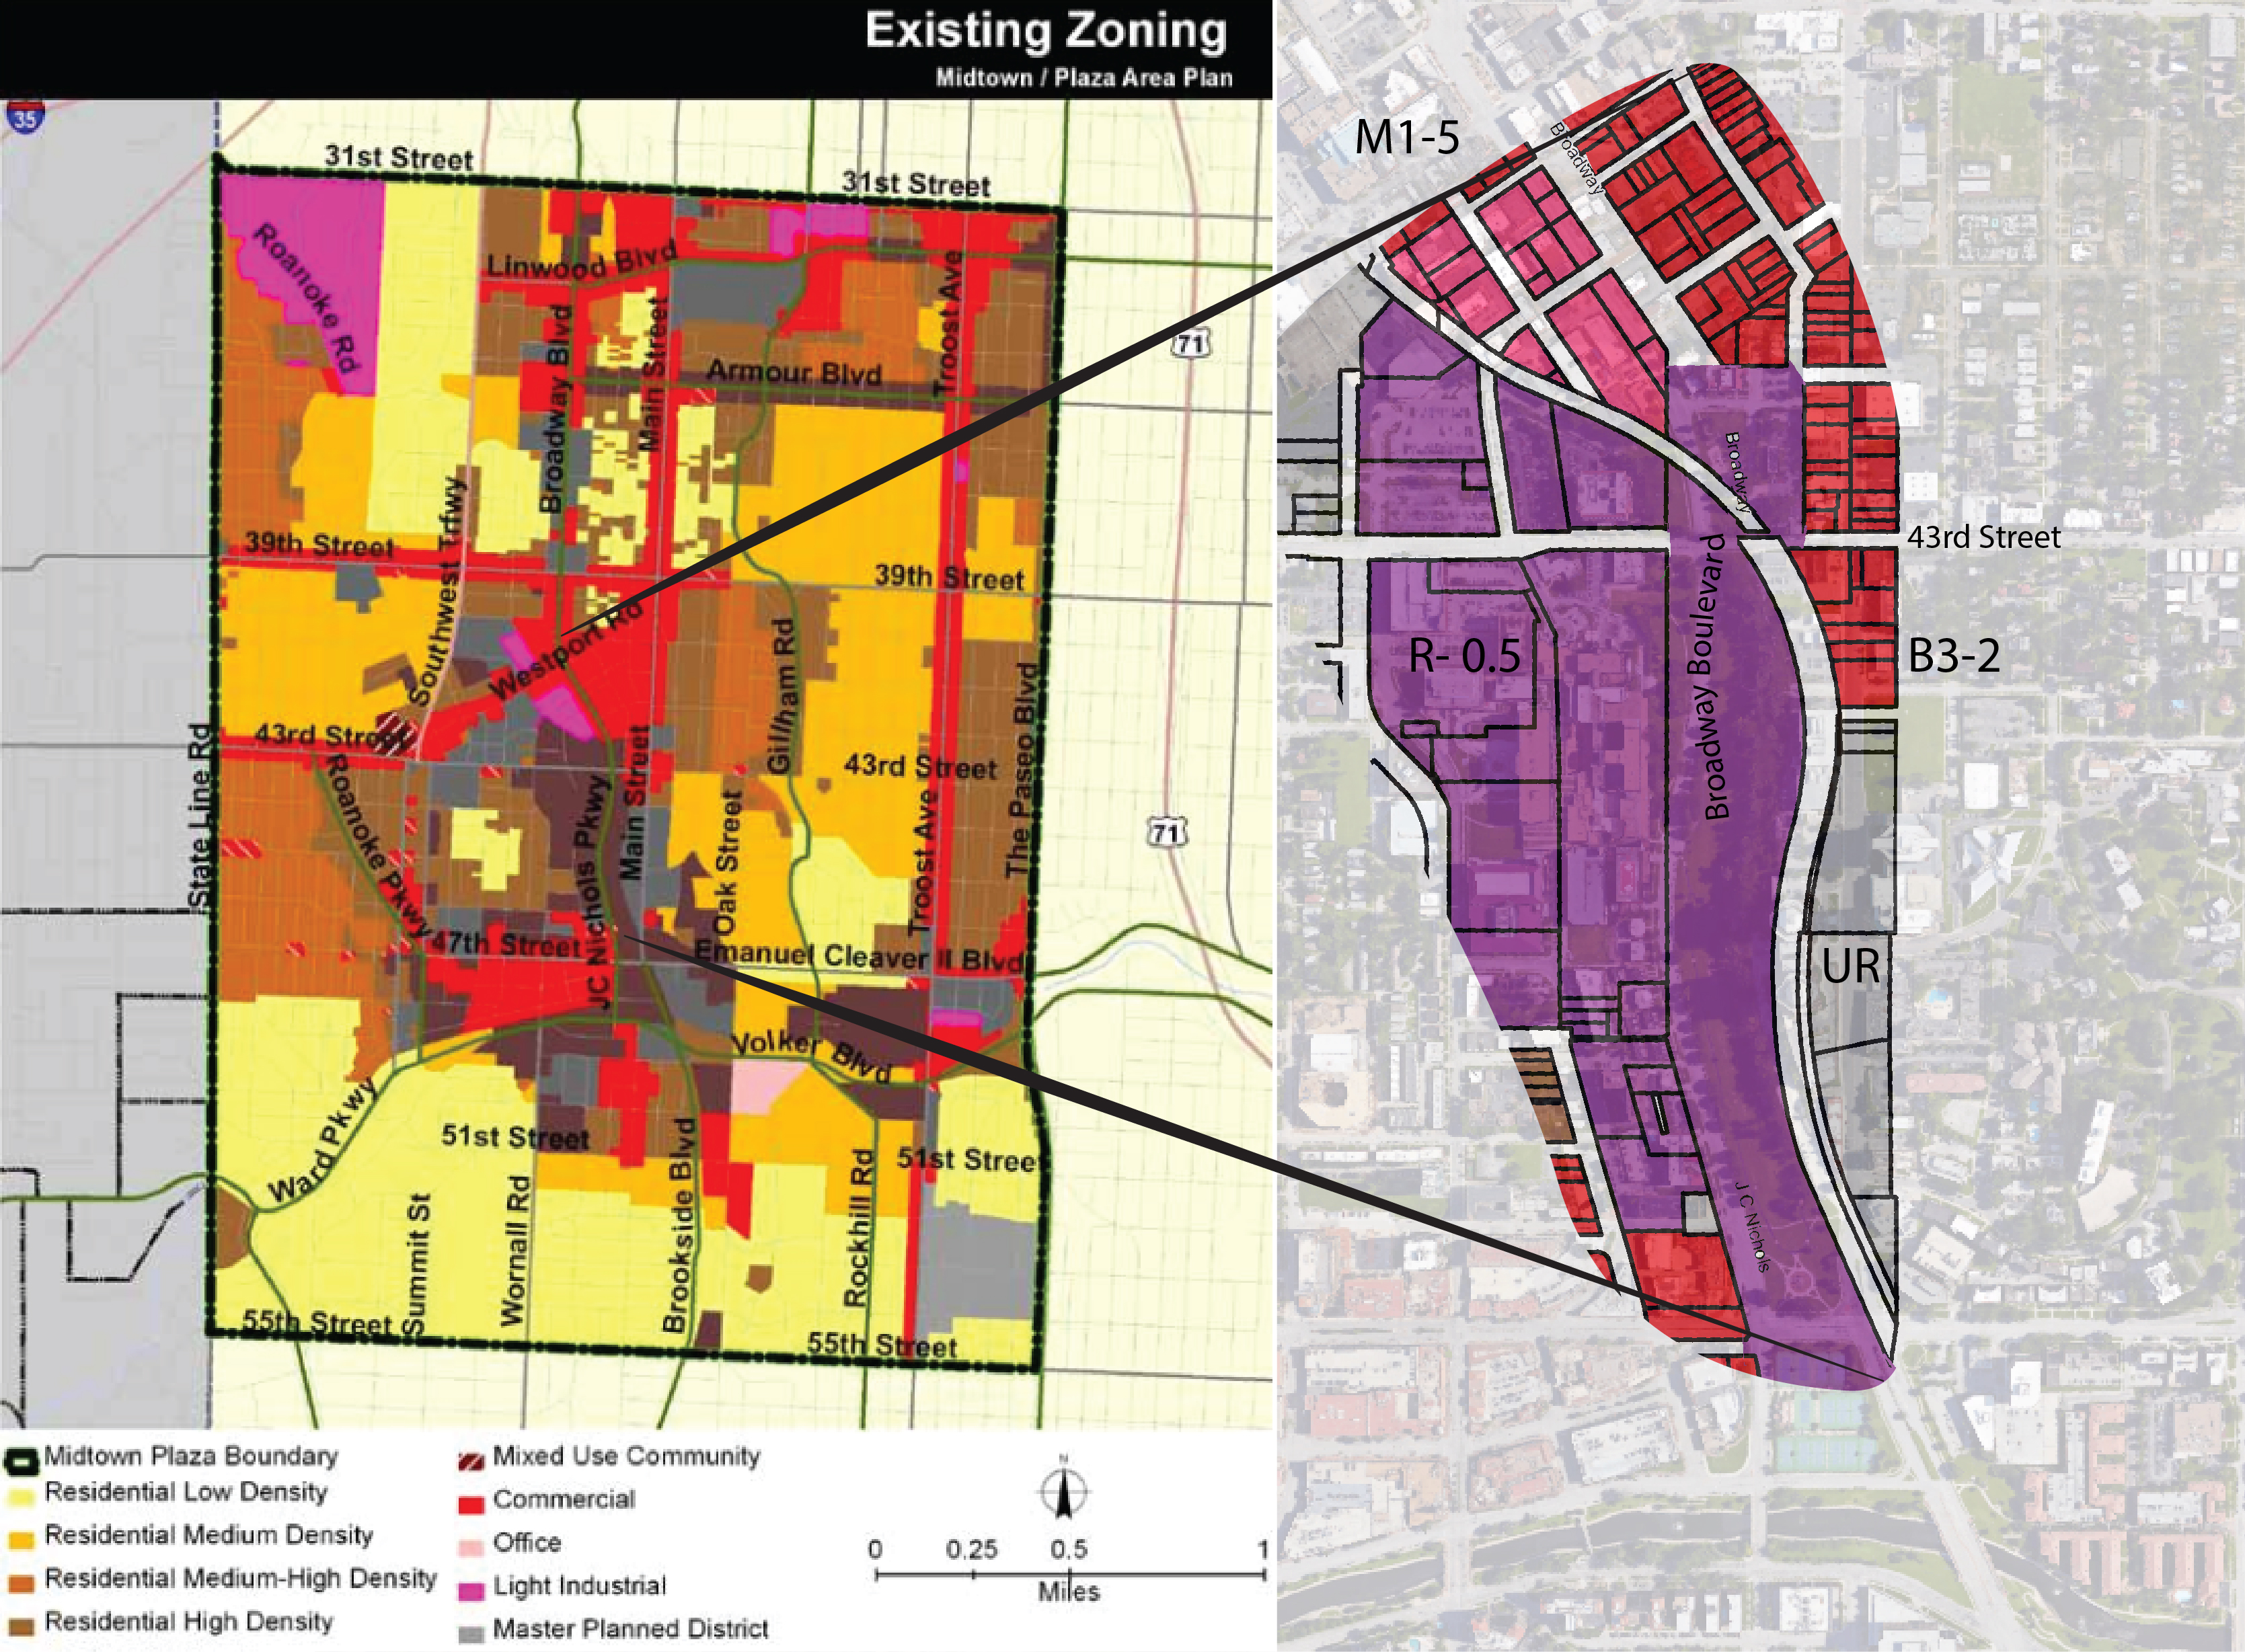
The Midtown and Plaza Area have a very complex mix of land use. There are large areas of residential neighborhoods surrounding a mix of commercial businesses and institutional areas. The “knuckle” of Broadway Blvd/ JC Nichols and 43rd street represents this mix of land use that is characteristic of the general area. St. Luke’s represents a large institution and the location is also where the two commercial sectors of the Plaza and Westport collide. Running through all of this is Mill Creek park — the large green space that serves the many neighborhoods in the surrounding.
Zoning
The area has several zoning uses that are representative of the mix of zoning that is in the overall area. To the west of Broadway there is a large span of Urban Residential zoned land. To the east there is a Urban Redevelopment zoned area that spans along Main Street. To the north east of the intersection there is a commercially zoned area. As Broadway curves to the North West the zoning along the west side of the street is light industrial.
Other Plans and Land Use Conflicts
St. Luke’s Hospital is a large institutional land use that has expanded its size greatly in recent years. The zoning in the area is R-0.5 which is residential urban.There are other conflicting plans that institutions and neighborhoods have created. Southmoreland has developed an area plan and the Nelson has been working to develop a cultural district in the area.
Resources
Data was gathered from several sources including Google Maps, Google Earth, Midtown/ Plaza Area Plan by the planning department of Kansas City MO The Nelson Atkins Museum of Art Cultural District Plan, and The Southmoreland Area Plan
A quick analysis can be a vital tool to have in the planning profession. Last week my studio had the chance practice this type of study on different sections on the Kansas City Parks and Boulevard system. We had three sessions of quick analysis over different topics each time. I am going to talk a bit about one or maybe two.
Now it is pretty well documented that Kansas City, Missouri has lost over half of it’s total population since the early nineteen hundreds. There are many different reasons why that is depending on who you ask, but after analyzing the intersection of Armour and Broadway Boulevard, it became clear that new commercial development was also a leading cause in the population loss.
Along a few block stretch of Broadway, to the north and south of Amour, all of the intersections are offset. (Also referred to as a “knuckle” in our studio). The intersection of Armour and Broadway is a great example of a “knuckle” intersection, which can be found throughout the Parks and Boulevard system. Broadway is the west end-point for Armour, though W 35th street, which is slightly north of Amour does continue further west.
Image 1. 1925 Tuttle-Ayers Atlas of Amour and Broadway Boulevard
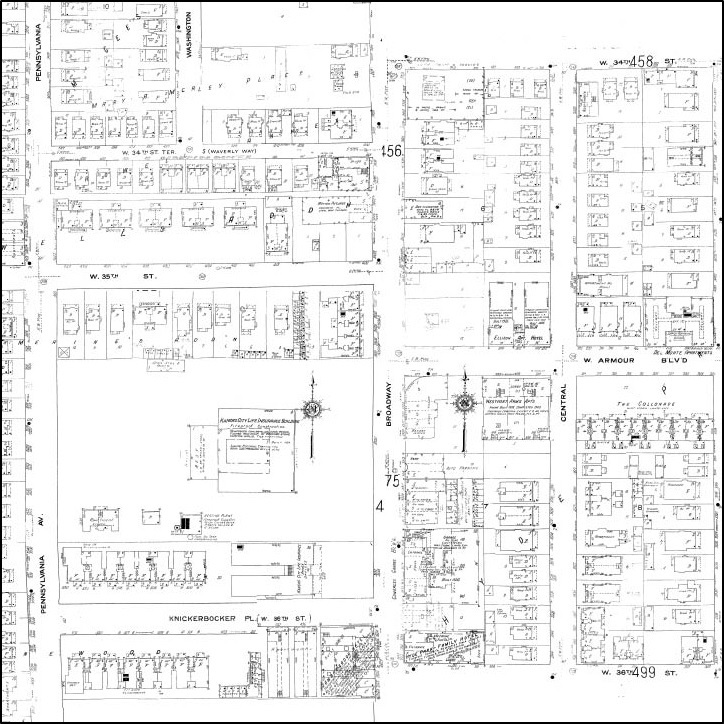
When looking at Figure 1, if you were going west along Armour Blvd toward Broadway, The Kansas City Life Insurance Company building uses the tree lined boulevard to create a terminated view, which is still beautiful today. The real takeaway from the 1925 Atlas maps is the vast amount of single and multifamily housing units surrounding the intersection. Fast forward 25 years to the 1950 Sanborns maps in Image 2 and the housing stock is almost unchanged.
Image 2. 1950 Sanborn Maps of Amour and Broadway Boulevard
Referring back to my statement about new commercial development being a leading cause to the fall in population, all you have to do is look at the 2015 aerial in Image 3. Intire blocks of housing along Broadway have been replaced with commercial buildings and vast amounts of parking lots. Just within the few block radious, there had to of been over a hundred housing units removed. It is without question that the Commercial development along Broadway has considerably weakened the community aspect of the neighborhoods along the corridor, which can have a negative effect on the housing stock.
2015 Aerial of Amour and Broadway Boulevard
Even though Broadway Boulevard is considered a commercial district, the surprising fact is that parking lots were allowed to abut the parcel lines along Broadway Boulevard, even on the most recent development today. Now, I know not every road can be a boulevard, and they do not have to be. Some boulevards are better positioned to support a strong economical commercial district, but shouldn’t the passion to preserve a piece of history such as Broadway take priority over a cheap little shopping center? Hopefully the new Parks and Boulevard development regulations that are to be voted on soon solve these issues. Because the city sure needs them.
Sources
Google Earth. 2015
Tuttle-Ayers 1925 Atlas of Kansas City, Missouri. [map] 1925. Plate 52,53,62,63
Sanborn Map Co. Insurance Maps of Kansas City, Missouri. [map] 1950. Sheet 456,475,476
The first few weeks of class, we had done some basic analysis on Kansas City’s Parks and Boulevards System. Just skimming the surface. (For instance, our first posts here on the blog were about our “first impressions” — nothing too scientific.)
But now, a few weeks in, it was time for the “Elements” project, assigned every spring semester to juniors like us. And that meant it was time for some serious research on the Parks and Boulevards system.
Here, “elements” refers to urban design elements — parts of the city, basically. As we are dealing with parks, parkways, and boulevards this semester, those elements were things you would find specifically in a park — these various elements were organized into seven categories, one for each student to research and eventually present about. Those categories were Street Furniture, Signage, Structures, Views, Lighting, Bicycle, and Pedestrian.
I was assigned that last group: pedestrian elements.
It was basically up to us to research these elements in the Parks and Boulevards system and then to generalize them. The final product was to be, at minimum, a pair of boards describing our findings.
We gave ourselves a bunch of reading on standards for our element. (What kinds of “pedestrian elements” are in parks? Are they for walkers, runners? How wide should they be?) We fired up our GIS software and Adobe Illustrator and began to work. We went out around the city to get new photos of examples of our elements
Below is a review of my “Elements” project.
Precedents and Typology (ie., examples & types)
The first of the two boards we were expected to create dealt with “precedents” — examples — of our element. Here, we were supposed to define categories or types as much as possible.
I started putting together representative examples from around the Parks and Boulevards System. As I did this, I noticed some of the examples worked as pairs. I organized them by most to least common type.
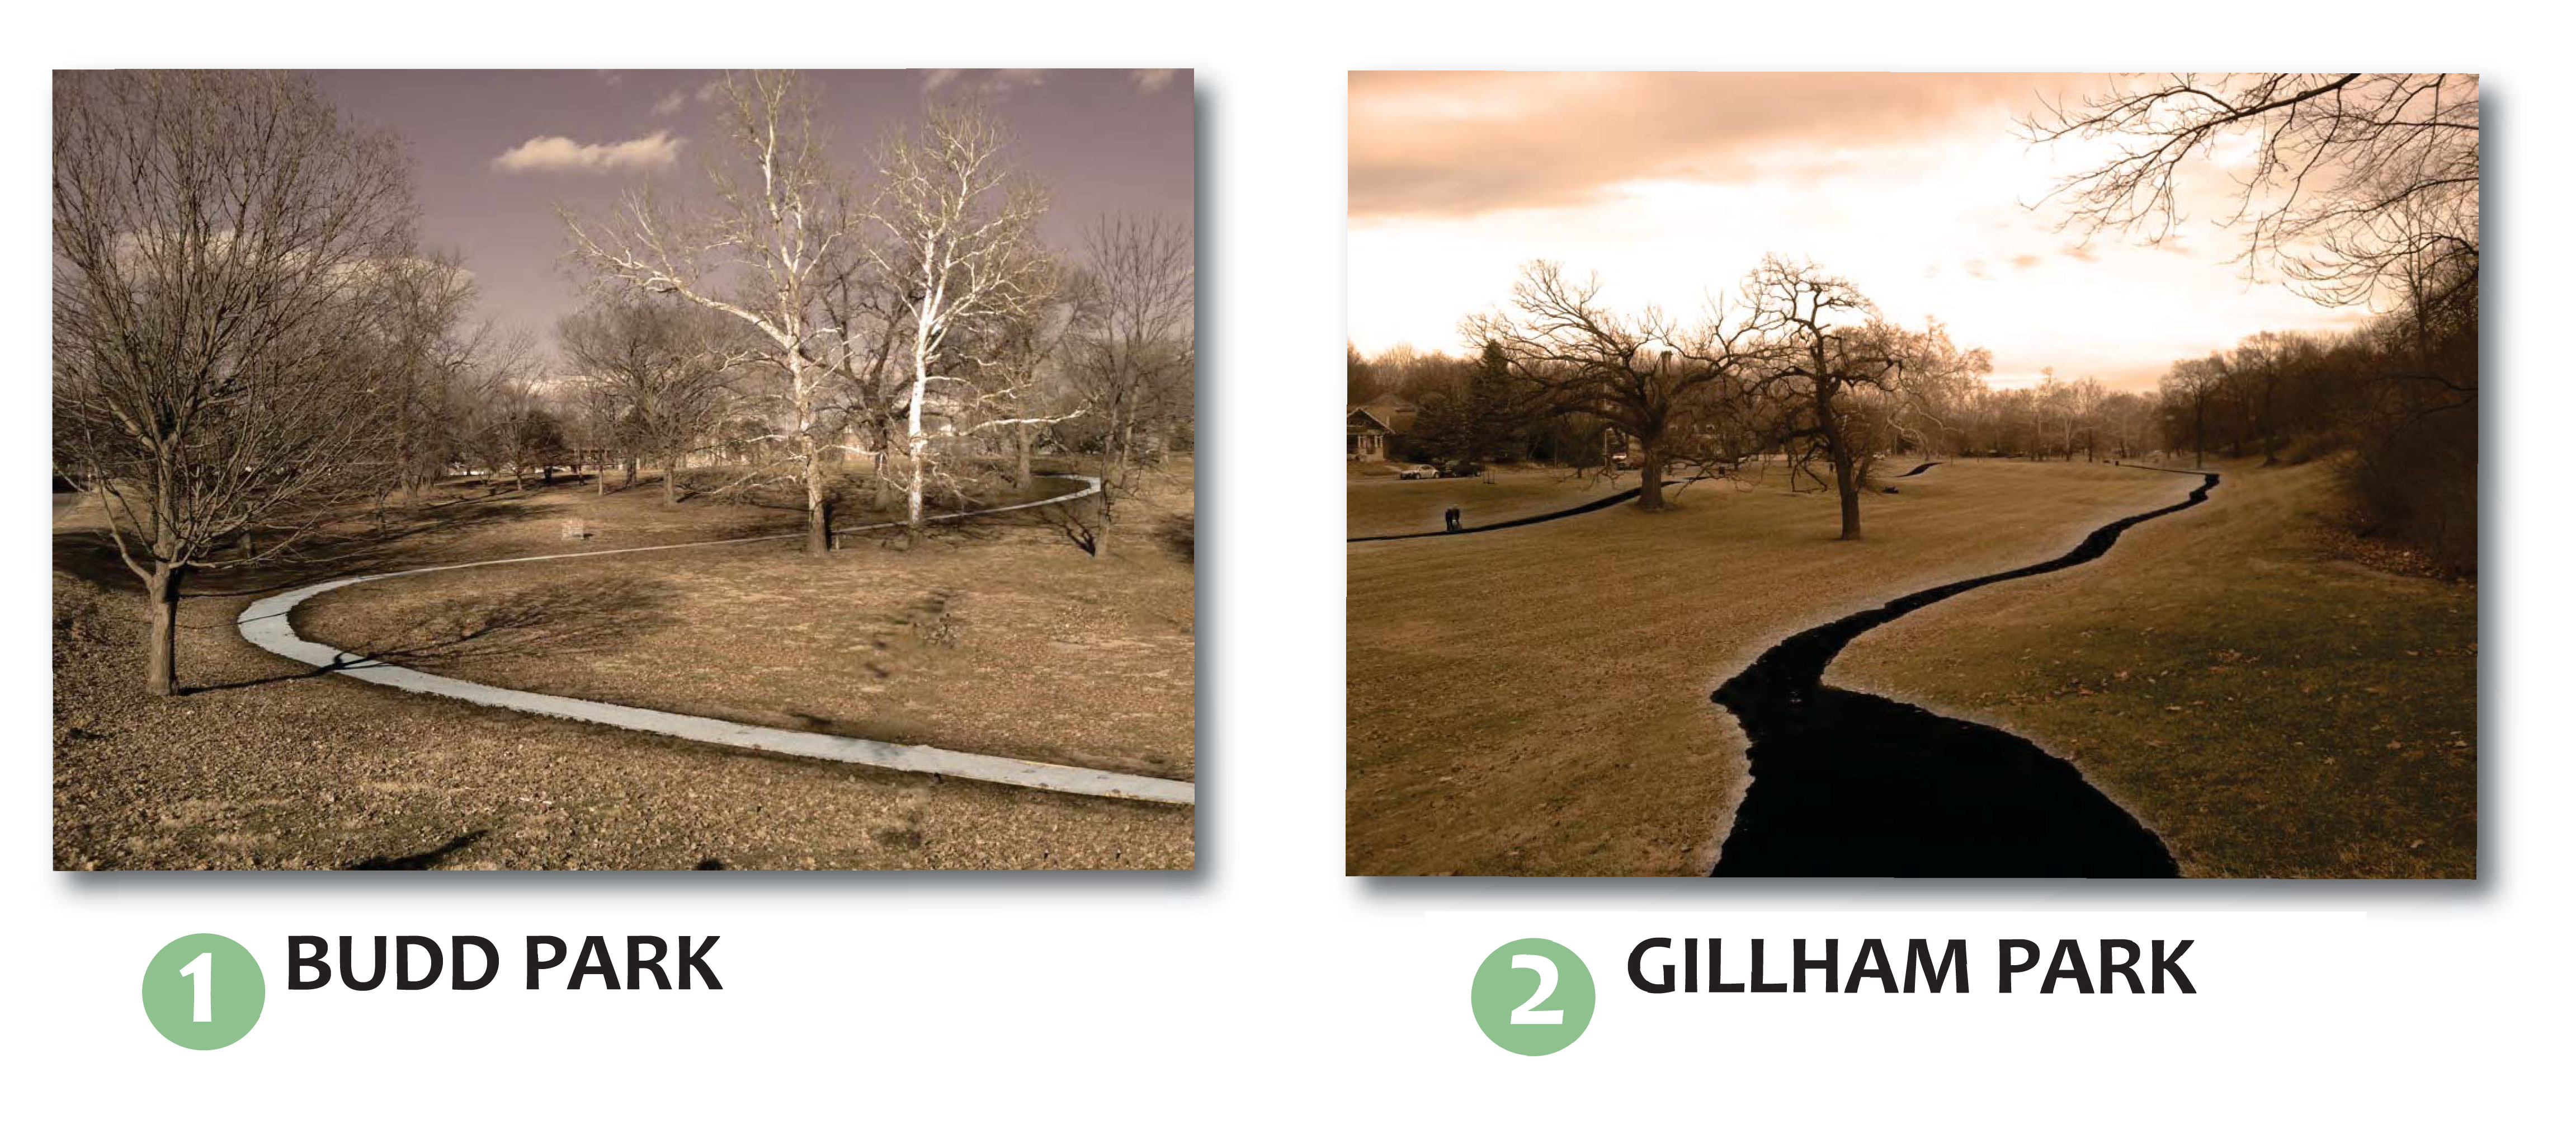
Park Exercise Path
This is probably the most common type of pedestrian path in the Parks and Boulevards system. It’s a path, designed for walkers and joggers, through a park. It usually meanders, like in these examples from Budd Park in Kansas City’s Old Northeast and Gillham Park in Midtown.
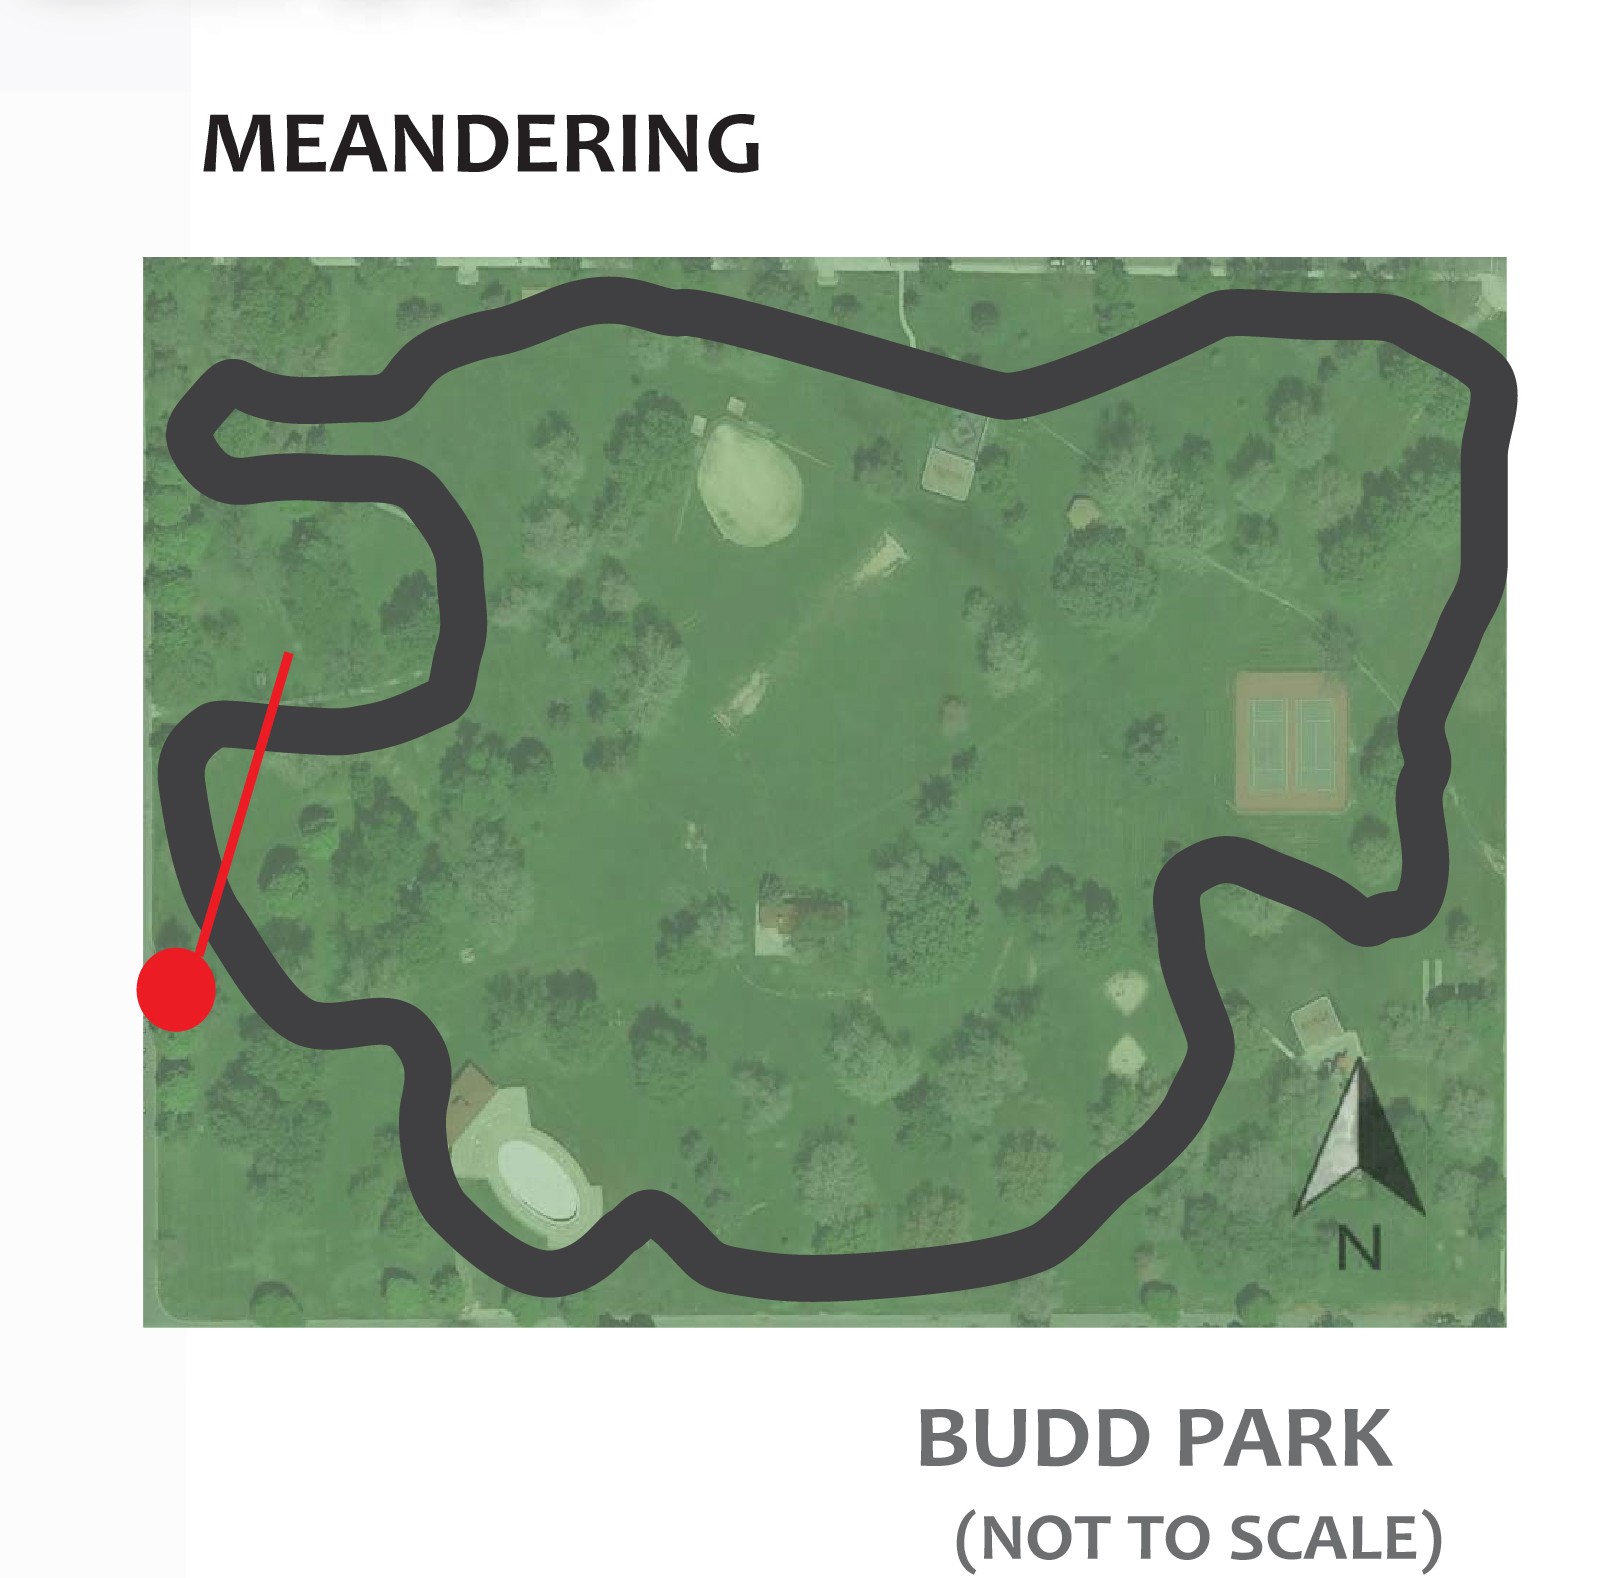
Below is a diagrammatic illustration of what I mean by “meandering” — I’ll contrast it with another type of path layout a little later. (The red in the diagram is the location and direction of the photo from Budd Park above.)
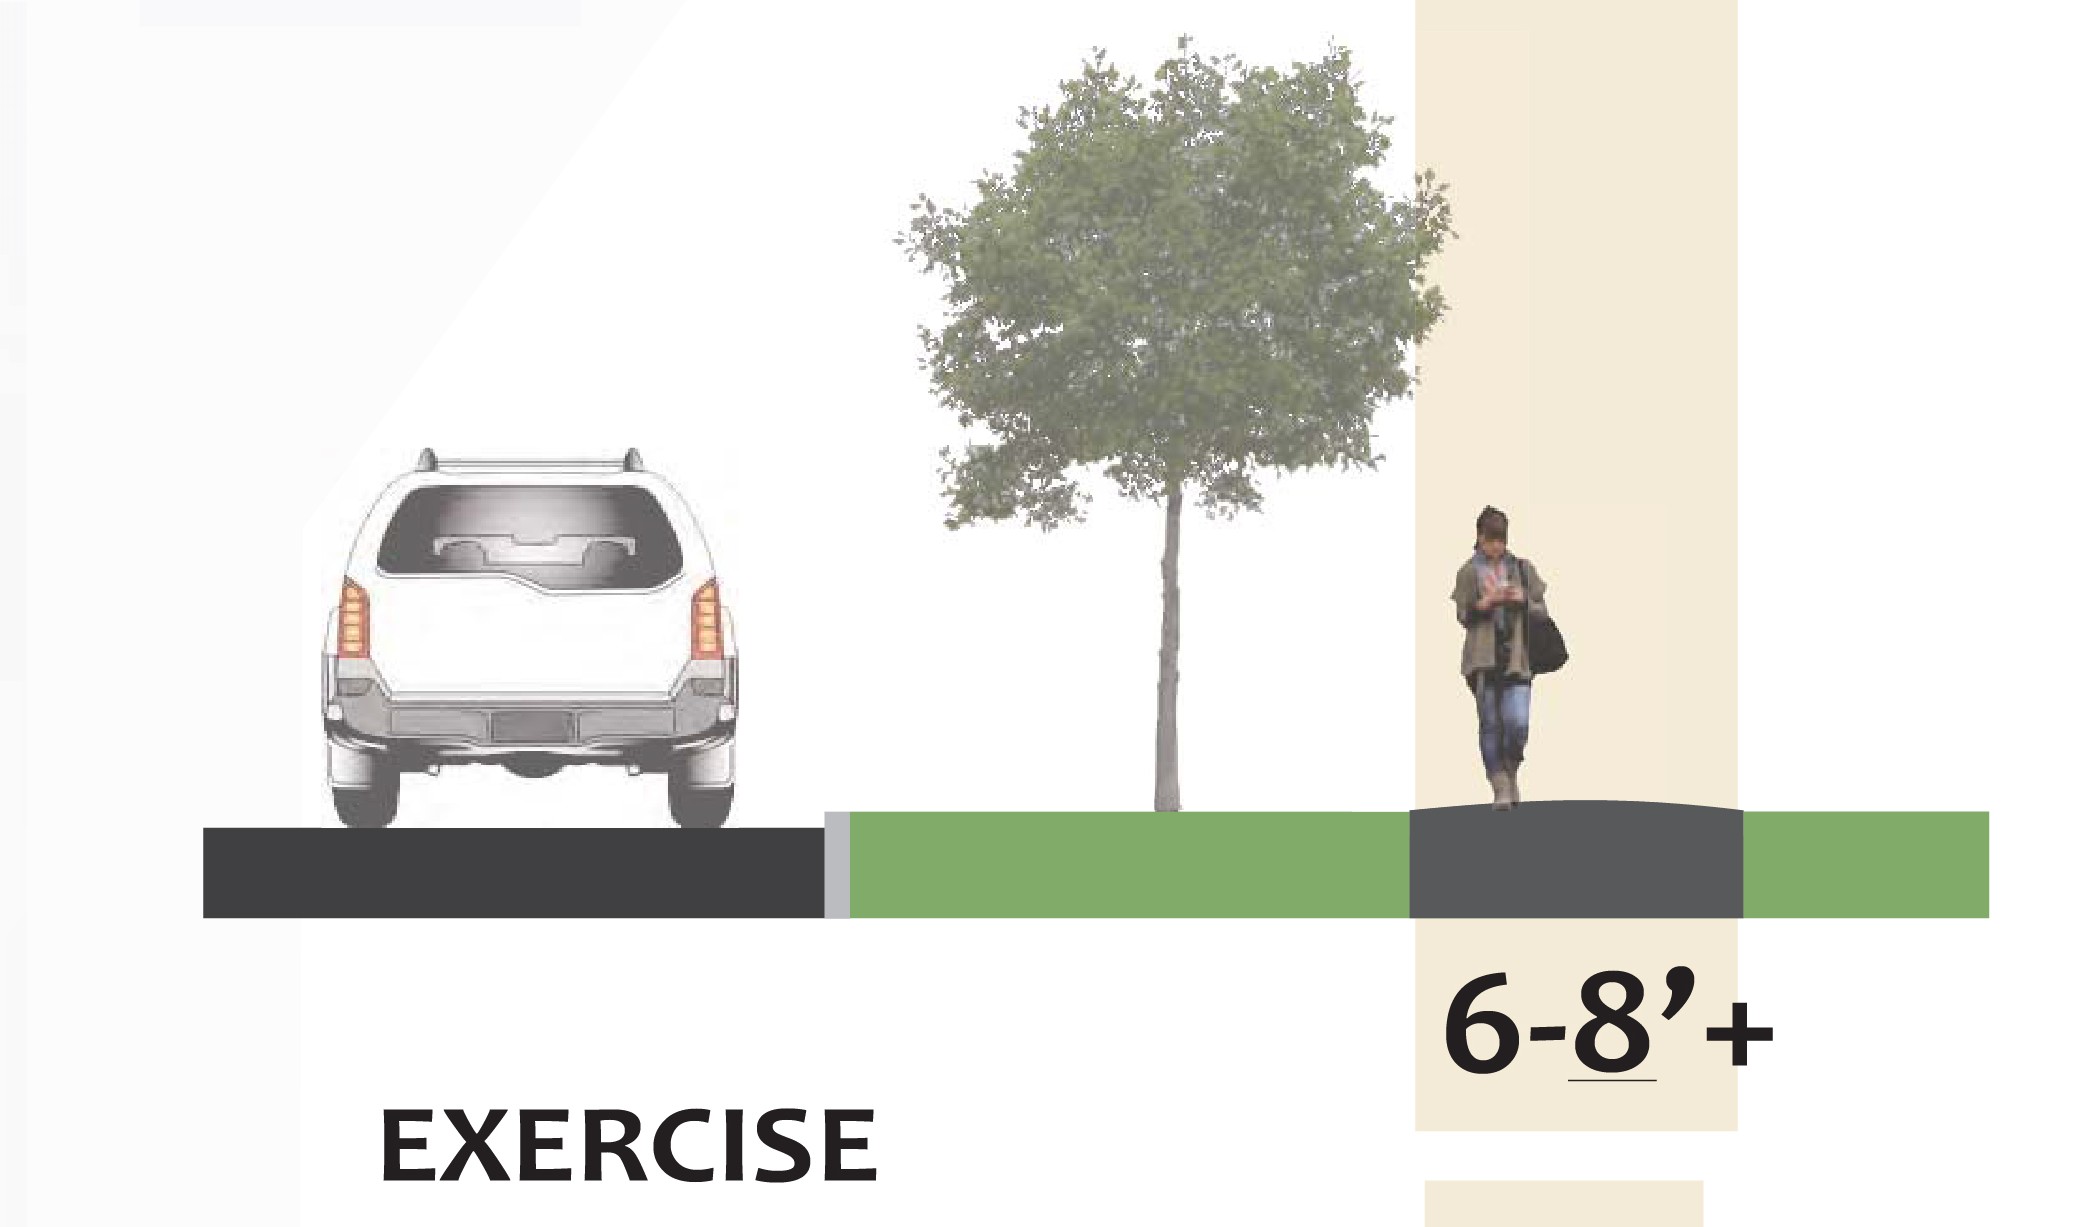
Exercise paths are also generally eight feet wide, but have at least six feet in width.
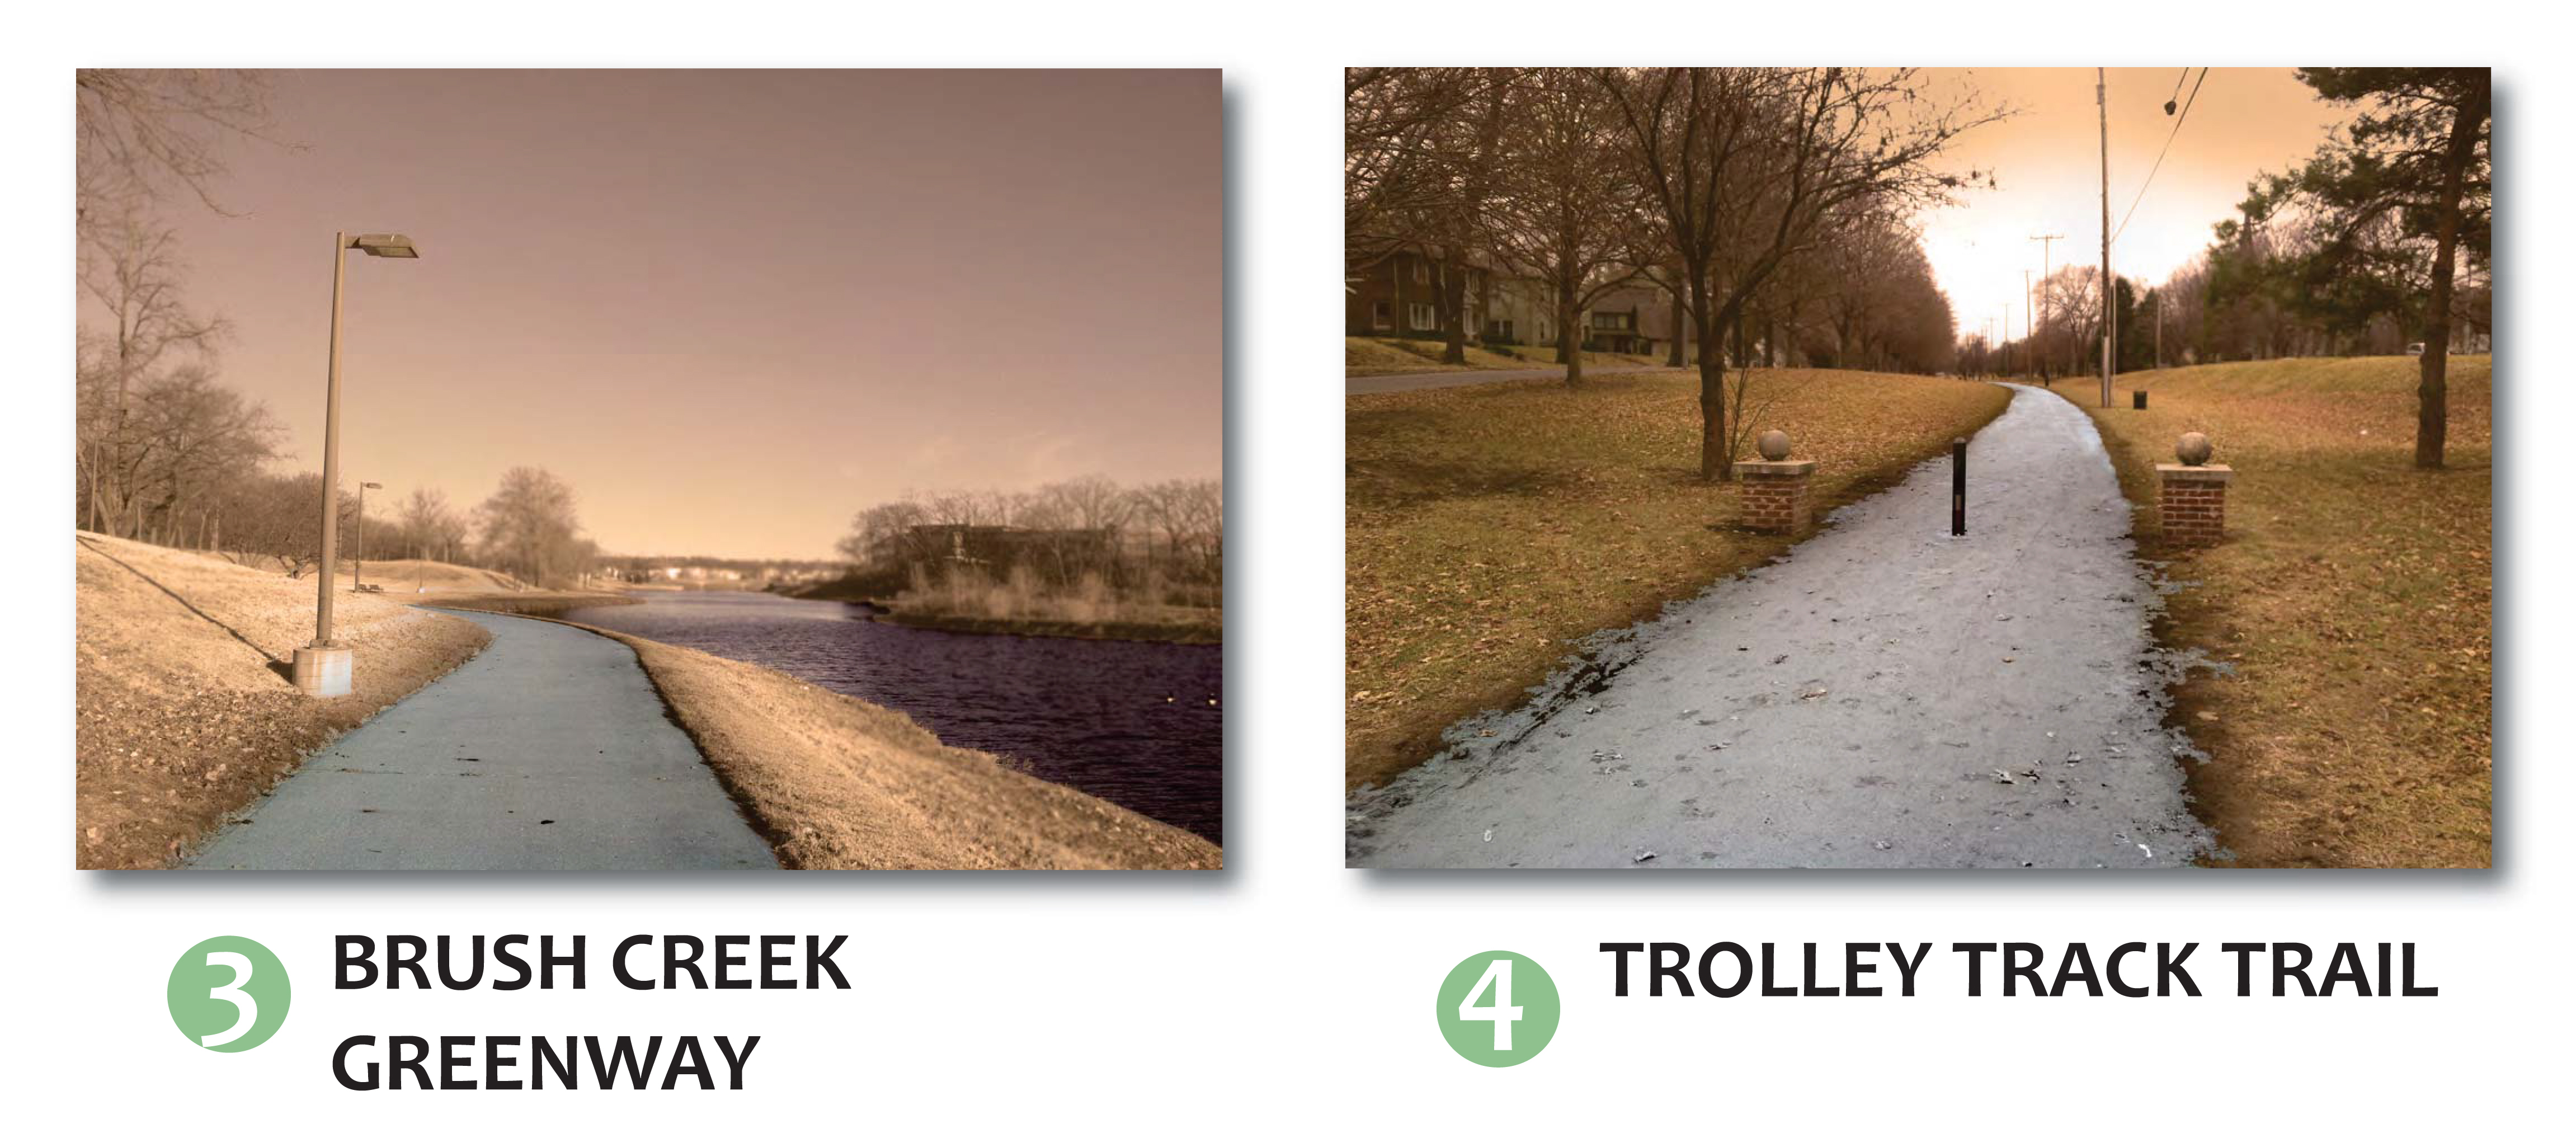
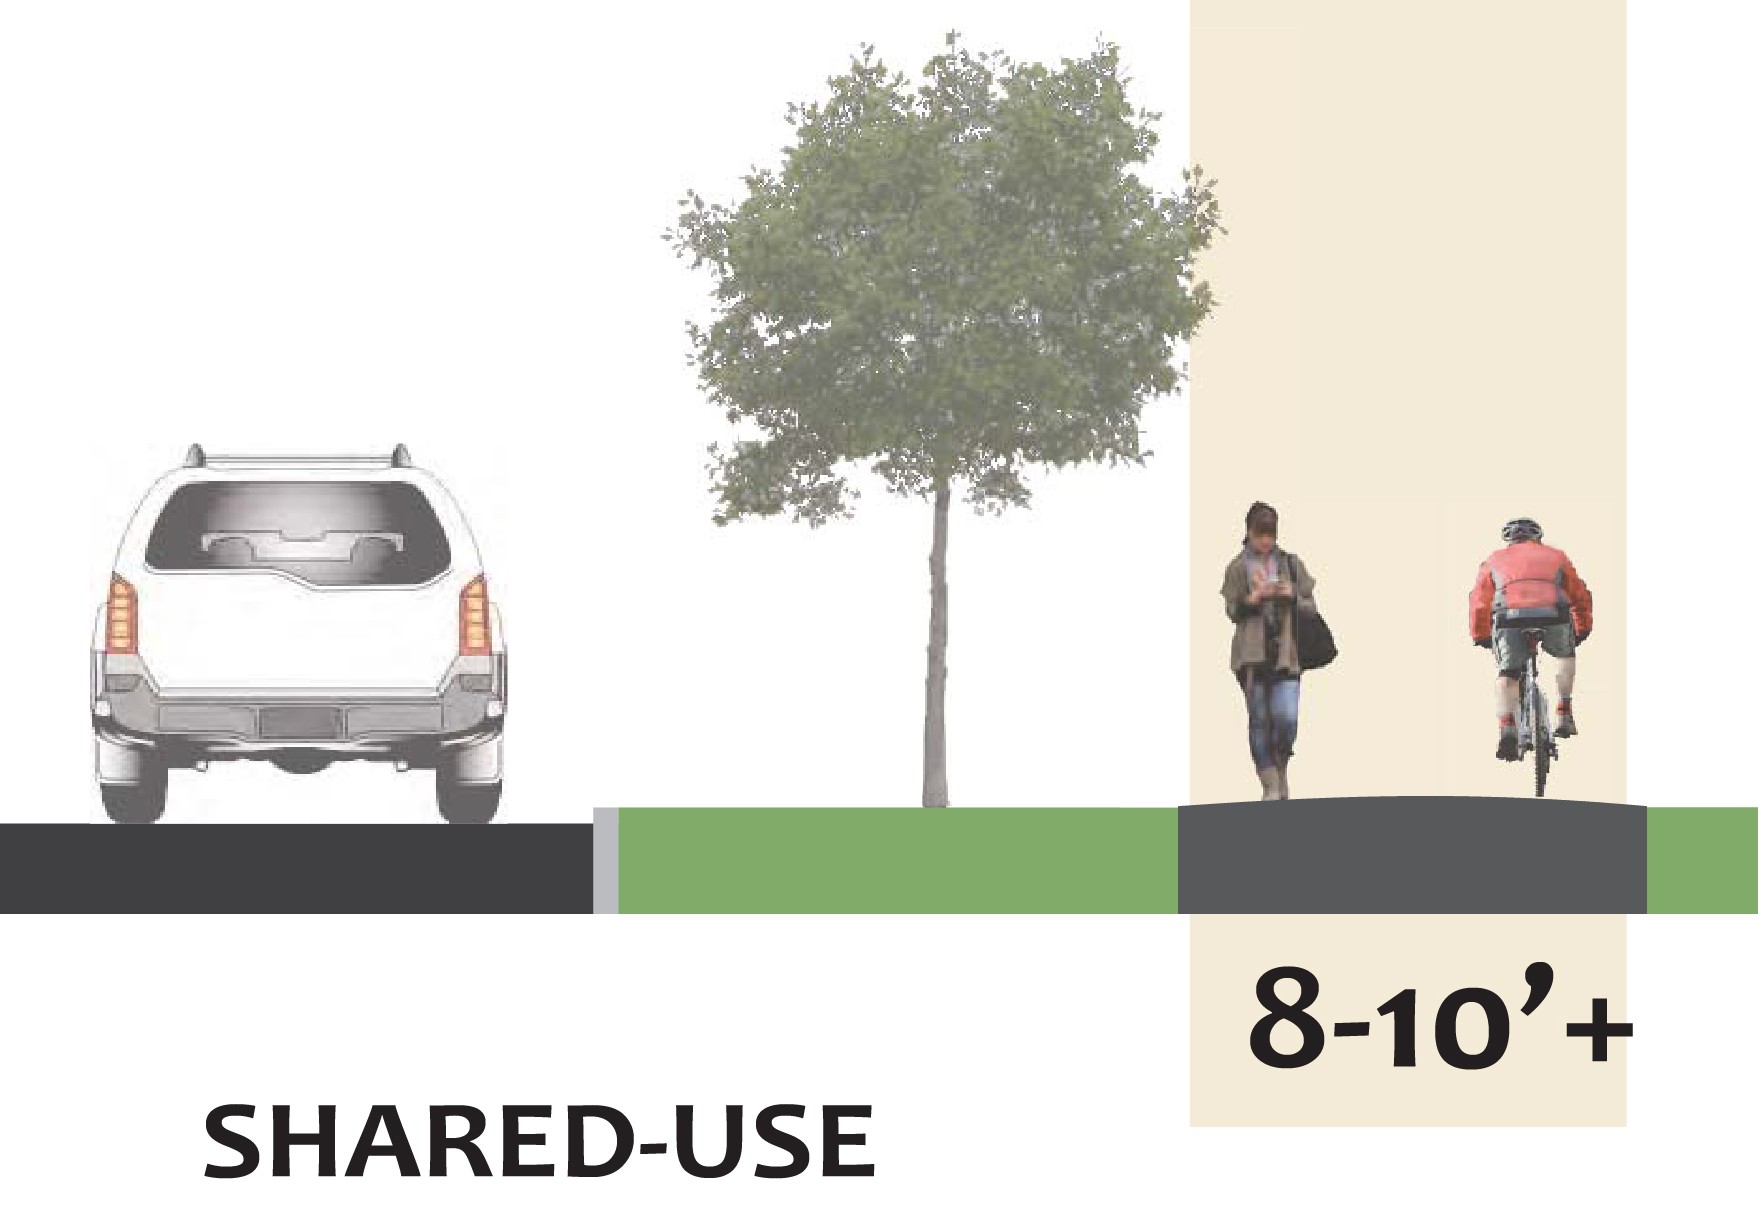
Shared Use Trail
Probably second most common are “shared use trails.” These are wider that exercise paths, meant for not just people on foot but also cyclists, roller bladers, etc. They’re also generally not found within parks — they have their own right-of-way (piece of land), often running along a stream, as in the example of the Brush Creek Greenway Trail below. The Trolley Track Trail is a precedent well known to Kansas Citians — it, technically, is not part of the Parks and Boulevards system, but is a prominent illustration of a “shared-use trail” type.
These — like exercise paths — meander, but are generally at least two feet wider than exercise paths, as illustrated below
Formal Path
In terms of paths specifically designed to accommodate exercise, the previous types are about it. There’s more to recreation, though — beyond keeping fit, recreation can also entail relaxation. That’s what the next type of pedestrian element — the formal path — seems to be built for. Often found around monuments, these paths create an attractive channel or backdrop for just a simple walk — often with some type of structural element, as in the examples from the Gladstone Concourse and Paseo Pergola (typo on the photo) below.
These paths are generally very wide — “processional” might be a good word — and often lead to/from a specific destination, often, something monumental, like mentioned above.
While not specifically designed for it, these paths do not preclude running/jogging. Other activities like cycling and roller blading would be a little dangerous here: there are often steps.
Their layout is, unsurprisingly, more formal and organized than exercise paths or shared-use trails.
Other Types of Path
What both parts of this last pair have in common is that they are, well, less common, so to speak.
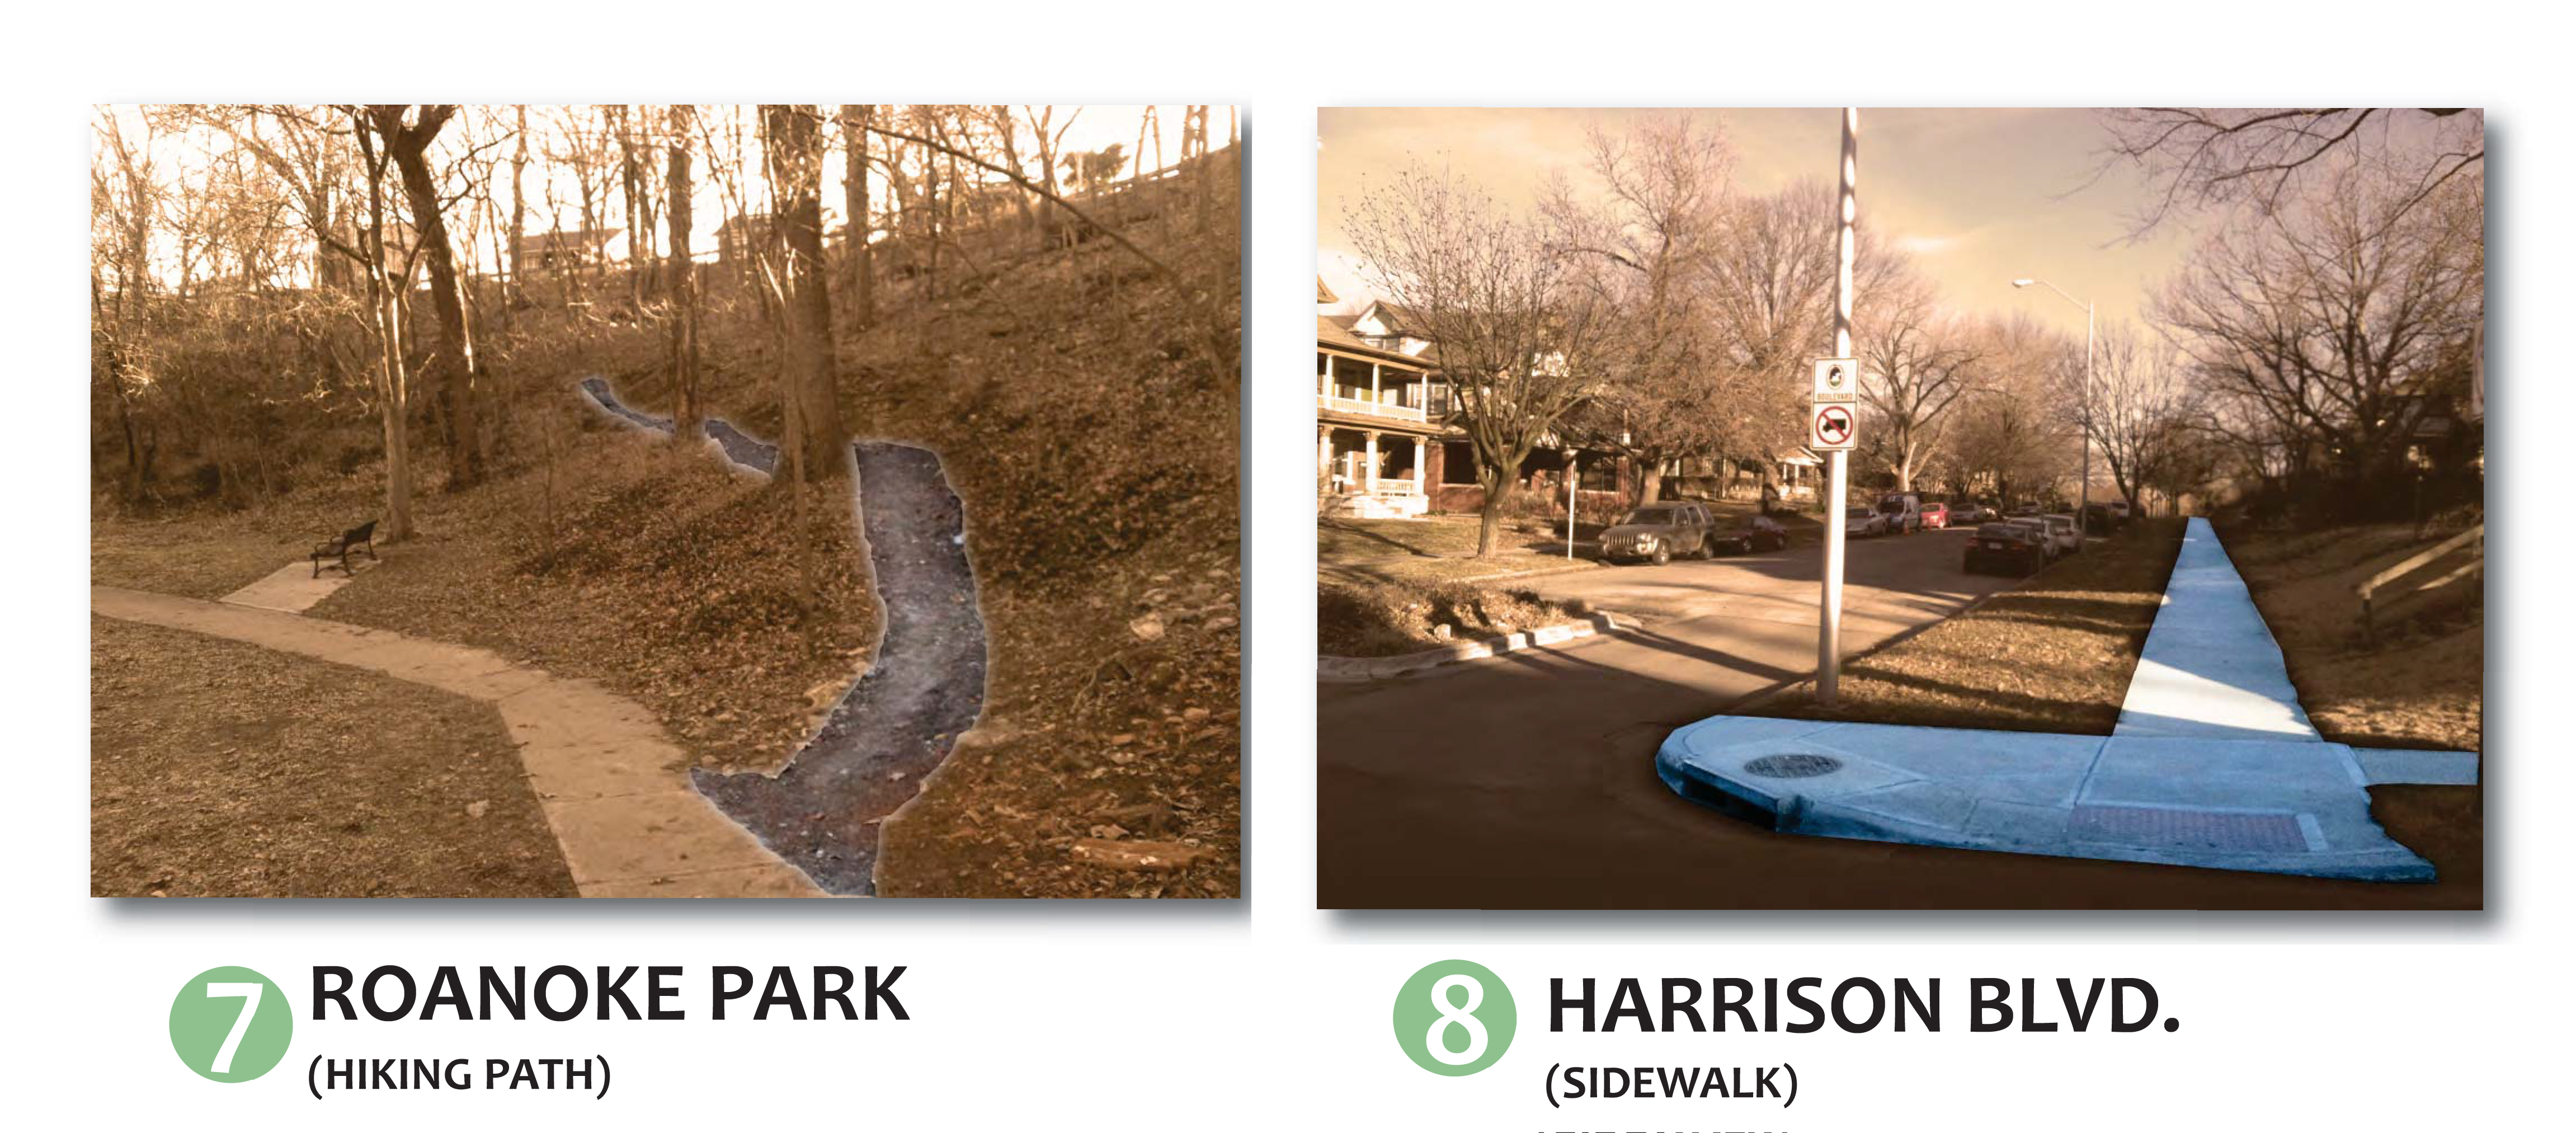
There are a few hiking trails in Kansas City’s parks. Many of them, such as the example below from Roanoke Park, are recent additions. They are the most narrow type of pedestrian path — in fact, this one seems more designed for mountain biking — and are made of wood chips or small stones.
Sidewalks, I’ve placed these last because they are probably farthest at the back of people’s minds when they think of paths in a park. But they aren’t found in parks, really — they line Kansas City’s boulevards and parkways. Why I’ve included them here is because they are designed a little differently than elsewhere in the city.
The City of Kansas City, MO, requires five-foot wide sidewalks to accommodate wheelchairs under the Americans for Disabilities Act (ADA). Sidewalks along parkways and boulevards, like Harrison Blvd. at 39th Street below, are supposed to be at least eight feet in width. They will also generally have more separation from the street than sidewalks elsewhere in Kansas City. (Many older sidewalks along boulevards and parkways seem to be less than eight feet wide.)
Other Types of Pedestrian Element
I’ve looked at several types of path so far, but there are other parts to a pedestrian network.
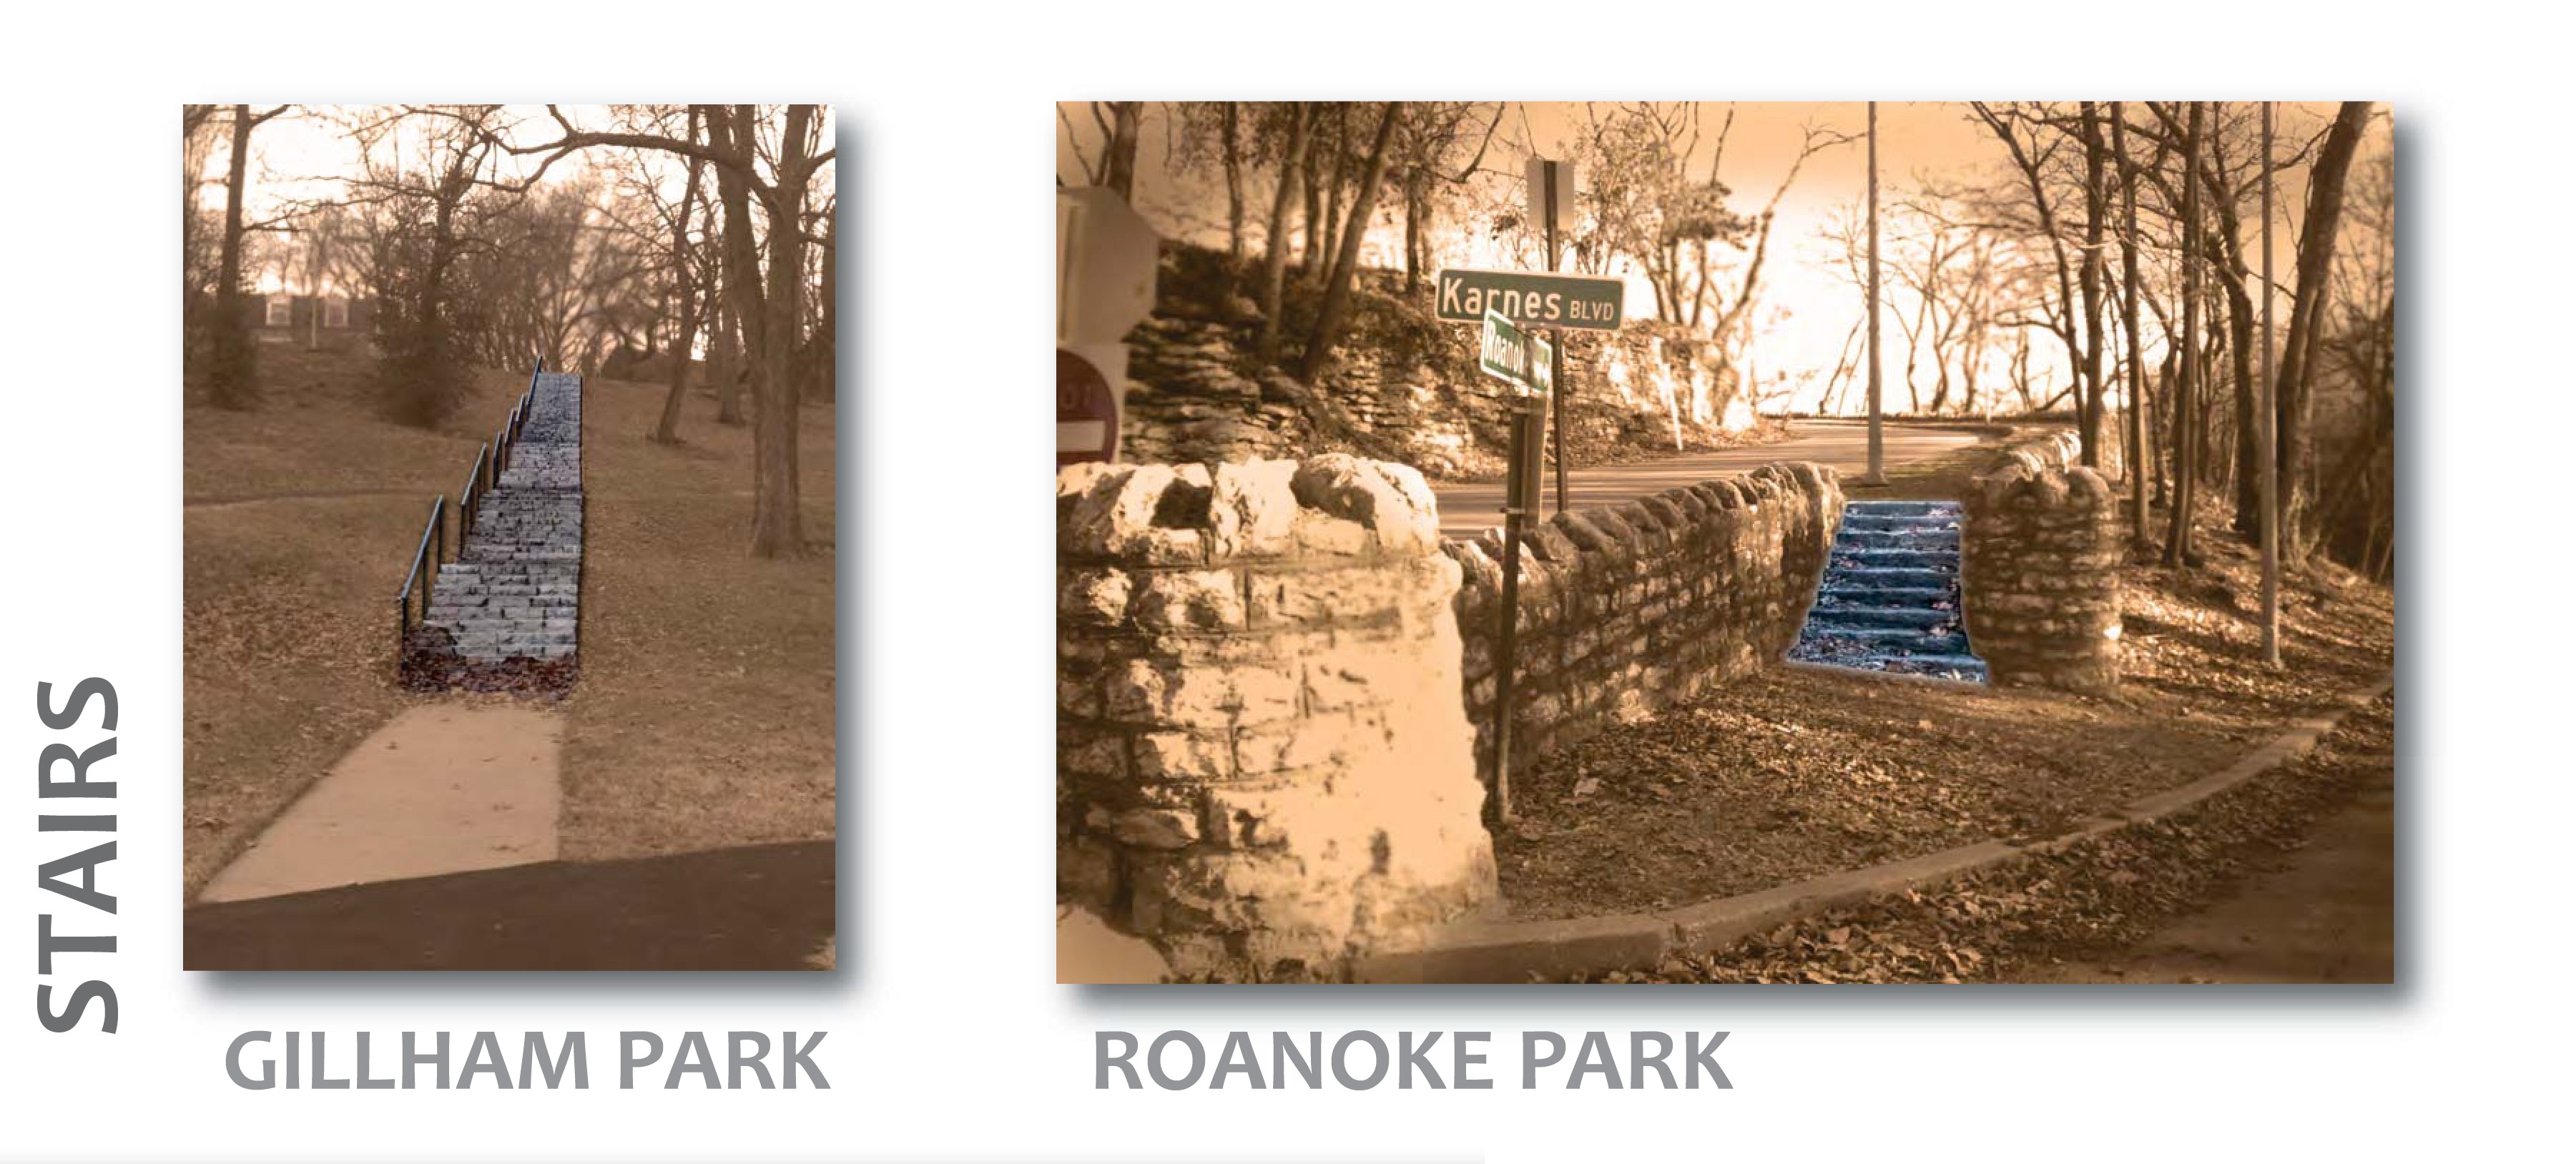
With Kansas City’s variable topography, stairs connect many paths in the Parks and Boulevards System. They often act as the gateway from an adjoining neighborhood to a park, like in the example below from Gillham Park.
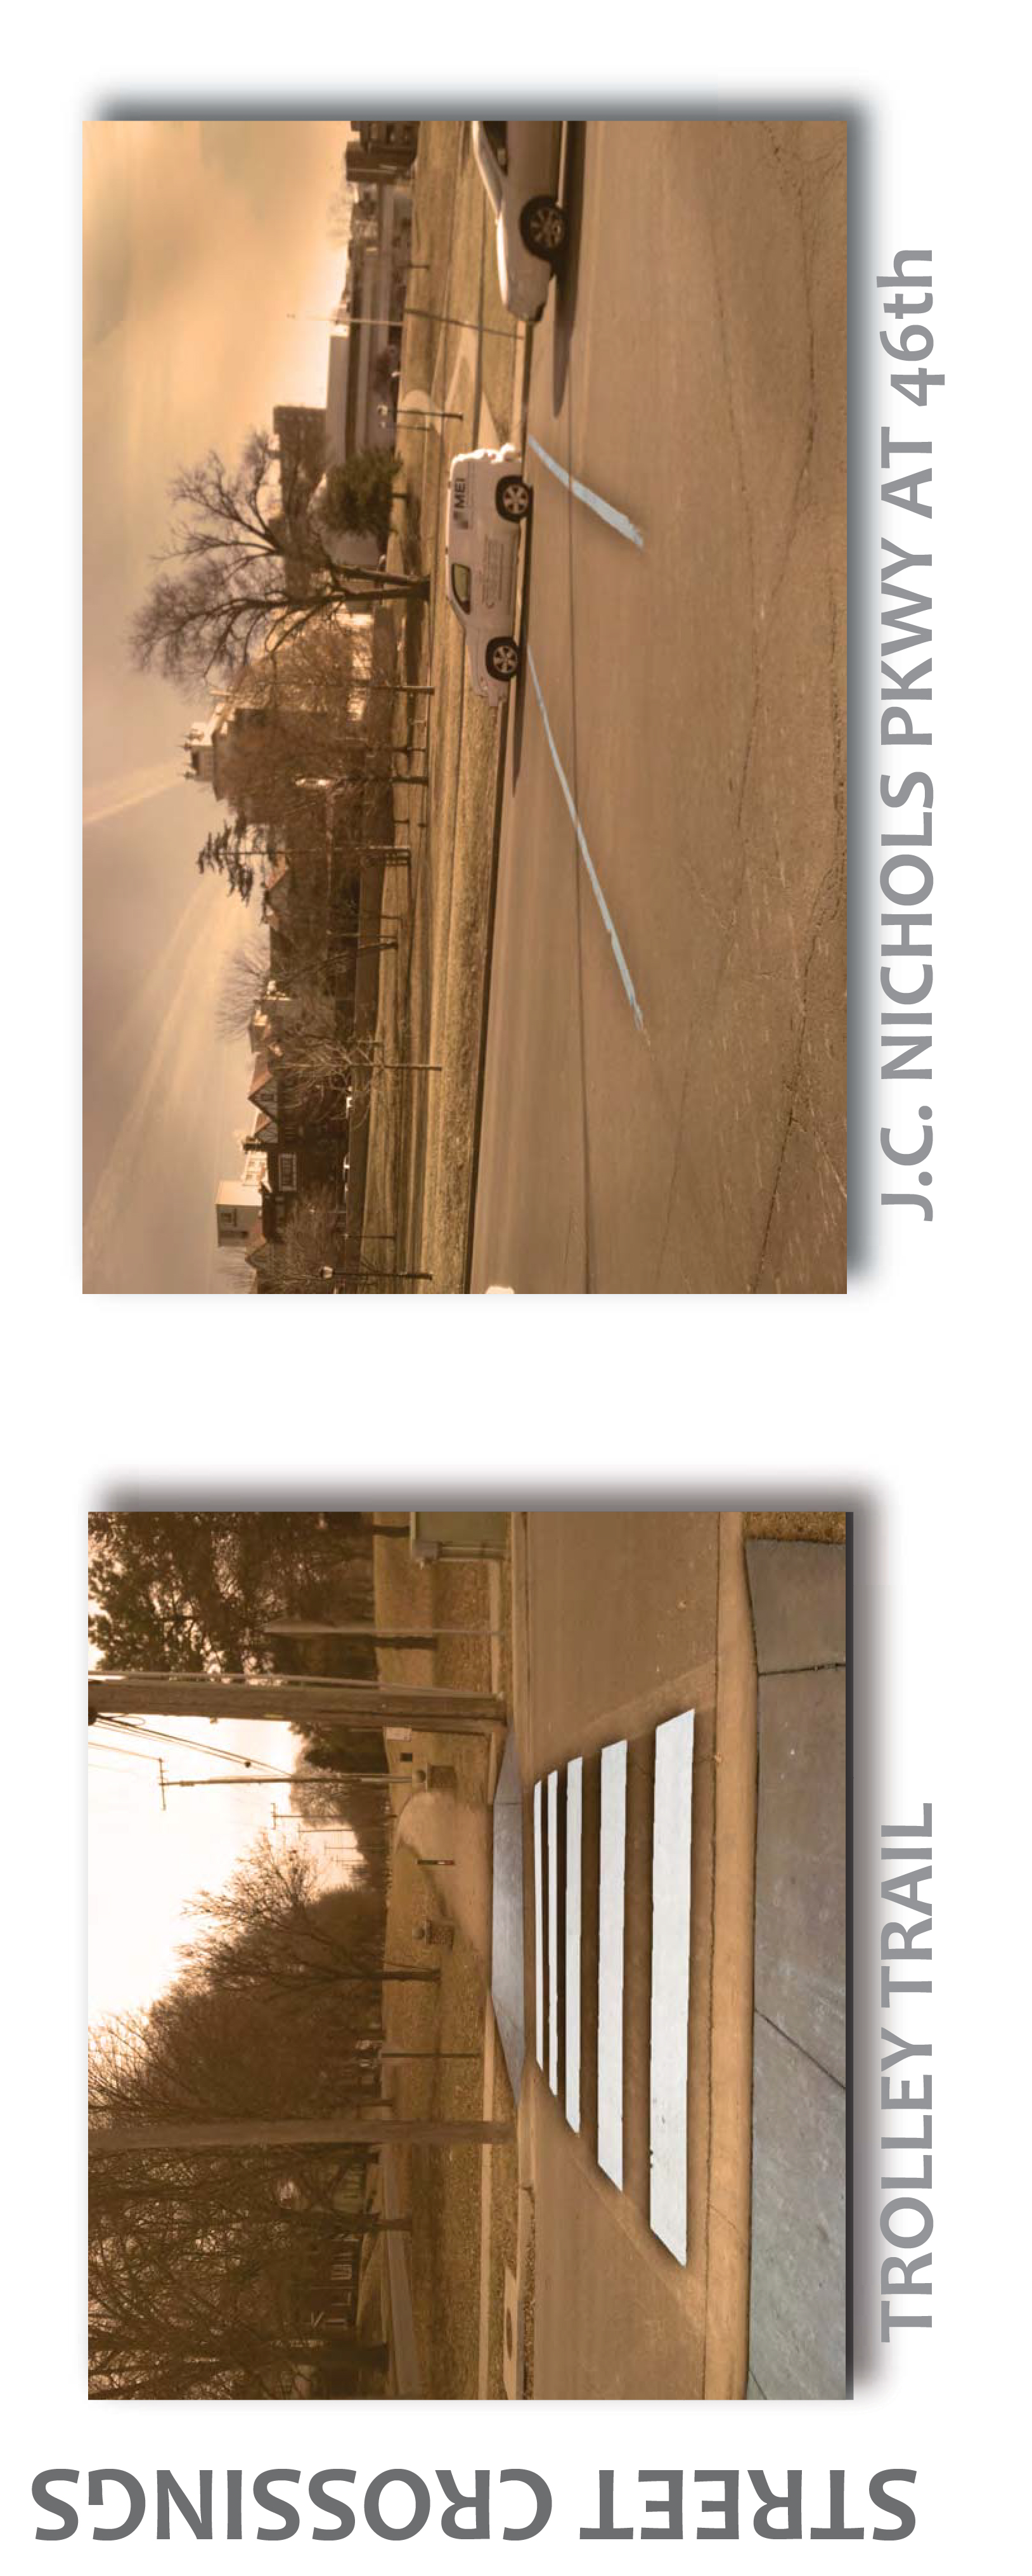
Crossings connect trails and link parks to adjacent spaces. The example on the left below is really an “ideal” example, with highly visible and wide “continental” style striping. Sadly, the deteriorating and much less visible example on the right seems to be much more common across the Parks and Boulevards system, making getting to or out of parks fairly dangerous in many cases.
Interventions (improvements)
Our second focus, after describing the system, was to propose an improvement to some aspect of our element at a location in the parks system.
I haven’t yet made sweeping value judgements of the pedestrian elements in the Parks and Boulevards system. But what if we look at the quality of the paths (and stairs and crossings) across the system? Are the paths well designed? Are they in good condition?
Mill Creek Park is probably one of the city’s most popular parks. That’s maybe unsurprising, considering it’s located on the edge of the Country Club Plaza, of the city’s most iconic and busiest places. Because of its prominence, it’s a good showcase of some of the issues with Kansas City parks.
There’s not much wrong with the most common type of pedestrian element, paths, in most parks. For pedestrians, joggers, runners, they seem to work fairly well. The paths work well for the users for which they are designed.
Issues arise in other places, however. And Mill Creek Park exhibits these problems.
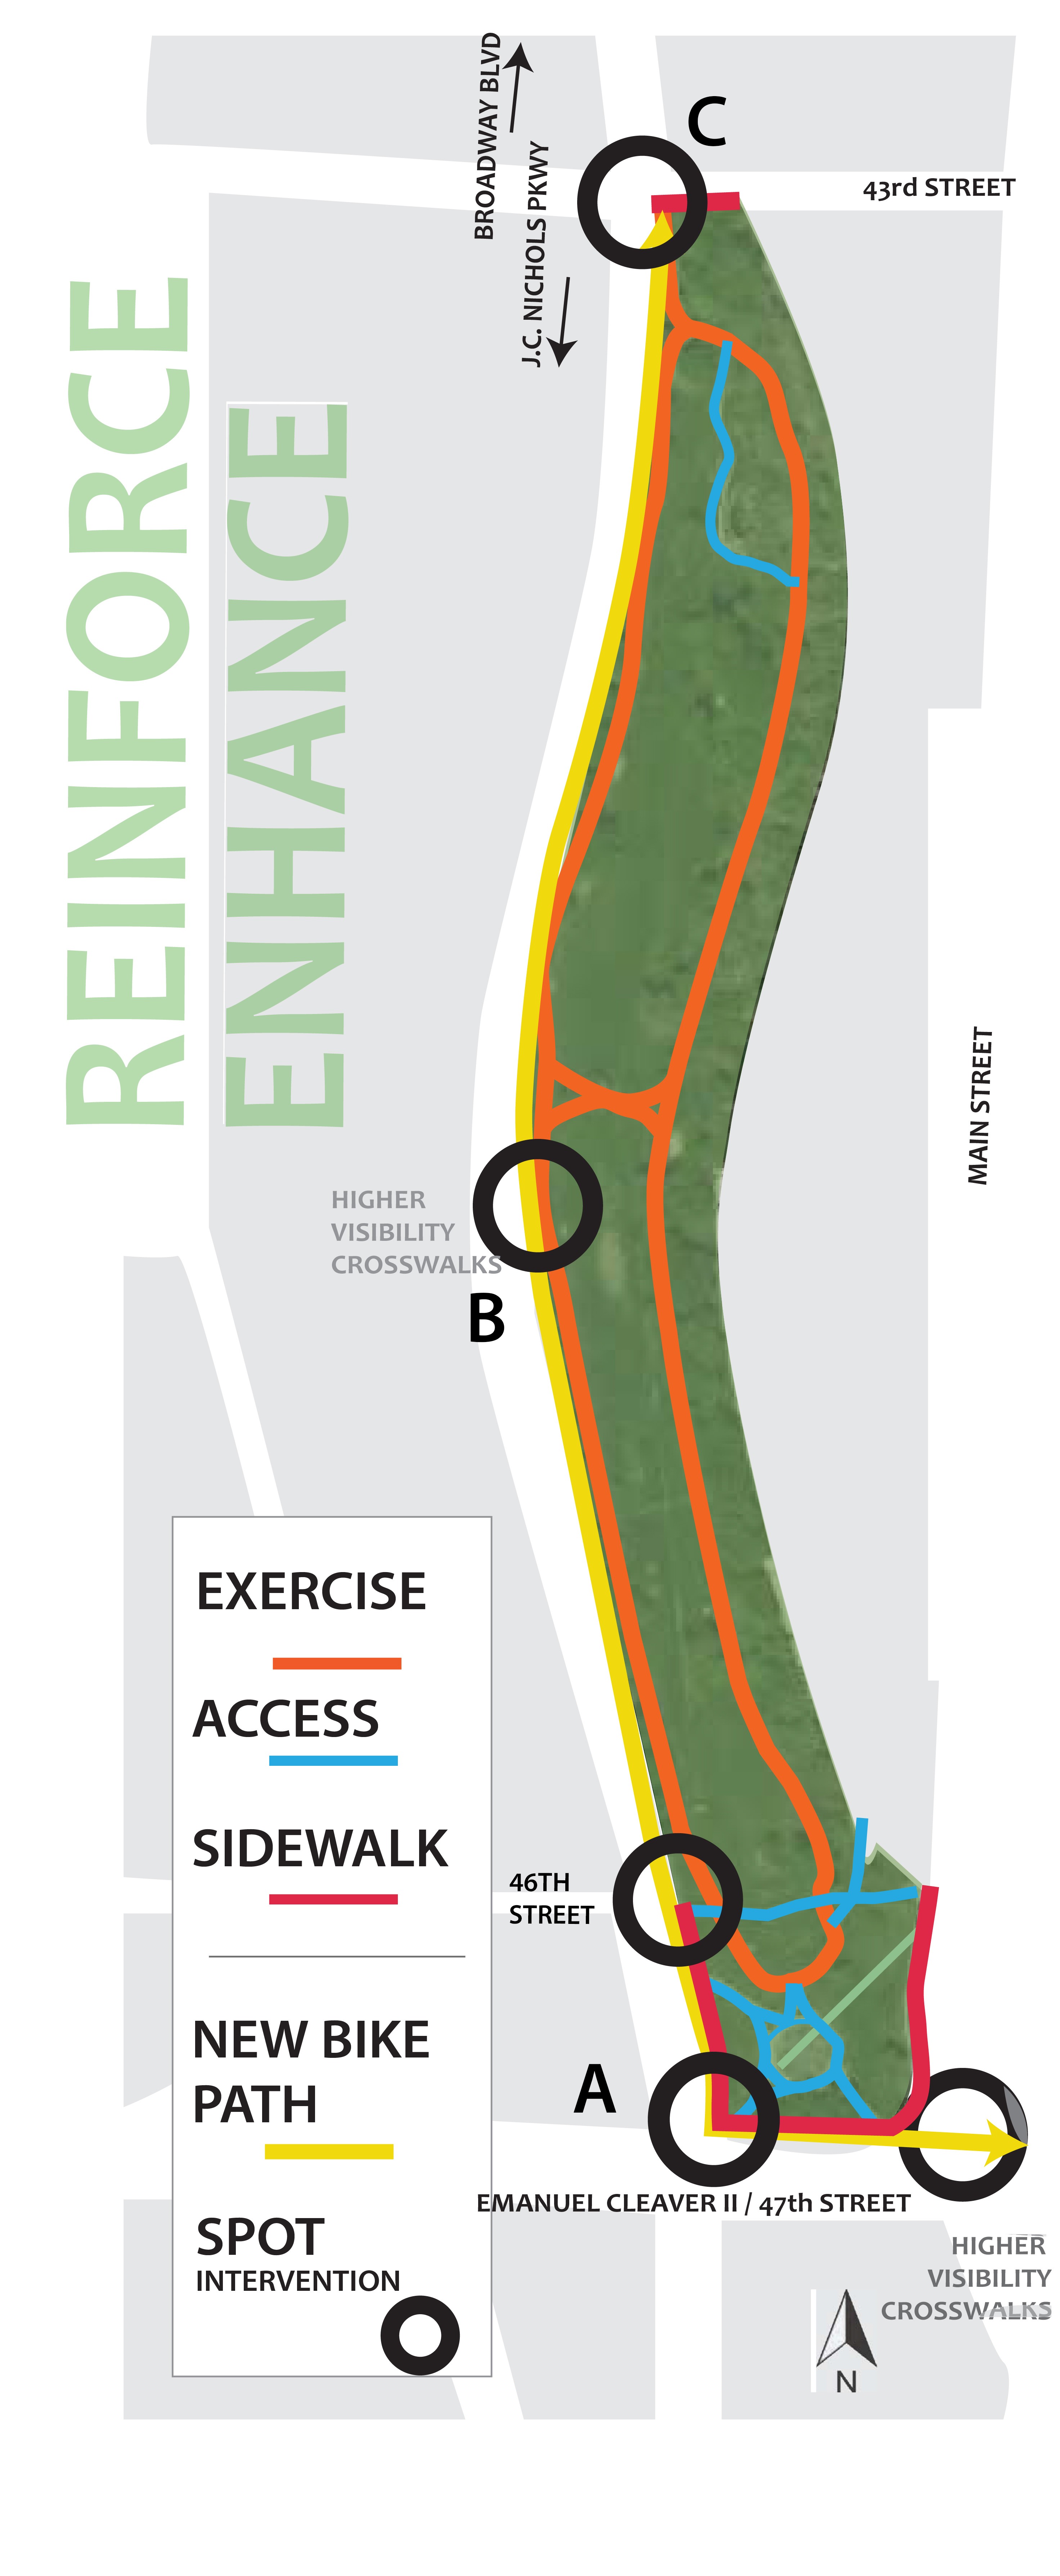
I’ve diagrammed the existing layout of the park’s pedestrian elements below.
Along with some connective sidewalks and paths leading to the iconic J.C. Nichols Fountain, there’s a mile-long exercise made up of two loops (shown in orange).
Again, like in most KC parks, there’s nothing wrong, in large part, with the existing paths at Mill Creek Park — not for the walkers and runners they’re designed.
There are two major issues at the park that do concern pedestrian. The first is that street crossings are in poor condition. Even if you are able to enjoy the paths within the park, getting to them on foot is a bit of a challenge! Mill Creek Park in particular is surrounded by some very busy streets.
Another problem is that the paths within the park aren’t just used by the intended users. Many people traveling by bicycle between the Plaza and Westport use the paths within Mill Creek Park due to a lack of bike infrastructure on adjoining north-south streets, like J.C. Nichols Parkway.
The issue here is that, at only eight feet wide, the exercise paths within the park really can’t safely accommodate both cyclists and people on foot. What’s really needed is a shared-use path — or good, separate infrastructure for bicyclists.
I proposed a few changes within in Mill Creek Park. I recommend no changes to the existing paths but propose some changes to adjacent elements in order to improve the experience for pedestrians.
The biggest change would be a separate bike lane and path running along the west side of the park along J.C Nichols Parkway. I’ve indicated the location of other improvements with black circles on the diagram above.
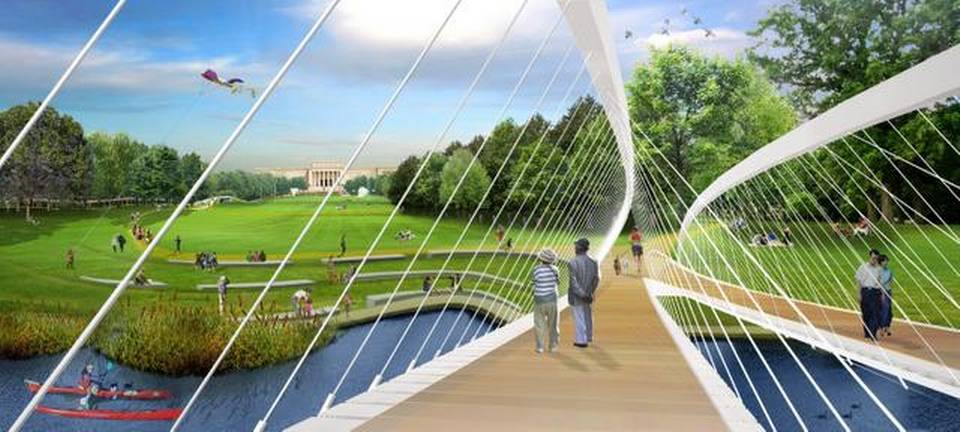
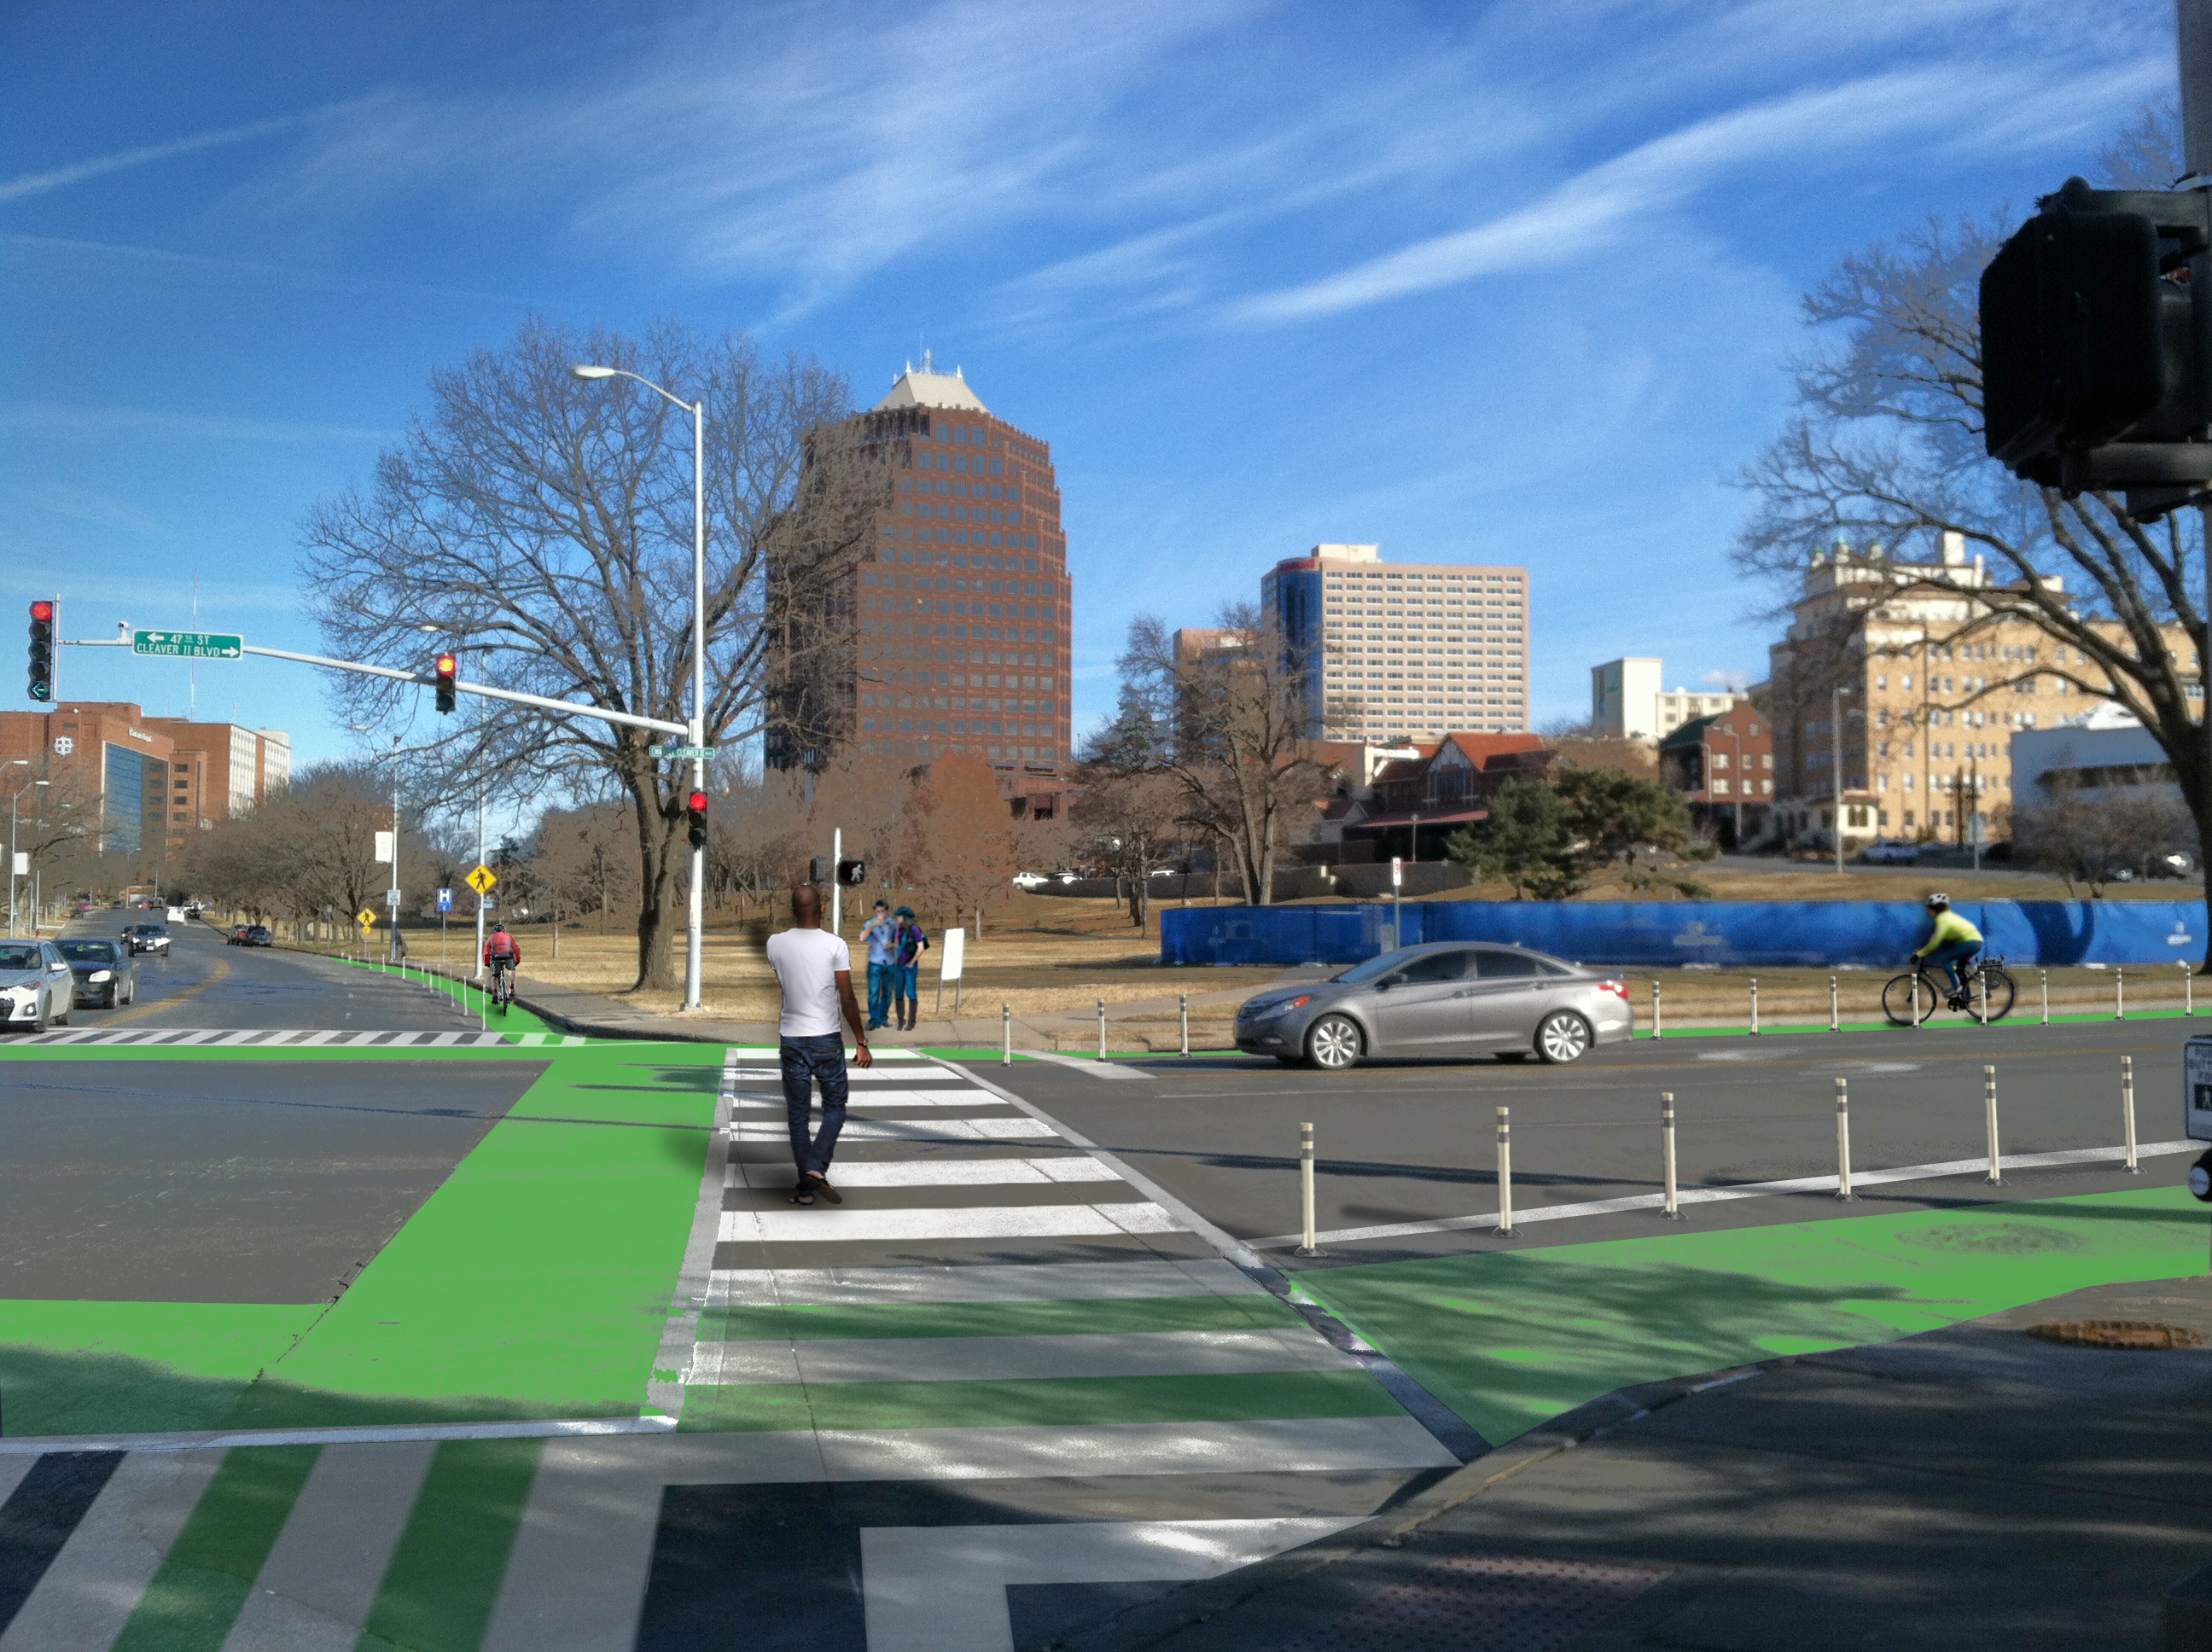
The bikeway would begin on the south side of the park as a bike lane along Emanuel Cleaver/47th Street, as shown in the rendering below. Higher-visibility crosswalks would also be added.
Looking north into Mill Creek Park from the southeast corner of 47th Street and J.C. Nichols Parkway
The above rendering shows how bike lanes could be introduced throughout this major intersection. The bikeway specfically oriented to Mill Creek Park, though, is the one leading away to the north along J.C. Nichols Parkway.
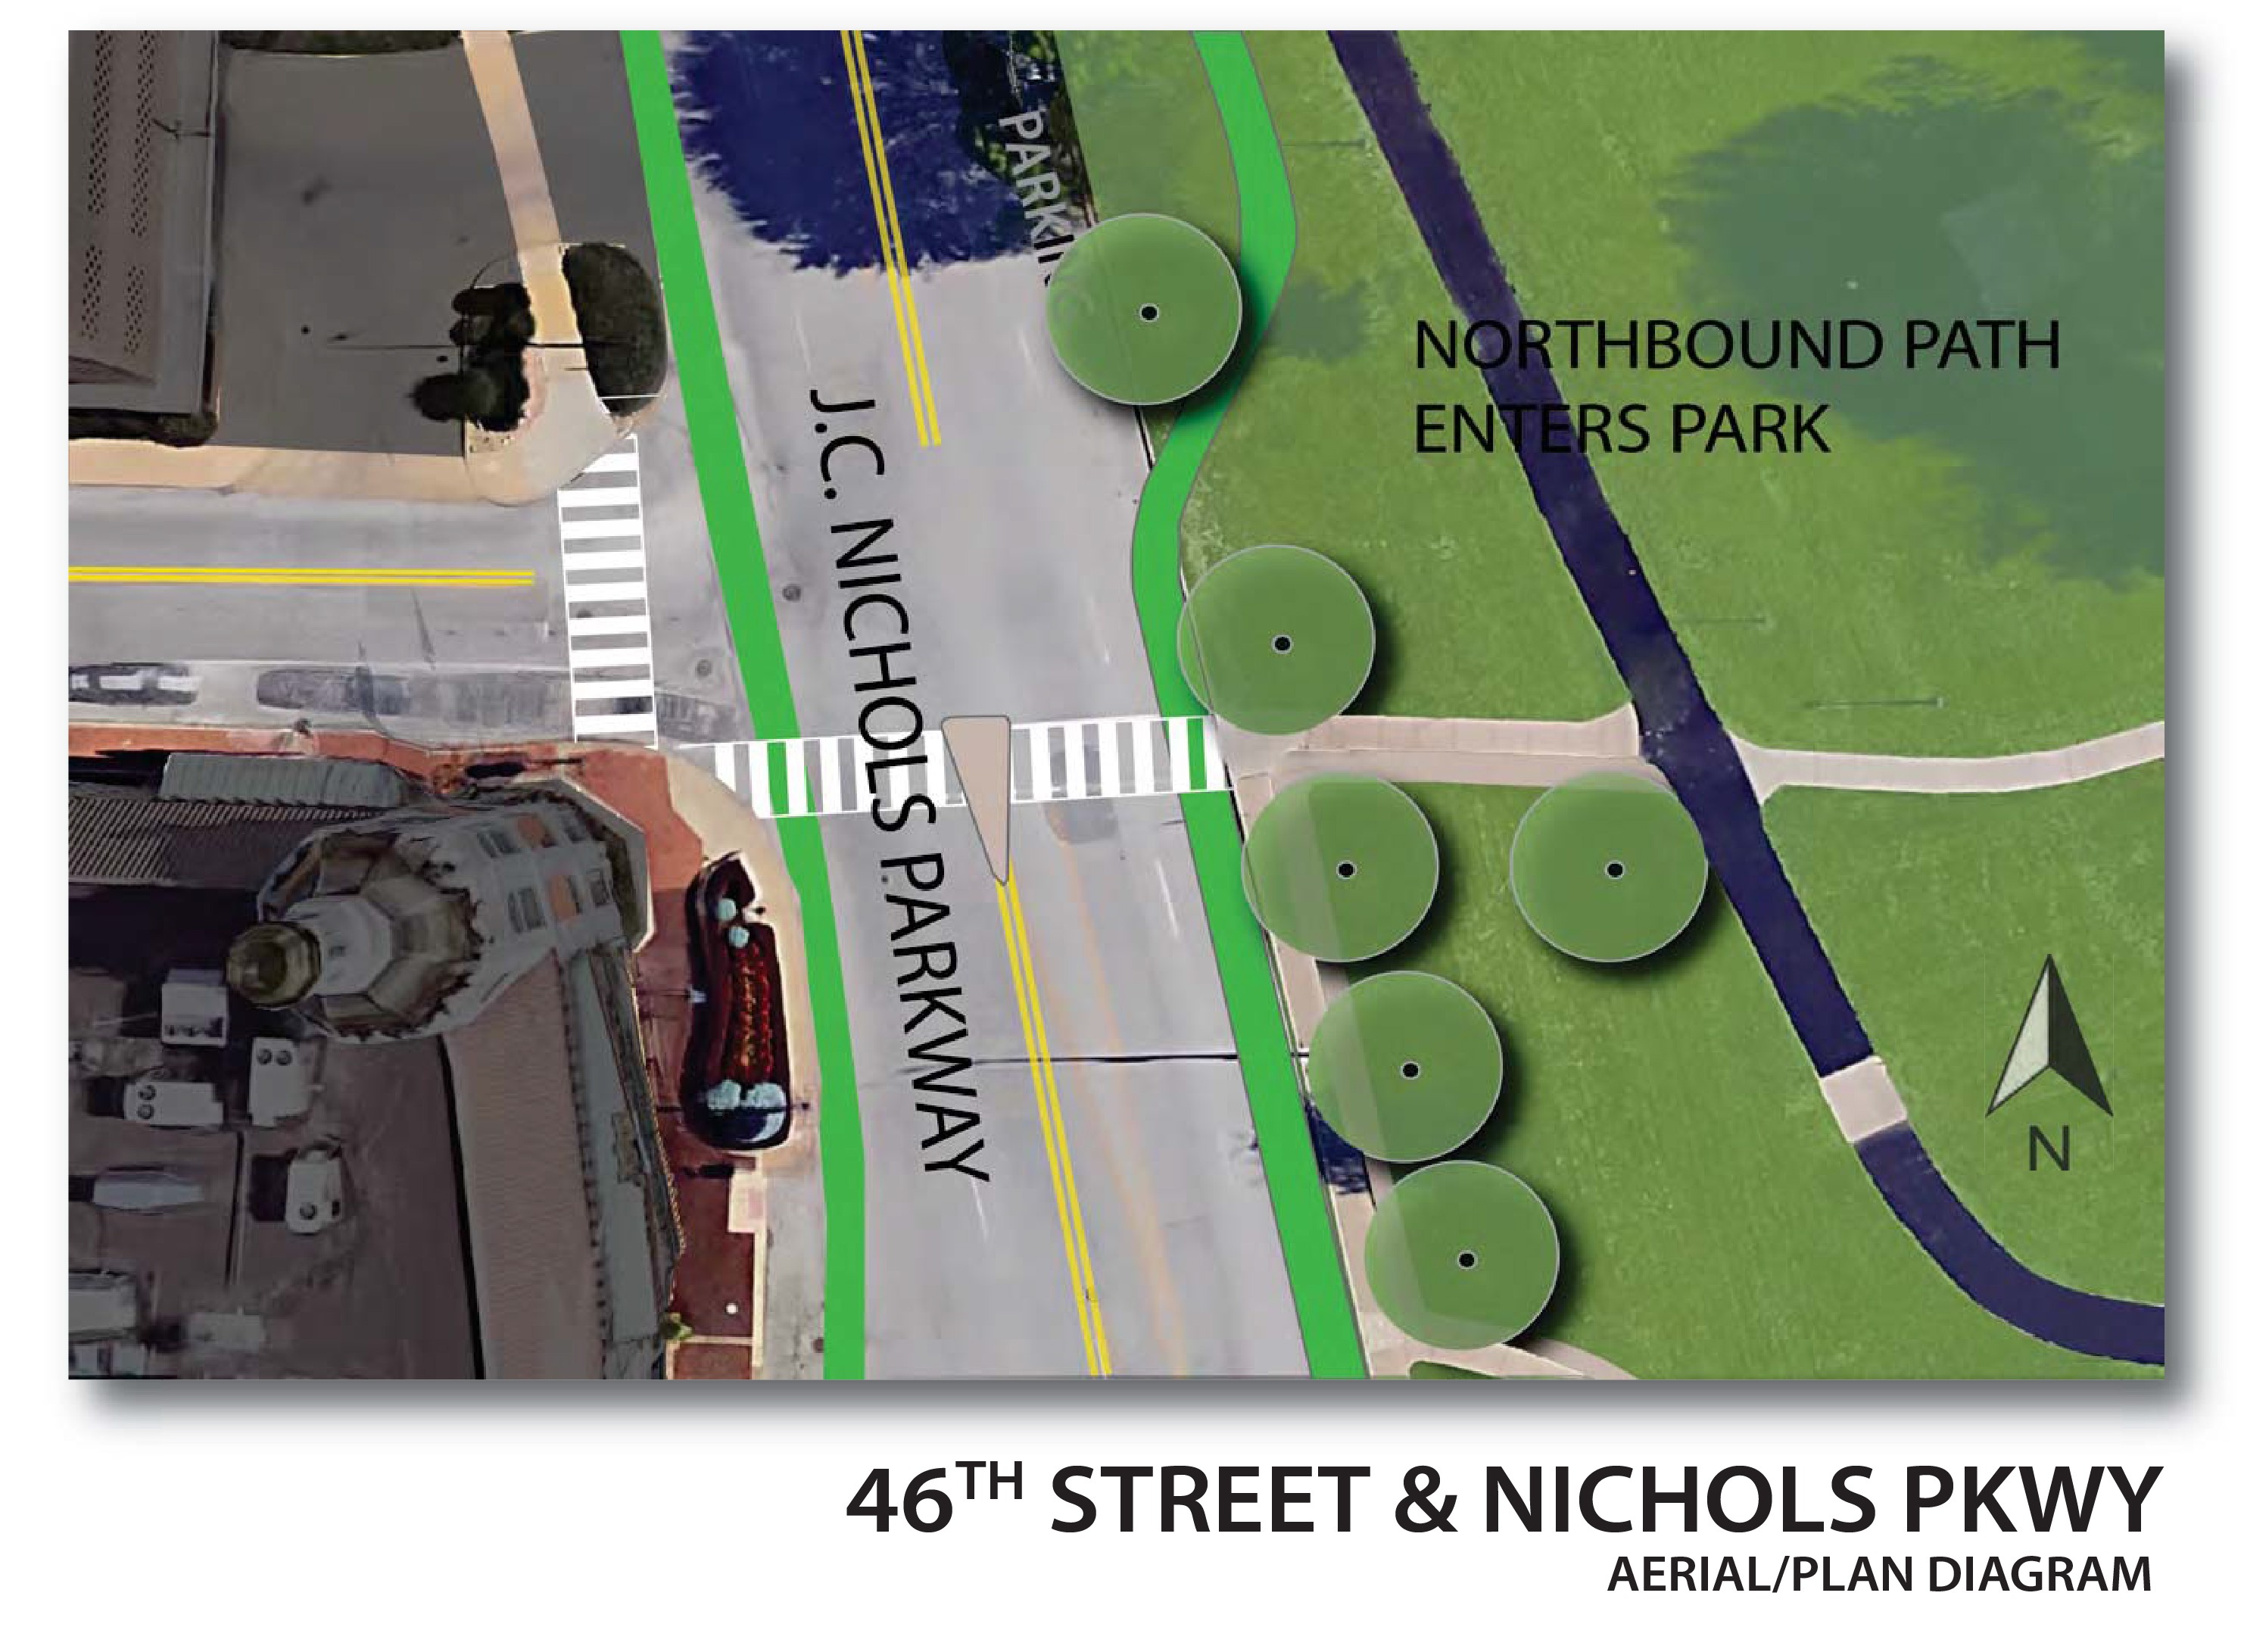
The keep fast-moving cyclists away from crowds around the popular fountain (surrounded by blue construction barriers in the rendering — it’s being renovated), the bikeway would remain a bike lane until reaching 46th Street. At that point, with a parking lane occupying the road ahead, the lane would enter the park. (Parking is currently allowed on the east side of the street almost all the way down to 47th Street, but spaces are not typically occupied until after 46th Street.)
How the bikeway would enter the park is diagrammed above. A southbound bike lane would also be added — due to the lack of parking on that of the street, this lane would remain “on-street.”
The existing crosswalks at this intersection would be made more visible.
The bike path would continue north within the park until 43rd Street, where it would again merge with the street (after avoiding a bus shelter). Again, higher
These are changes that, I think, could be made across the Parks and Boulevards system. With some tweaking done to pedestrian elements and addition of better infrastructure for other modes, your experience of the system’s pedestrian features would be reinforced and enhanced.


