Quick analysis skills are essential in the planning vocabulary, in the sense that they allow you to break down and analyze various types of research and data, and illustrate findings in an expeditious manner. A series of in class quick analyses looked at multiple characteristics of Kansas City’s Parks and Boulevards, including a thematic comparison, illustrating the relationship of demographic and socio-economic data and the distribution of parks, as well as past and present patterns in land use and zoning.
The boundaries of study for this series of analyses represent the 1947 city limits, with the Missouri River to the north, the Blue River to the east, 79th Street to the south, and State Line to the west.
THEMATIC ANALYSIS
This first analysis was intended to show either the direct or indirect relationship between the amount of available park space and median household income. To begin analyzing the data, an inventory of 117 parks spread out across 86 Census Tracts were mapped using ArcMap GIS Software, in combination with income information from the 2012 American Community Survey.
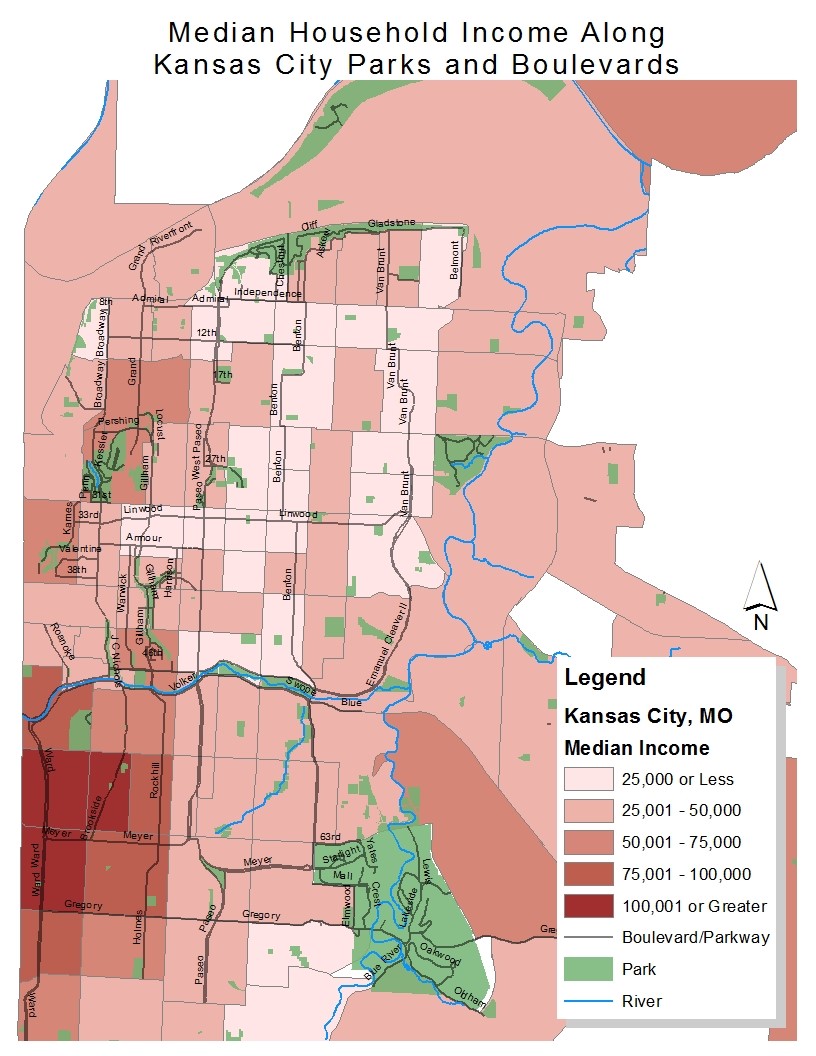
Figure 1 shows the locations of parks across multiple census tracts in Kansas City, and illustrates several patterns related to income levels and park access. The map shows that many of the larger sized parks, including Kessler Park, Blue Valley Park, Swope Park, Loose Park, and Penn Valley Park are all located towards the outskirts of the study boundaries. Together, these parks account for nearly 2,600 acres of park space, more than half of the total park acreage for the entire study area, which is roughly 5,055 acres.
A second pattern, pertaining to income levels, is that the majority of high median income residences ($75,001 or greater) are located in census tracts to the western boundary of the analysis area. These tracts include a large number of residences in the Brookside neighborhood, as well as several from the South Plaza area. Coincidentally, these are also the location of some of the higher quality parks listed on Kansas City’s Parks and Boulevard System. Loose Park, arguably one of the systems gems, is located to the north of the Brookside Neighborhood, and is surrounded by tracts with median household incomes of $75,001 or greater.
Similarly, areas of Kansas City with a lower quality or parks, or a lower concentration of park space in general were often associated with lower income levels ($25,000 or less). Looking at the Eastern part of Kansas City, along Van Brunt Boulevard, from 12th Street to 31st Street, Figure 1 shows a very low concentration of parks. This 2 mile stretch of Van Brunt hosts only 6 parks, totaling 60 acres
The conclusion of this analysis determined a relationship between park accessibility and median household income, in the sense that areas with lesser park space were often associated with areas of lower income. Areas with a higher number of parks, and in most cases, a larger concentration, showed higher levels on income.
ZONING AND LAND USE ANALYSIS
The second analysis focused on land use patterns and zoning requirements, and how they differ based on location. The scope for this assessment focused on Roanoke Road, from 39th Street to Valentine Road, which is currently zoned for B3-2 commercial uses, and R-5 residential use.
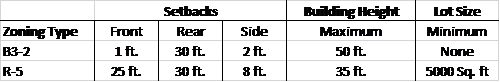
Regulations for residential development in this area are comparable to surrounding neighborhoods. Regulations for development in the B3-2 zone are slightly stricter however. Since commercial developments in this area are abutted against a residential zone, additional regulations are imposed.

In this area, land use regulations determine where different types of development can take place. As I found in the last analysis, many houses along 39th Street were removed several years ago, and the area was rezoned for commercial use. Looking at Figure 2, you can see the development patterns of commercial use. Notice that although this corridor is zoned for B3-2 commercial use, there is a nonconformity of more than ten lots that are currently used for residential purposes along 39th. It is likely that this was enabled by the use of a variance, but the reason is unclear. Beyond 39th Street to the north, the remainder of lots are currently used for residential purposes, including single family and multifamily dwellings.