Following up on some of work covered in our studio over the past few weeks, this assignment was designed to compile all of our findnings, and collectively synthesize what these findings meant for the future of the Parks and Boulevards System. After a group SWOT analysis, specific focus topics were identified and assigned for an in-depth analysis
PARK SYSTEM METRICS
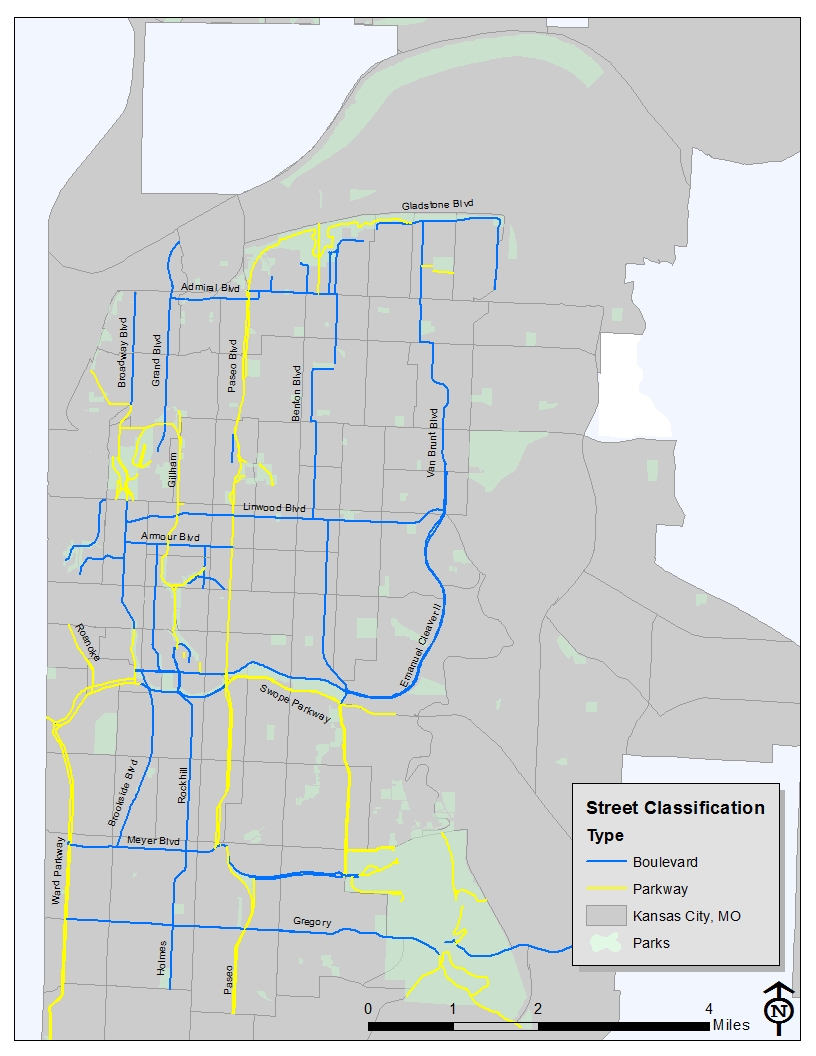
The analysis of Park System Metrics looked at the system as a whole, and focused on the distribution of parks and boulevard and related ameinities throught the Kansas City area. Here, parks and boulevards were identified and categorized based on a number of attirbutes. Figure 1 shows the location and differentiation between parkways and bouevards throught the system. Note how the Parkways seems to offer a “direct route” to a destination, more or less, while the Boulevards tend follow more of an organic, free-flowing pattern.
Kansas City’s Parks and Recreation Department categorize park space into four classifications: Community Parks, Neighborhood Parks, Regional Parks, and Greenways. Figure 2 shows the distribution of these park types in Kansas City. The majority of park space, in terms of total number of parks, in Kansa City appears to be neighborhood and community parks, and are spread sporadically throughout. The southern
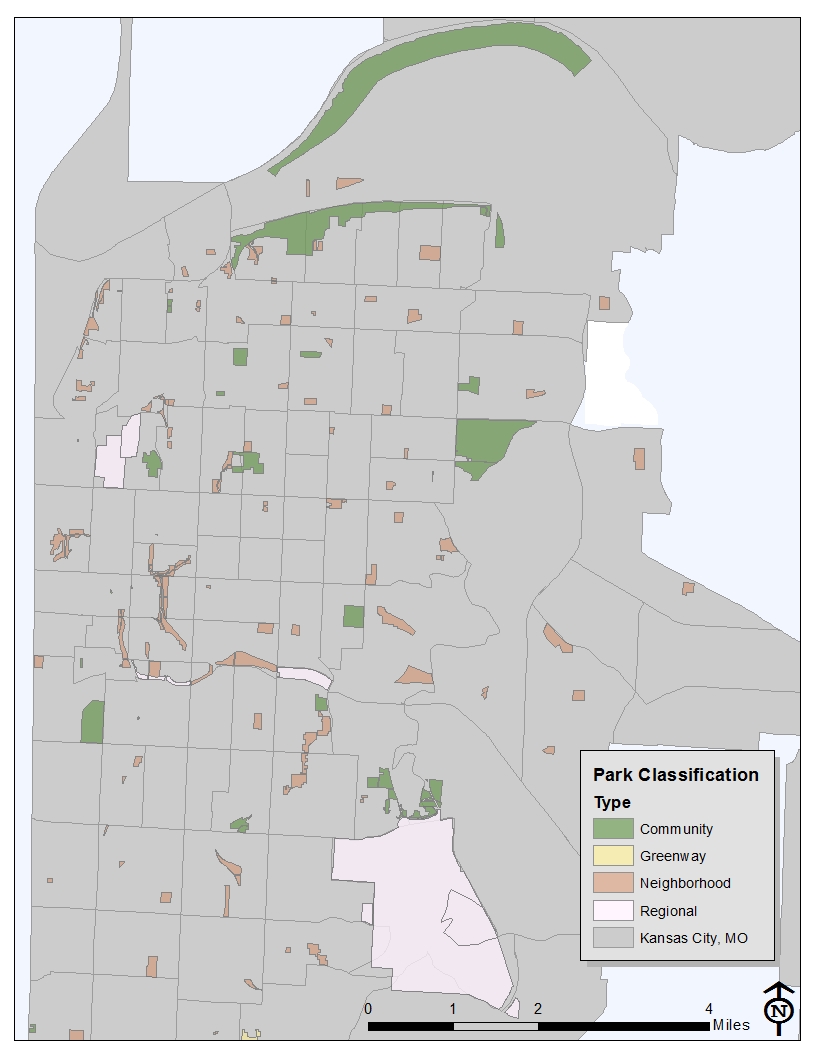
As you can see, the majority of parks are classified as either neighborhood or community park space. There appears to be a nice balance of regional park space in ares of souther Kansas City, as well as the Midtown area, however, the northeastern portion of the city seems to lacking this type of development.
PARKS AND ECONOMY
This analysis looked at the effects that the Parks and Boulevard system plays in Kansas Cities economy. In the last assignment, I looked particularly at median household income level throughout Kansas City at the census tract level. The findings in that research showed a relationship between amount of available park space and income level, in the sense that census tracts with more park space, or even a higher concentration of park space were often associated with higher income. In the case, I focused in on property values per parcel, both surrounding park space, and in areas with less park space.
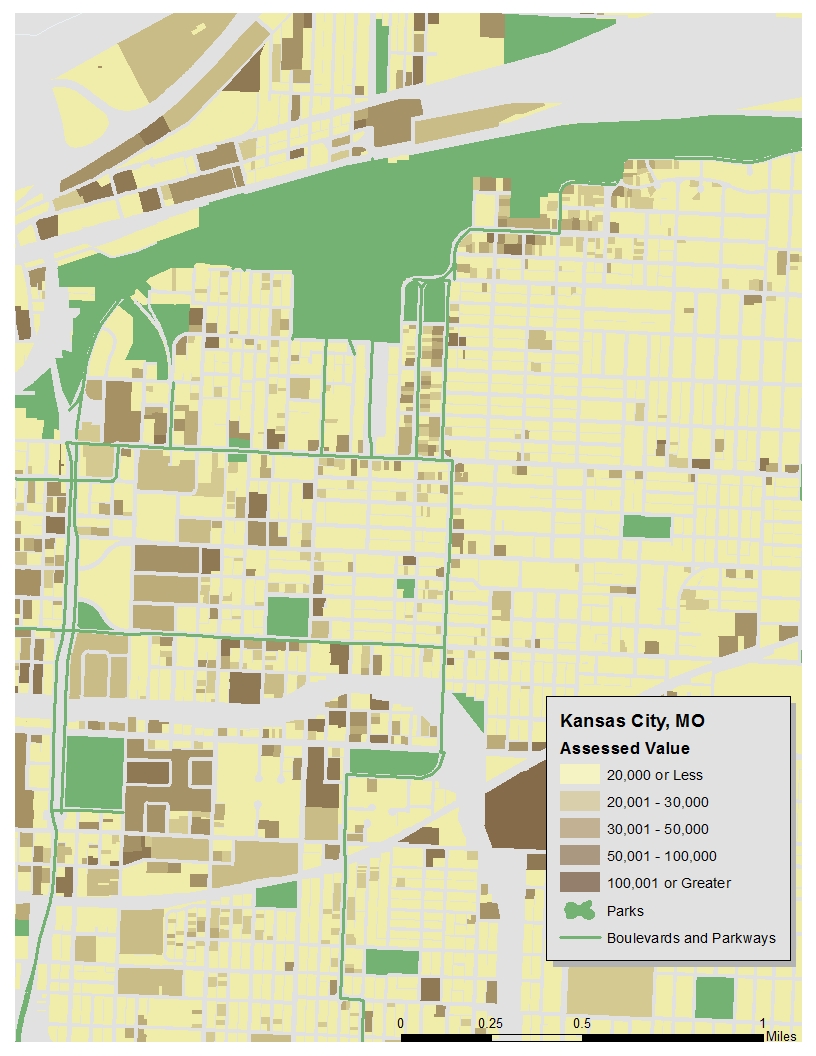
Figure 3 accurtately depicts the relationship between the presence of park space or proximiety to a parkway or boulevard and property values. This analysis concluded that parcels located near a parkway or boulevard, or in close proximety to a park were often associated with a higher property value. In Kansas City, the average assessed property value is around $13,500. On average, homes located at least a quarter mile of a public park showed a value of $13,650, and homes within one quarter mile of a parkway or boulevard showed an average value of $14,291.