Category Archives: Visions

Final Presentation

For my final presentation I leaned heavily on the design of policy rather than focusing more on the design of the built environment. The policy I designed is called the Housing & Economic Development Authority.

The Housing & Economic Development Authority (HEDA) is a proposed municipal agency for Kansas City, Missouri that would function as the City’s in-house real estate developer, property manager, and public construction authority. Authorized under Missouri Revised Statutes Chapter 99, HEDA combines acquisition, development, and management of affordable housing with economic development under a single governance structure.

HEDA operates three coordinated revenue and development streams. Stream 1 is acquisition and rental: Section 108 seed financing capitalizes the purchase of existing occupied multifamily properties from the private market, generating day-one rental income that flows to the City through a structured reverse payment in lieu of taxes (PILOT). Stream 2 is new construction, demonstrated at scale by the proof-of-concept Valentine neighborhood redevelopment master plan and phased over the long term as authority capacity matures. Stream 3 is construction services: HEDA’s in-house construction division performs fee-for-service work for other public bodies, mission-aligned nonprofits (including affordable homeownership partners such as Habitat for Humanity Kansas City and the Kansas City Community Land Trust), and qualifying private clients, recycling margin to the general fund.

HEDA’s financial model is revenue-positive from Year 1. Capital costs are funded through a sequenced strategy: a $42.5 million HUD Section 108 loan deployed Years 1–3 (secured by CDBG allocations at zero net cost to the general fund), followed by a master drawdown revenue bond facility issued against demonstrated debt service coverage, the Underutilization & Vacancy (UV) Tax revenue stream, and portfolio rental income beginning Year 4. Acceptance of Housing Choice Vouchers at projected ~50% penetration in acquired buildings closes the gap between deeply affordable rents and authority operating costs by routing existing federal subsidy through HEDA rather than private landlords. Revenue generated by HEDA is constantly reinvested: HEDA’s 90% Operational Capacity Rule ensures that no more than 90% of total authority inputs are consumed by total authority outputs in any year, guaranteeing a minimum 10% net contribution to the general fund at all times while maximizing portfolio expansion.

Maximum rents are capped at the higher of fifty percent of comparable private-market rent or a tiered minimum wage floor (15% of full-time minimum wage gross income for studios, increasing 18% per additional bedroom). Under current market conditions the 50%-of-market formula governs all unit types, producing a weighted average of approximately $615 per month with no annual escalation. Mixed-use developments include ground-floor commercial space leased at below-market rates to locally owned small businesses through a scored application process. At disciplined acquisition pace of 250 units per year plus phased new construction, HEDA reaches approximately 5,263 units by Year 20 and 6,513 units by Year 25, generating a cumulative general fund contribution of $623.5 million over 25 years.

Development Opportunities

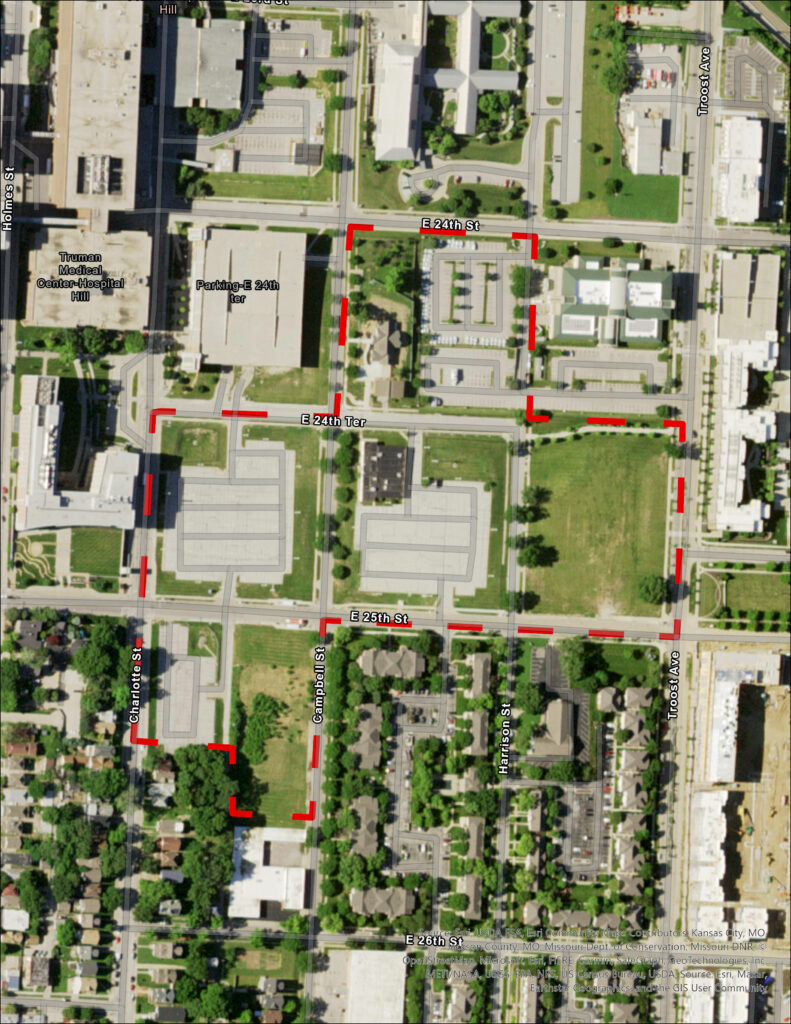
Valentine, unfortunately, has a myriad of development opportunities due to the massive demolition projects without replacements conducted by the Kansas City Life Insurance Company. Ultimately I think what the Valentine neighborhood needs most is truly affordable housing that is slightly more dense than single unit structures that match the current character of the neighborhood. The neighborhood would benefit from much more density but at a base level it needs to be at least slightly denser than the remaining character of the southern side of Valentine.

Valentine Development Opportunities

Housing

For housing, missing-middle density is ideal. Valentine is in no need for mid-rises due to the heavy concentration of density along Broadway. Gentler density should make nearby rents more stable than higher densities.

Also, there is a hospice and nursery home nearby, as well as the VFW building. These businesses creates some need for housing commodities towards the elderly and disabled populations, as these areas would make that cohort want to live at Valentine.

Transportation

Southwest Traffic-way is in need for a road diet, as well as 33rd street and Linwood Boulevard, both of which has an unnecessary number of lanes. A road diet could fill in significant gaps in Kansas City’s bike network.

Additionally, Valentine is in close proximity to two large trail networks at Penn Valley and Roanoke. Using Valentine to better serve these connections would make it much easier to get to these trails.

Parks/Public Space

Another advantage to missing-middle density is that it allows for more open space. Valentine is not in great need for a large park because of Penn Valley Park, but the site should have attention towards open space as a design transition into Penn Valley.

Development Opportunities

Performance can be measured by reference to the spatial form of the city and the quality of spaces, recognizing that local context is often the primary influence on development and redevelopment. Previous developments and proposals can serve as a basis for what established place there originally.

An environment can be used to communicate the past and the present that form an extended pattern. Patterns in time are often celebrated, with holidays and the seasonal shifts, often influencing the uses of public and private spaces. The dimensions identified by Lynch are not too rigid or prescriptive to resist changing qualities of the environment. The consideration of a temporal factor in the identified dimensions of performance makes them consider needs of future development and anticipated challenges. 

The absolute of future development for the Valentine neighborhood is construction of more housing units, with diversity in housing stock comparable to what was available in the neighborhood’s past. Small apartments, ranging in 3 to 6 units, comprised the majority of units in structure in Valentine.

Existing Conditions + History of Transportation

The beginning of fixed route transit service to the Valentine neighborhood began October 1, 1889 as the Washing and Summit cable car line

• Provided access from West Bottoms to Downtown and the north side of the Valentine neighborhood

• Ran from Union Depot on Ninth to Washington. Washington to about 13th-14th Streets, continuing on13th-14th Summit Street. Summit Street to 29th Street

• Service was reduced to Southwest Boulevard in early 1901

Source: KC History https://kclibrary.org/art-objects/map-greater-kansas-city-suburbs

In 1920 the  Valentine neighborhood was served by the 21 Jackson-Roanoke streetcar route

• Service on the streetcar route from 1910’s

• Destination sign would read Jackson – 24th on Northbound trip

• Destination sign would read Roanoke – 45th or Summit – 39th on Southbound trip

• Streetcar service along Summit Street until widening and repaving of Summit Street in 1951

In 1944 the  Valentine neighborhood was served by the 57 Jackson-Roanoke streetcar route

• Service continued from 21 streetcar route from 1910’s

• Destination sign would read Jackson – 24th on Northbound trip

• Destination sign would read Roanoke – 45th or Summit – 39th on Southbound trip

• Streetcar service along Summit Street until widening and repaving of Summit Street in 1951

Source: KC History https://kchistory.org/image/broadway-boulevard-valentine-road-0

Streetcar service along Broadway Boulevard concluded in 1940’s

• Routes 4 and 48 provided service on Broadway Boulevard from 1920’s to 1940’s

• Route 4 ran from Ward Parkway and 59th Street to Belleview Avenue, winding on Westport Road and Broadway Boulevard to Downtown 

• Route 48 ran from Downtown along Broadway Boulevard to 39th Street, providing service east-west between State Line Road and Broadway

Broadway Boulevard is serviced by a single bus route, traveling from the Plaza to Armour

• Begins at the Plaza Transit Center, travelling up Broadway Boulevard and turning East onto ArmourBoulevard

• Runs on Armour Boulevard / 35th Street to Van Brunt, returning from Van Brunt Loop

• Connects St Luke’s Hospital to the Kansas City VA Medical Center along a dense residential corridor

• Route 35 has 435 daily riders in January 2026

Main MAX service was rerouted to Broadway Boulevard for nearly ten years 

• Provided 20-minute headways either direction from Waldo to River Market and Columbus Park

• Travelled along Grand Boulevard through Downtown, on Pershing Road, turning onto Penn Valley Drive / Broadway Boulevard

• Ran from 5AM to 12AM from Monday – Saturday

• Reduced service on Sundays

The Main Street Extension of the KC Streetcar replaced Main Max service 

• Operates at 10-12 minute frequencies

• Runs from 5 AM to 12 AM Monday-Thursday

• Runs from 5 AM to 1 AM Friday and Saturday

• Runs from 6AM to 12AM Sunday

• Connects River Market to South Plaza, UMKC

• Encourages Transit Oriented Development (TOD) on the Main Street Corridor

• 7,873 daily riders in January 2026

RideKC Route 31 provides East-West connectivity on the 31st Street Corridor at 15 minute frequencies

• 15 minute frequencies make it the most frequent bus route in the state of Missouri

• Not the most frequent bus corridor (Prospect Avenue)

• Runs from 5 AM to 12 AM Monday-Saturday

• Runs from 5 AM to 10 PM on Sunday

• Connects southern Independence to the core of Kansas City

• 1,931 daily riders in January 2026

Route 39 provides East-West transit on the 39th Street Corridor

• Operates at 30 minute frequencies

• Runs from 5 AM to 12 AM Monday-Saturday

• Runs from 5 AM to 10 PM on Sunday

• Connects KU Medical Center and Volker / Roanoke Neighborhoods to the East Side

• Deviation to VA Medical Center

• 584 daily riders in January 2026

Where access is provided, pedestrian and sidewalk infrastructure is well designed

• Southwest Trafficway has few points to cross the roadway

• Certain streets have unsafe crossings

• Road diets to Main Street and Broadway Boulevard have improved walking conditions along the respective corridors

• New tree plantings in the neighborhood will provide shade and clean air

• Short, small blocks improve walkability

The Viaduct: Bi-State Mobility Hub

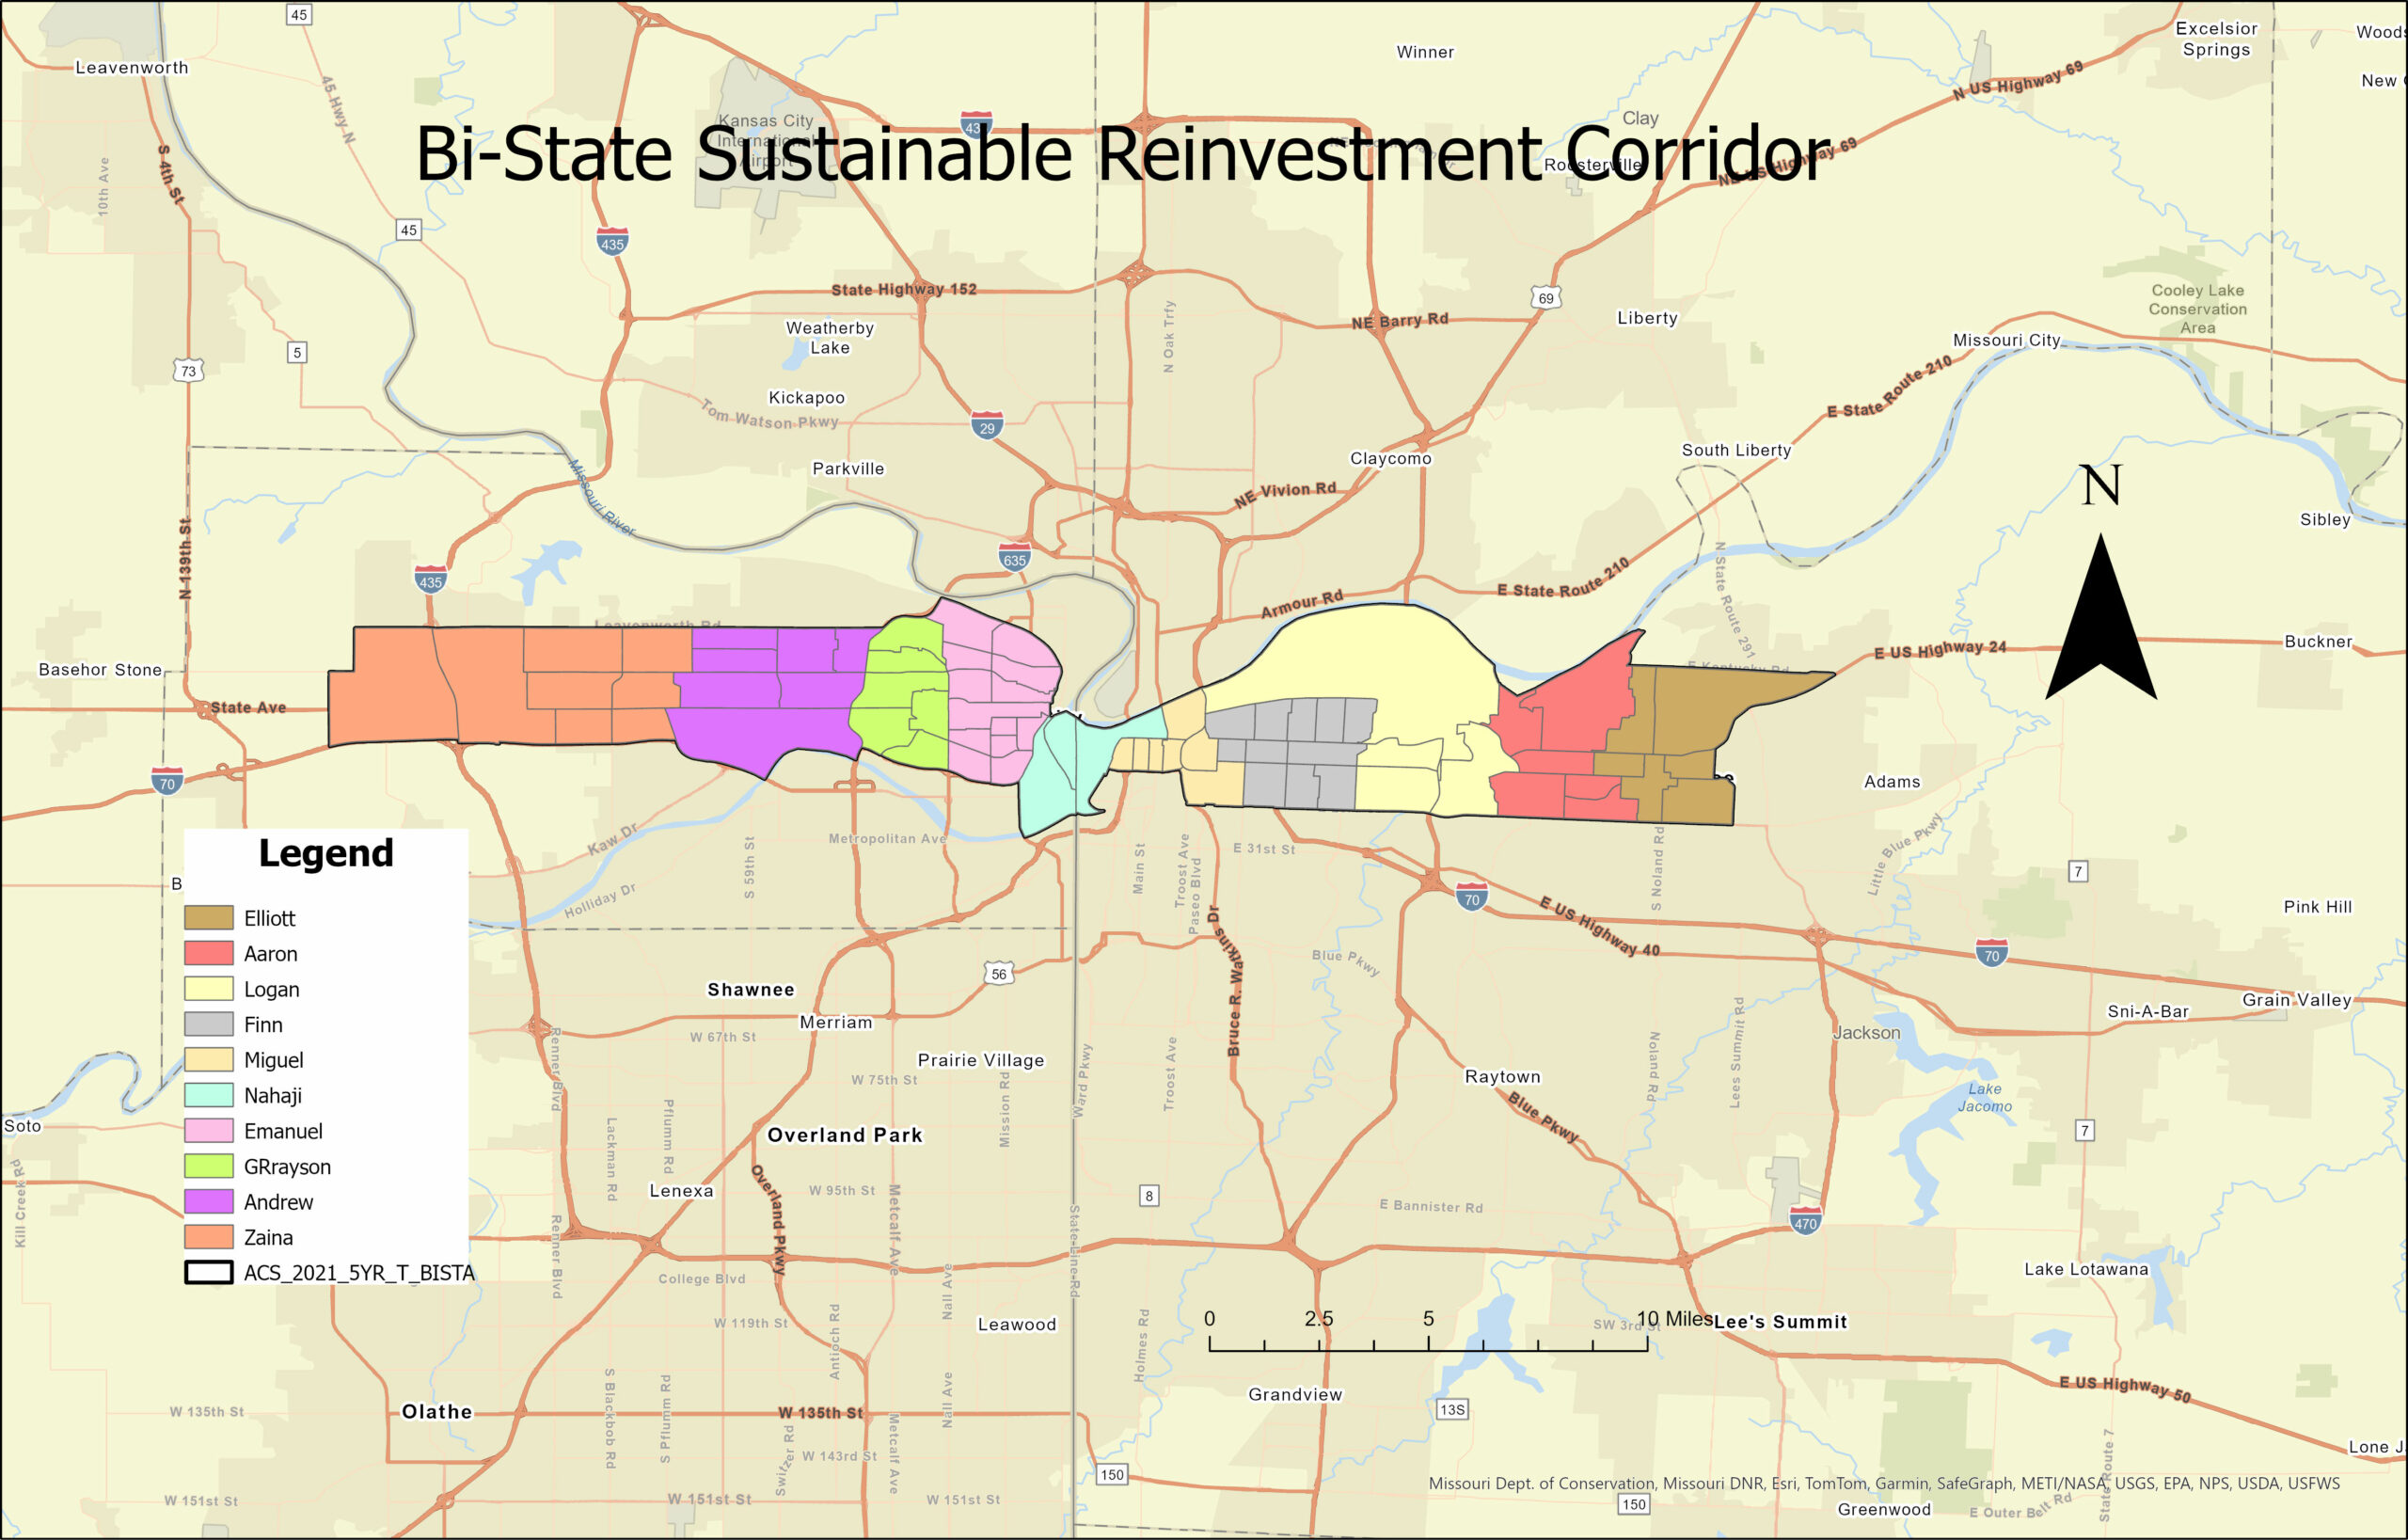
For our final 312 studio project we were tasked to create a mobility hub along the Bi State Sustainable reinvestment corridor. Each studio was assigned a intersection from East in Independence Square to Village West in KCK.
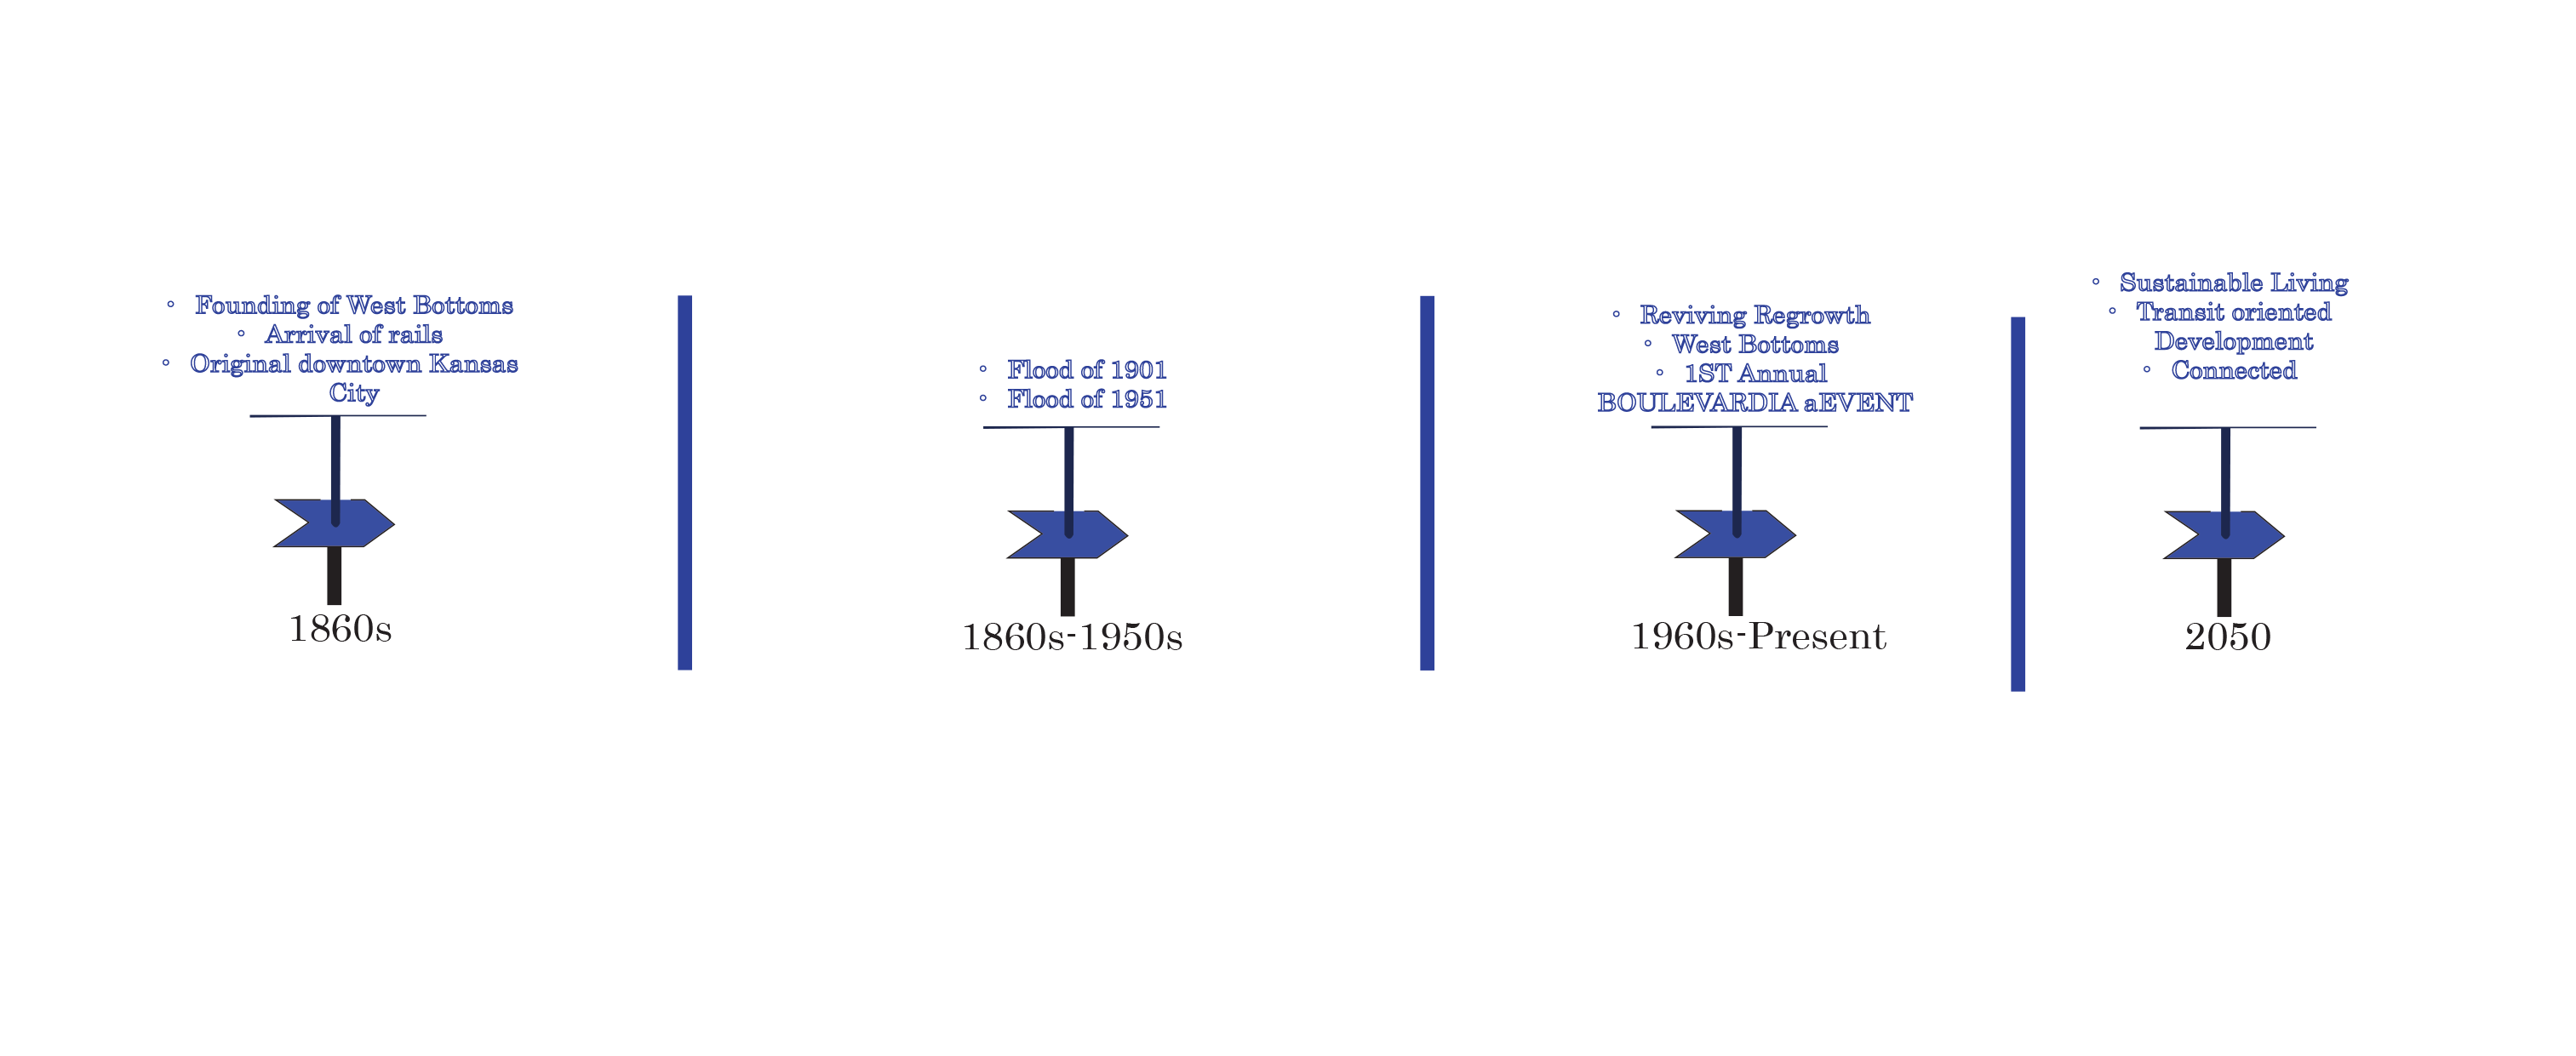
Figure 1. History and Background

The West Bottoms has long been an industrial land use after the flooding in 1901 and 1951. All forms of residential land use were brought to what is now downtown Kansas City. The area has begun its regrowth and has become a potential residential development district again.
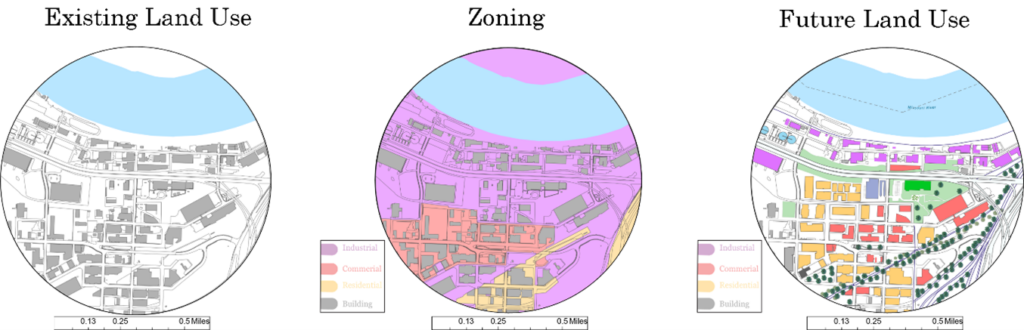
Figure 2. Existing land use, zoning and future land use.

Figure. 2 shows the existing land use, zoning, and future land use in the half-mile radius. The current area consists of a single apartment flat a few commercial and use and mostly industrial use. The future land use will consist of new residential and renovated ones over five. A few industrial uses will be kept on the north side of I-70. With new commercial development in the middle of the area.
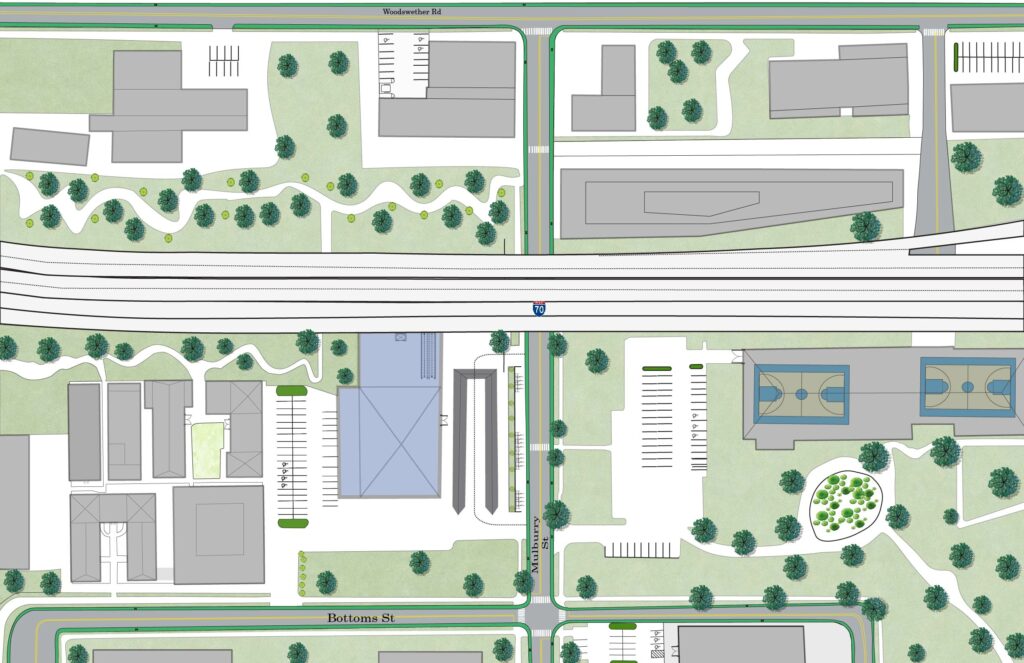
Figure 3. Mobility Hub

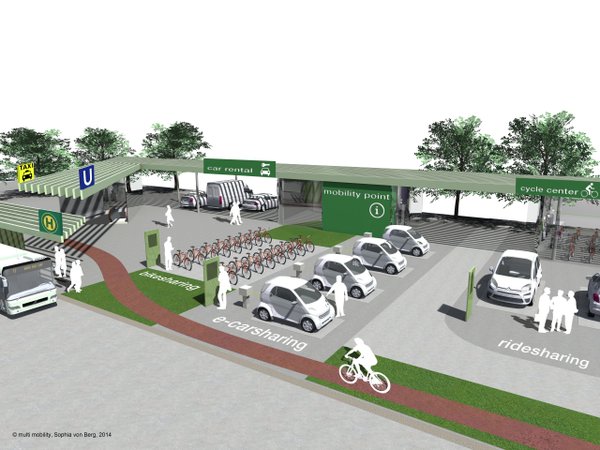
The mobility hub is located at Mulberry and Highway 70.  In the blue is the transit center, with a pavilion that covers enough for buses. The design has bike lanes, sidewalks, trails, and improved crossing. Ample parking spaces for residents and visitors.
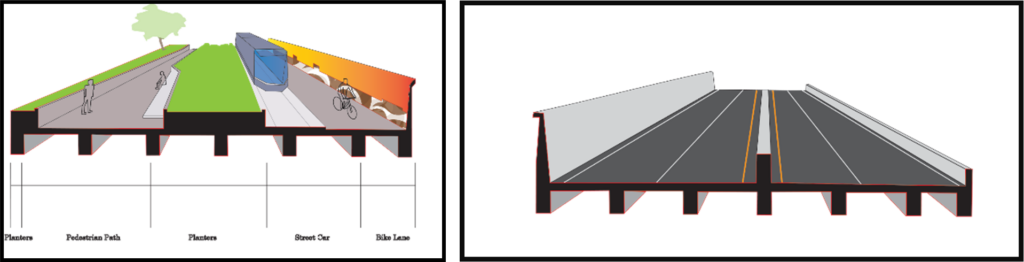
Figure 3. Highway 70 Redesigned Section

The obstruction disconnecting the KCK, and downtown Kansas City Missouri is the 7-lane  I-70. It currently only carries high-speed vehicular traffic. Considering that, inclusive transportation can not only connect the bi-state but also improve the environment. The 7-lane highway will be turned into 4-lane vehicles with reminding lines going to streetcar, planter, pedestrian path, and bike lane.
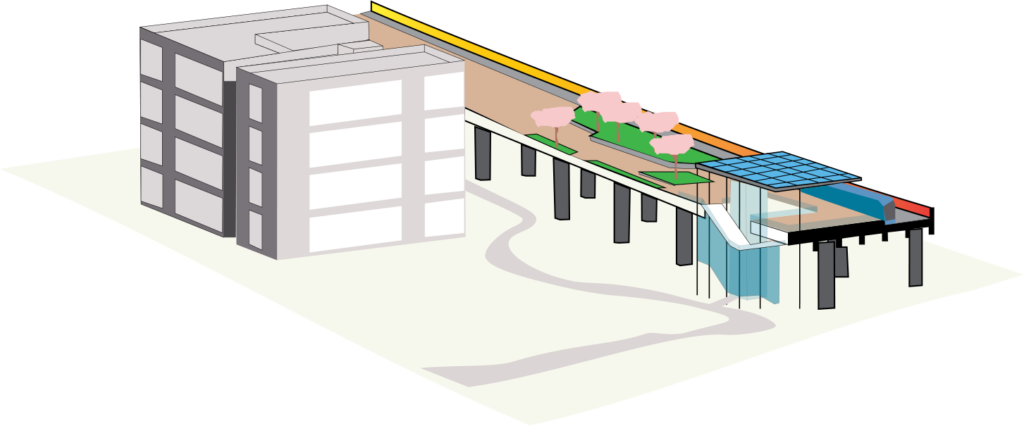
Figure 4. The Street Car Stop

The streetcar would direct connection to the ground and the apartments, with ample green space and pedestrian path.
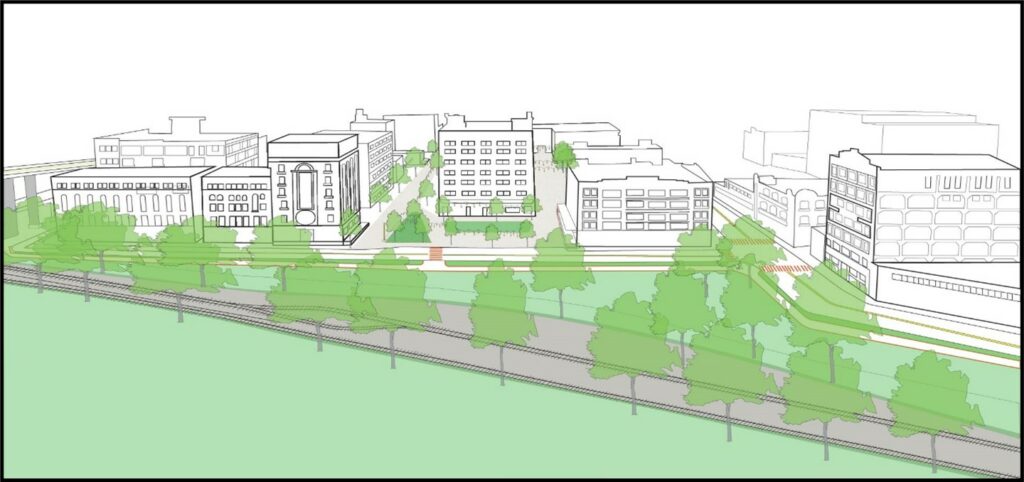
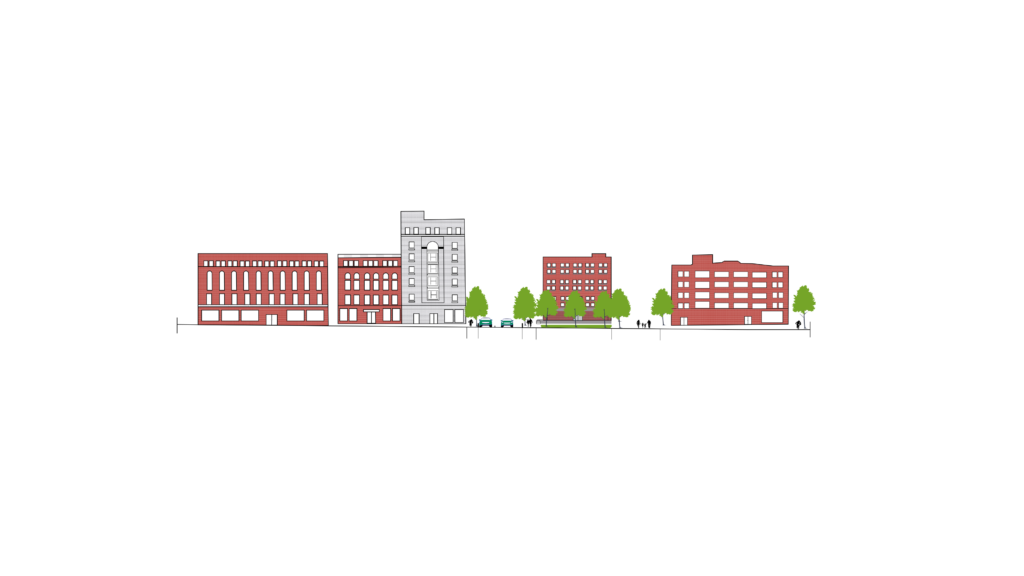
Figure 5. Redevelopment District

Redevelopment district

Figure 6. Elevation of the Redevelopment District

West Bottom has ample connections from both sides of the states. It has highway 70 and highway 670 going through it. Its also got 12th Street, and Centra Bridge Ave that connect to downtown, City Market, redevelopment district, and industrial district.
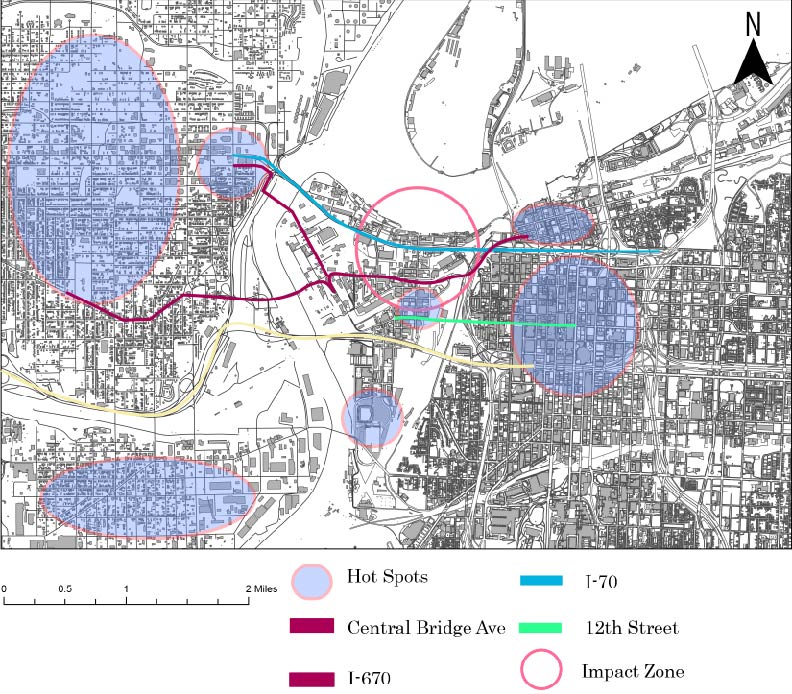
Figure 7. Connections

KCATA has multiply routes in the West Bottom. With the new BRT in the West Bottoms, I extended the bus routes South of West of Bottoms to give residents other options besides driving personal vehicles.
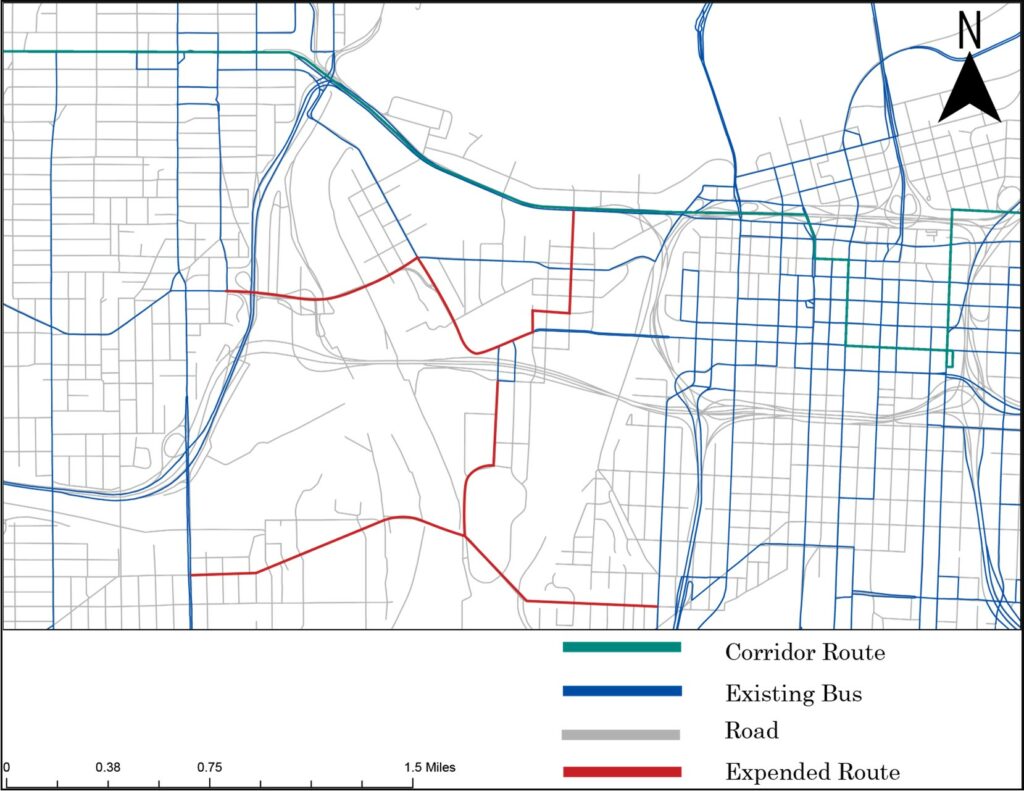
Figure 8. Existing Public Transportation and Extended Route

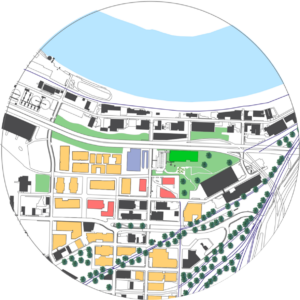
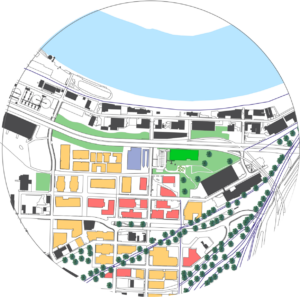
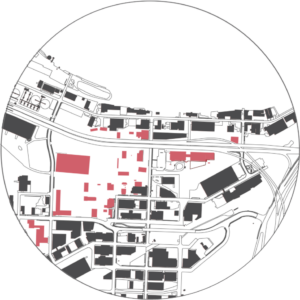
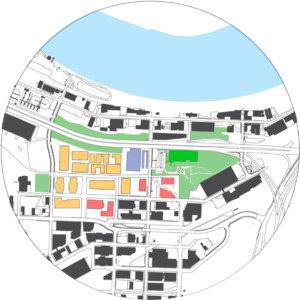
The Implementations will be done in four phase. First we will begin the demolition phase to prepare for new development, and undergo brownfields cleanup and the area to prepare for new development. Phase 2 will start the new apartments development and the mobility hub along with redevelopment of I-70. Also extending the road network in the surrounding areas. Phase 3 will pick up after phase 2. with redevelopment district a renovating the existing infrastructure and converting those to new apartments. Phase 4 will focus on commercial land use, and any additional development to make that West Bottoms is thriving.
Phase 1
Phase 2
Phase 3
Phase 4