Among one of the ways any city’s population differs noticeably is in age. Kids, teens, young adults, other adults, and seniors — they characterize a city, even affecting its built form, as they might live in different areas and need different facilities.
For the purposes of this project, we are dealing with just the area of the city within boundaries of Kansas City in 1940.
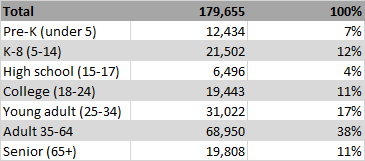
Within that area, the population breaks down this way today:
Approximately 40% of the city’s total population lives here today.
The way the Census Bureau breaks down age makes it difficult to classify age groups, or “cohorts”. The “high school” cohort I’ve created only goes up to age 17 because that’s where the Census Bureau defines the end of a group.
Still adults — “young adults” and “adults 35-64” combined — are clearly the most populous group. Now, that’s likely because they are the largest groups in terms of age — both groups combined make a 40-year span.
But the seemingly imbalanced breakdown is very telling when compared with the right data — for instance, park users by age.
Researchers from the University of Missouri — Columbia and Kansas State University undertook the Kansas City Parks and Physical Activity Project, beginning in 2008. They survey park users at four major Kansas City parks (all of which fall in the 1940 city limits), looking at demographic characteristics and at how those users used the park.
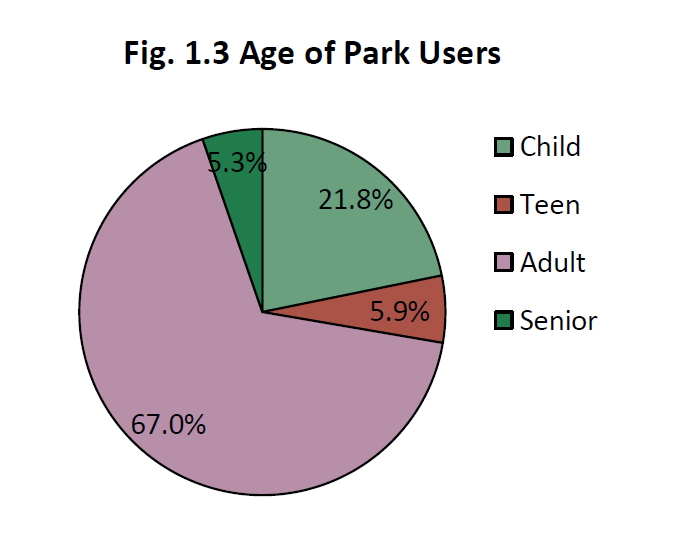
The ages of users broke down like this:
What’s interesting here is that the age breakdown of park users largely matches that of the Kansas City population in general. So in terms of age, Kansas City’s parks seem to adequately serve each group of residents. I also ran the distribution of park acreage across the city through a test in our GIS program — it came back as “random,” meaning there’s no measurable spatial clustering. (I did not include huge Swope or Riverfront parks in the test, to be clear.)
But different age groups are dispersed a little differently across the city.
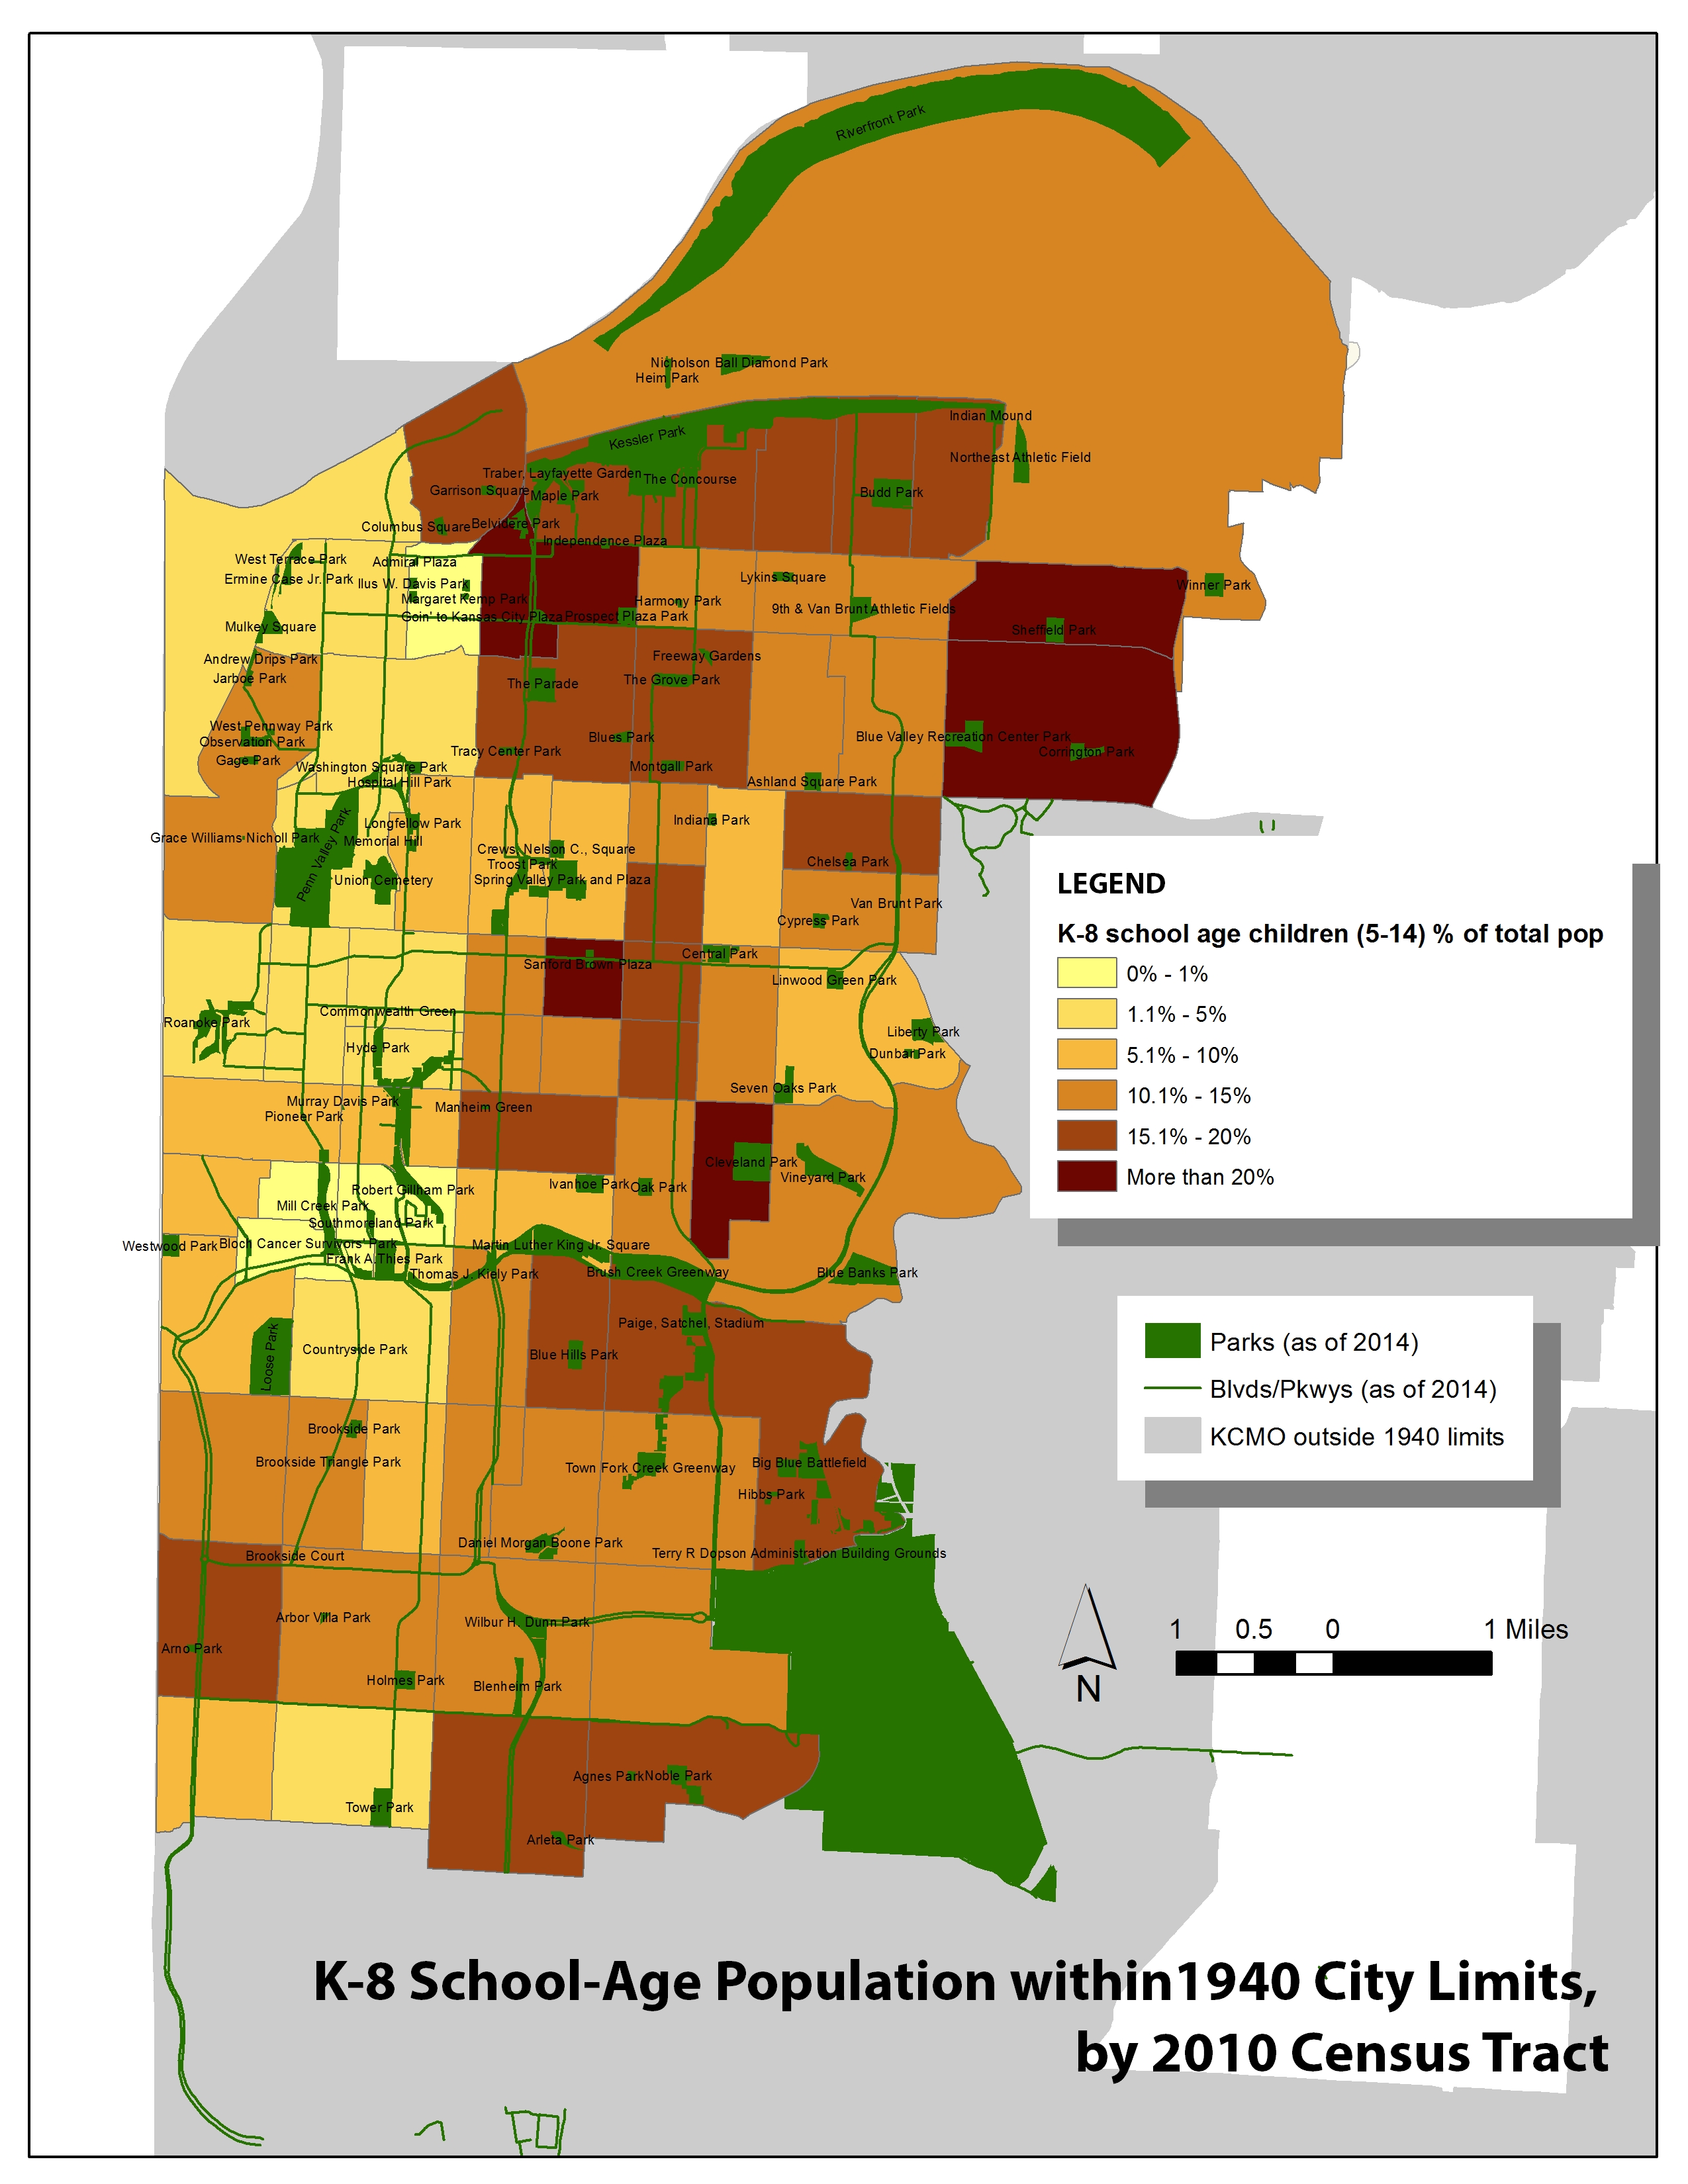
The youngest people — those who might use playgrounds — are more concentrated to the east and north of the 1940 city, as seen in the two maps below.
Many of the tracts where more children live have parks; some don’t, though. (I’m working on getting playgrounds into a map to see where they land.)
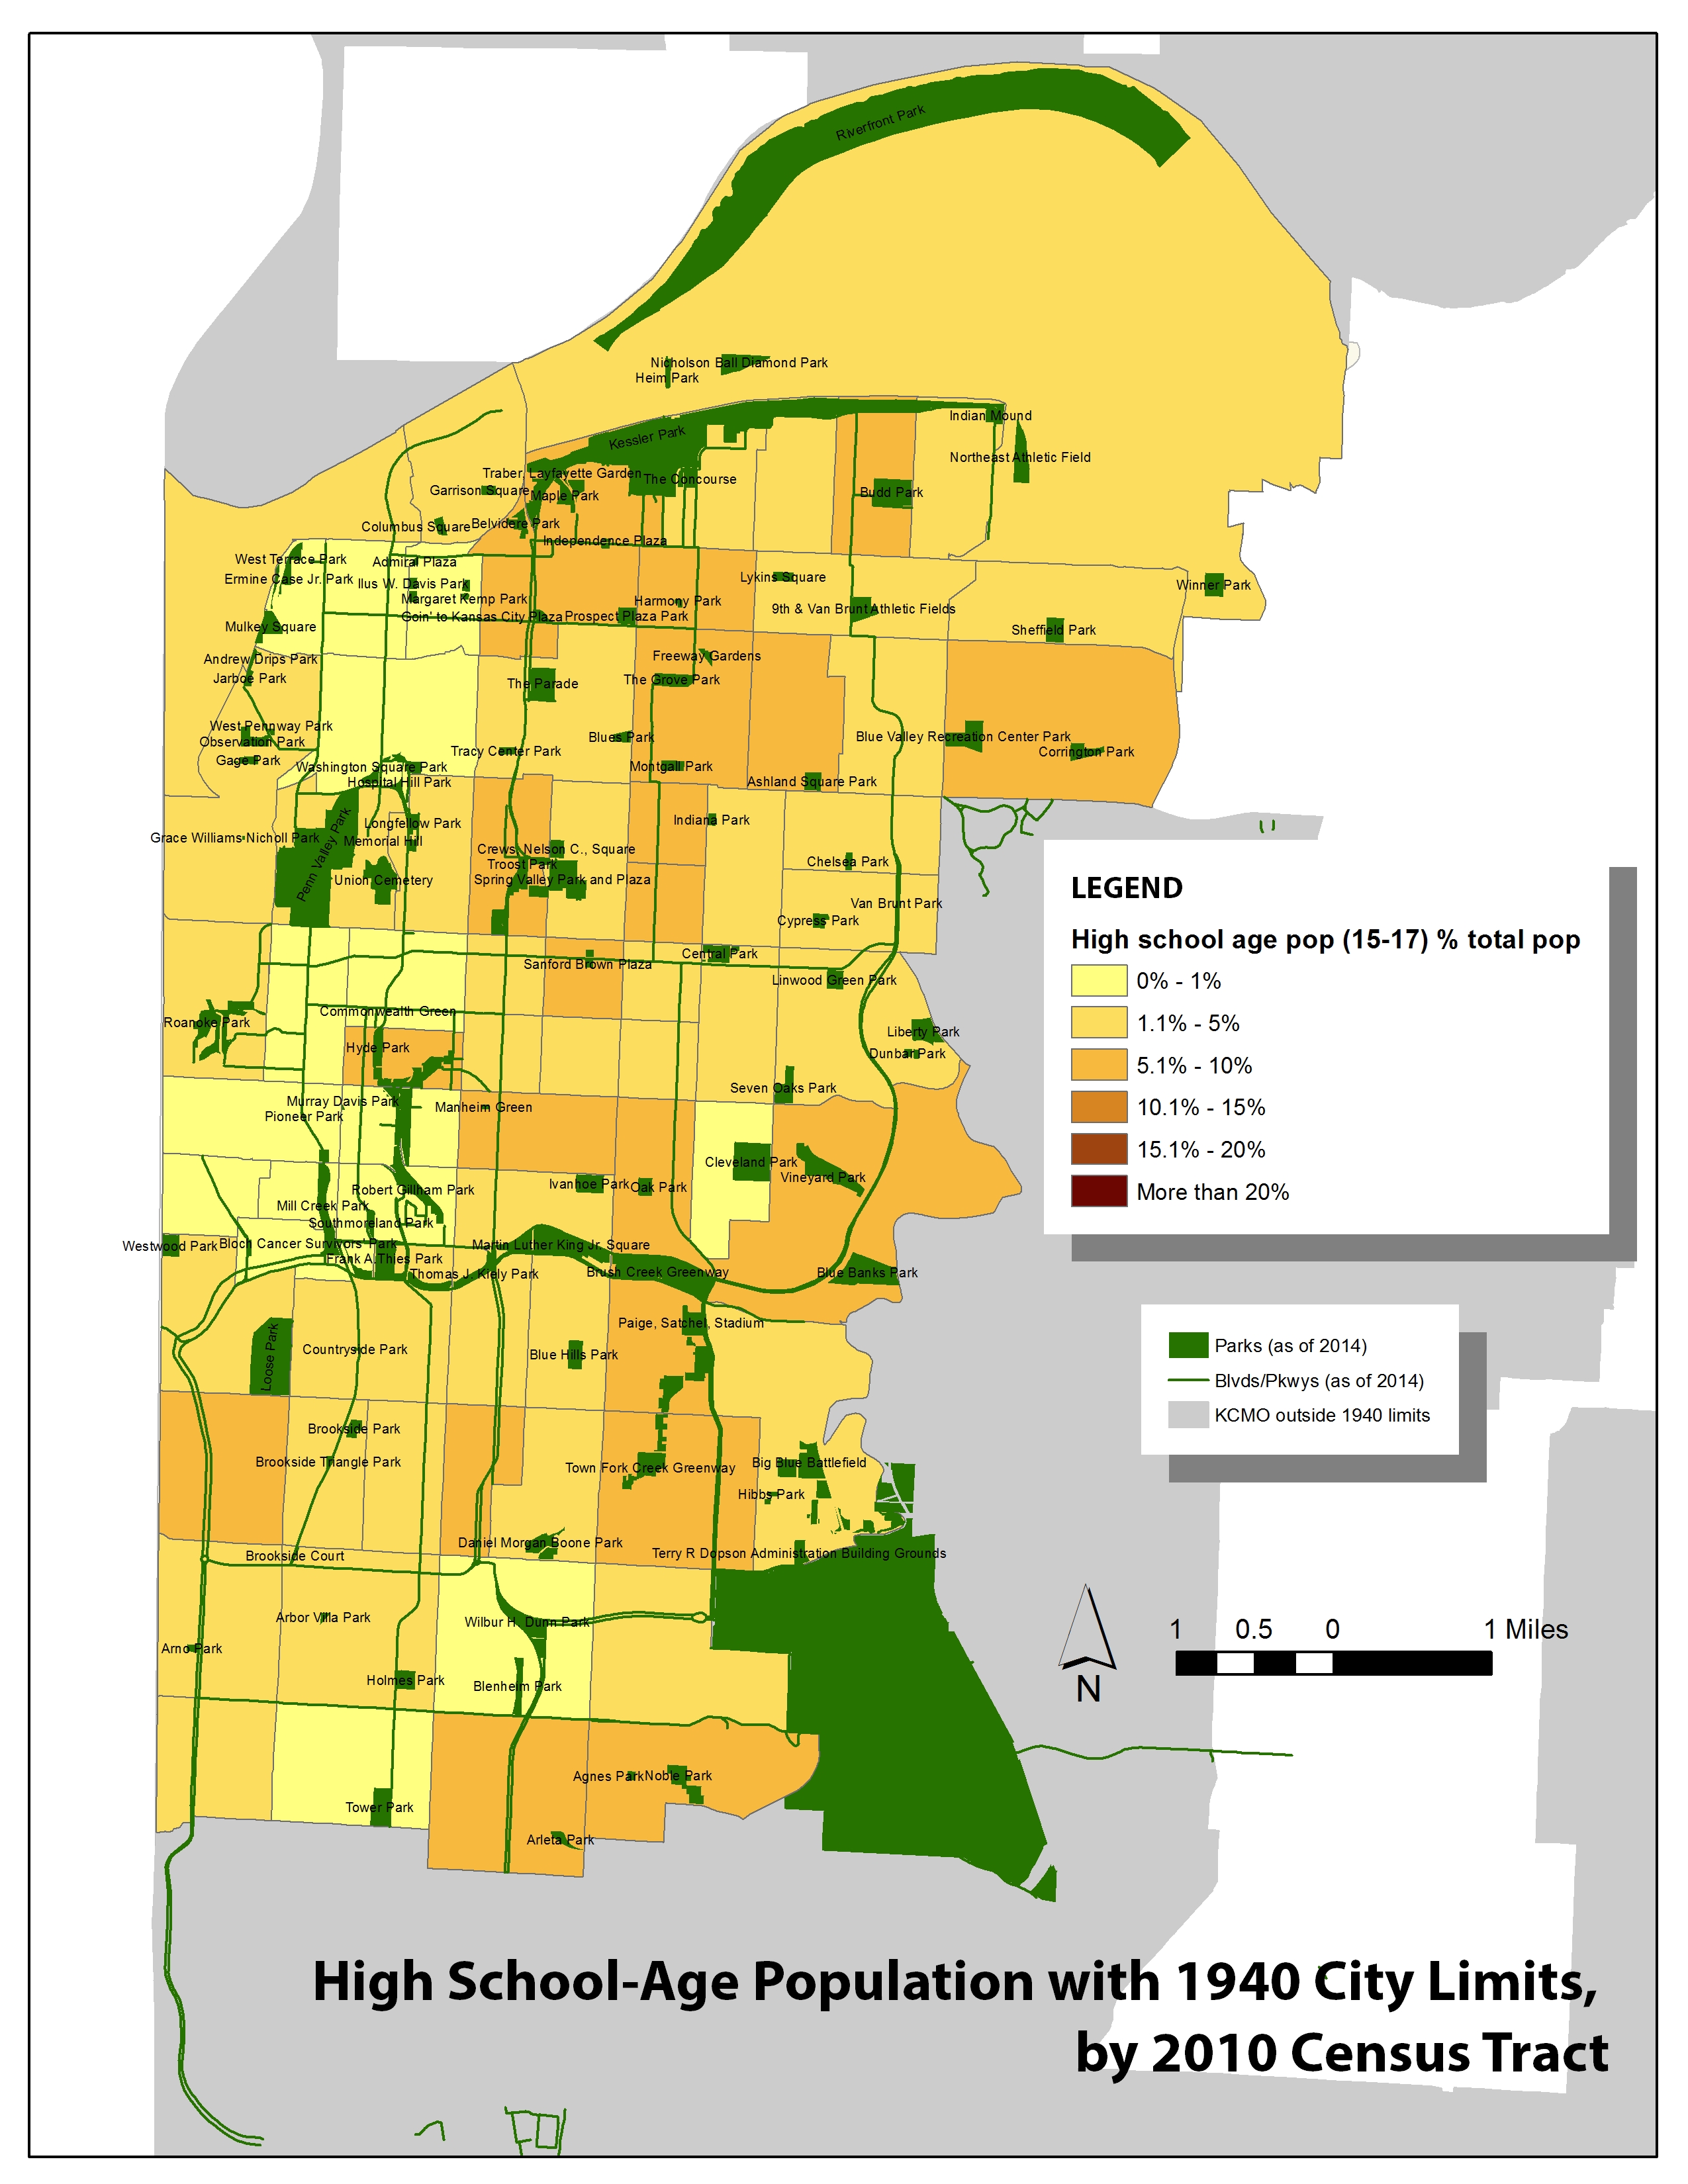
High school-aged Kansas Citians, who might use park differently, are concentrated the same — though there are simply fewer of them.
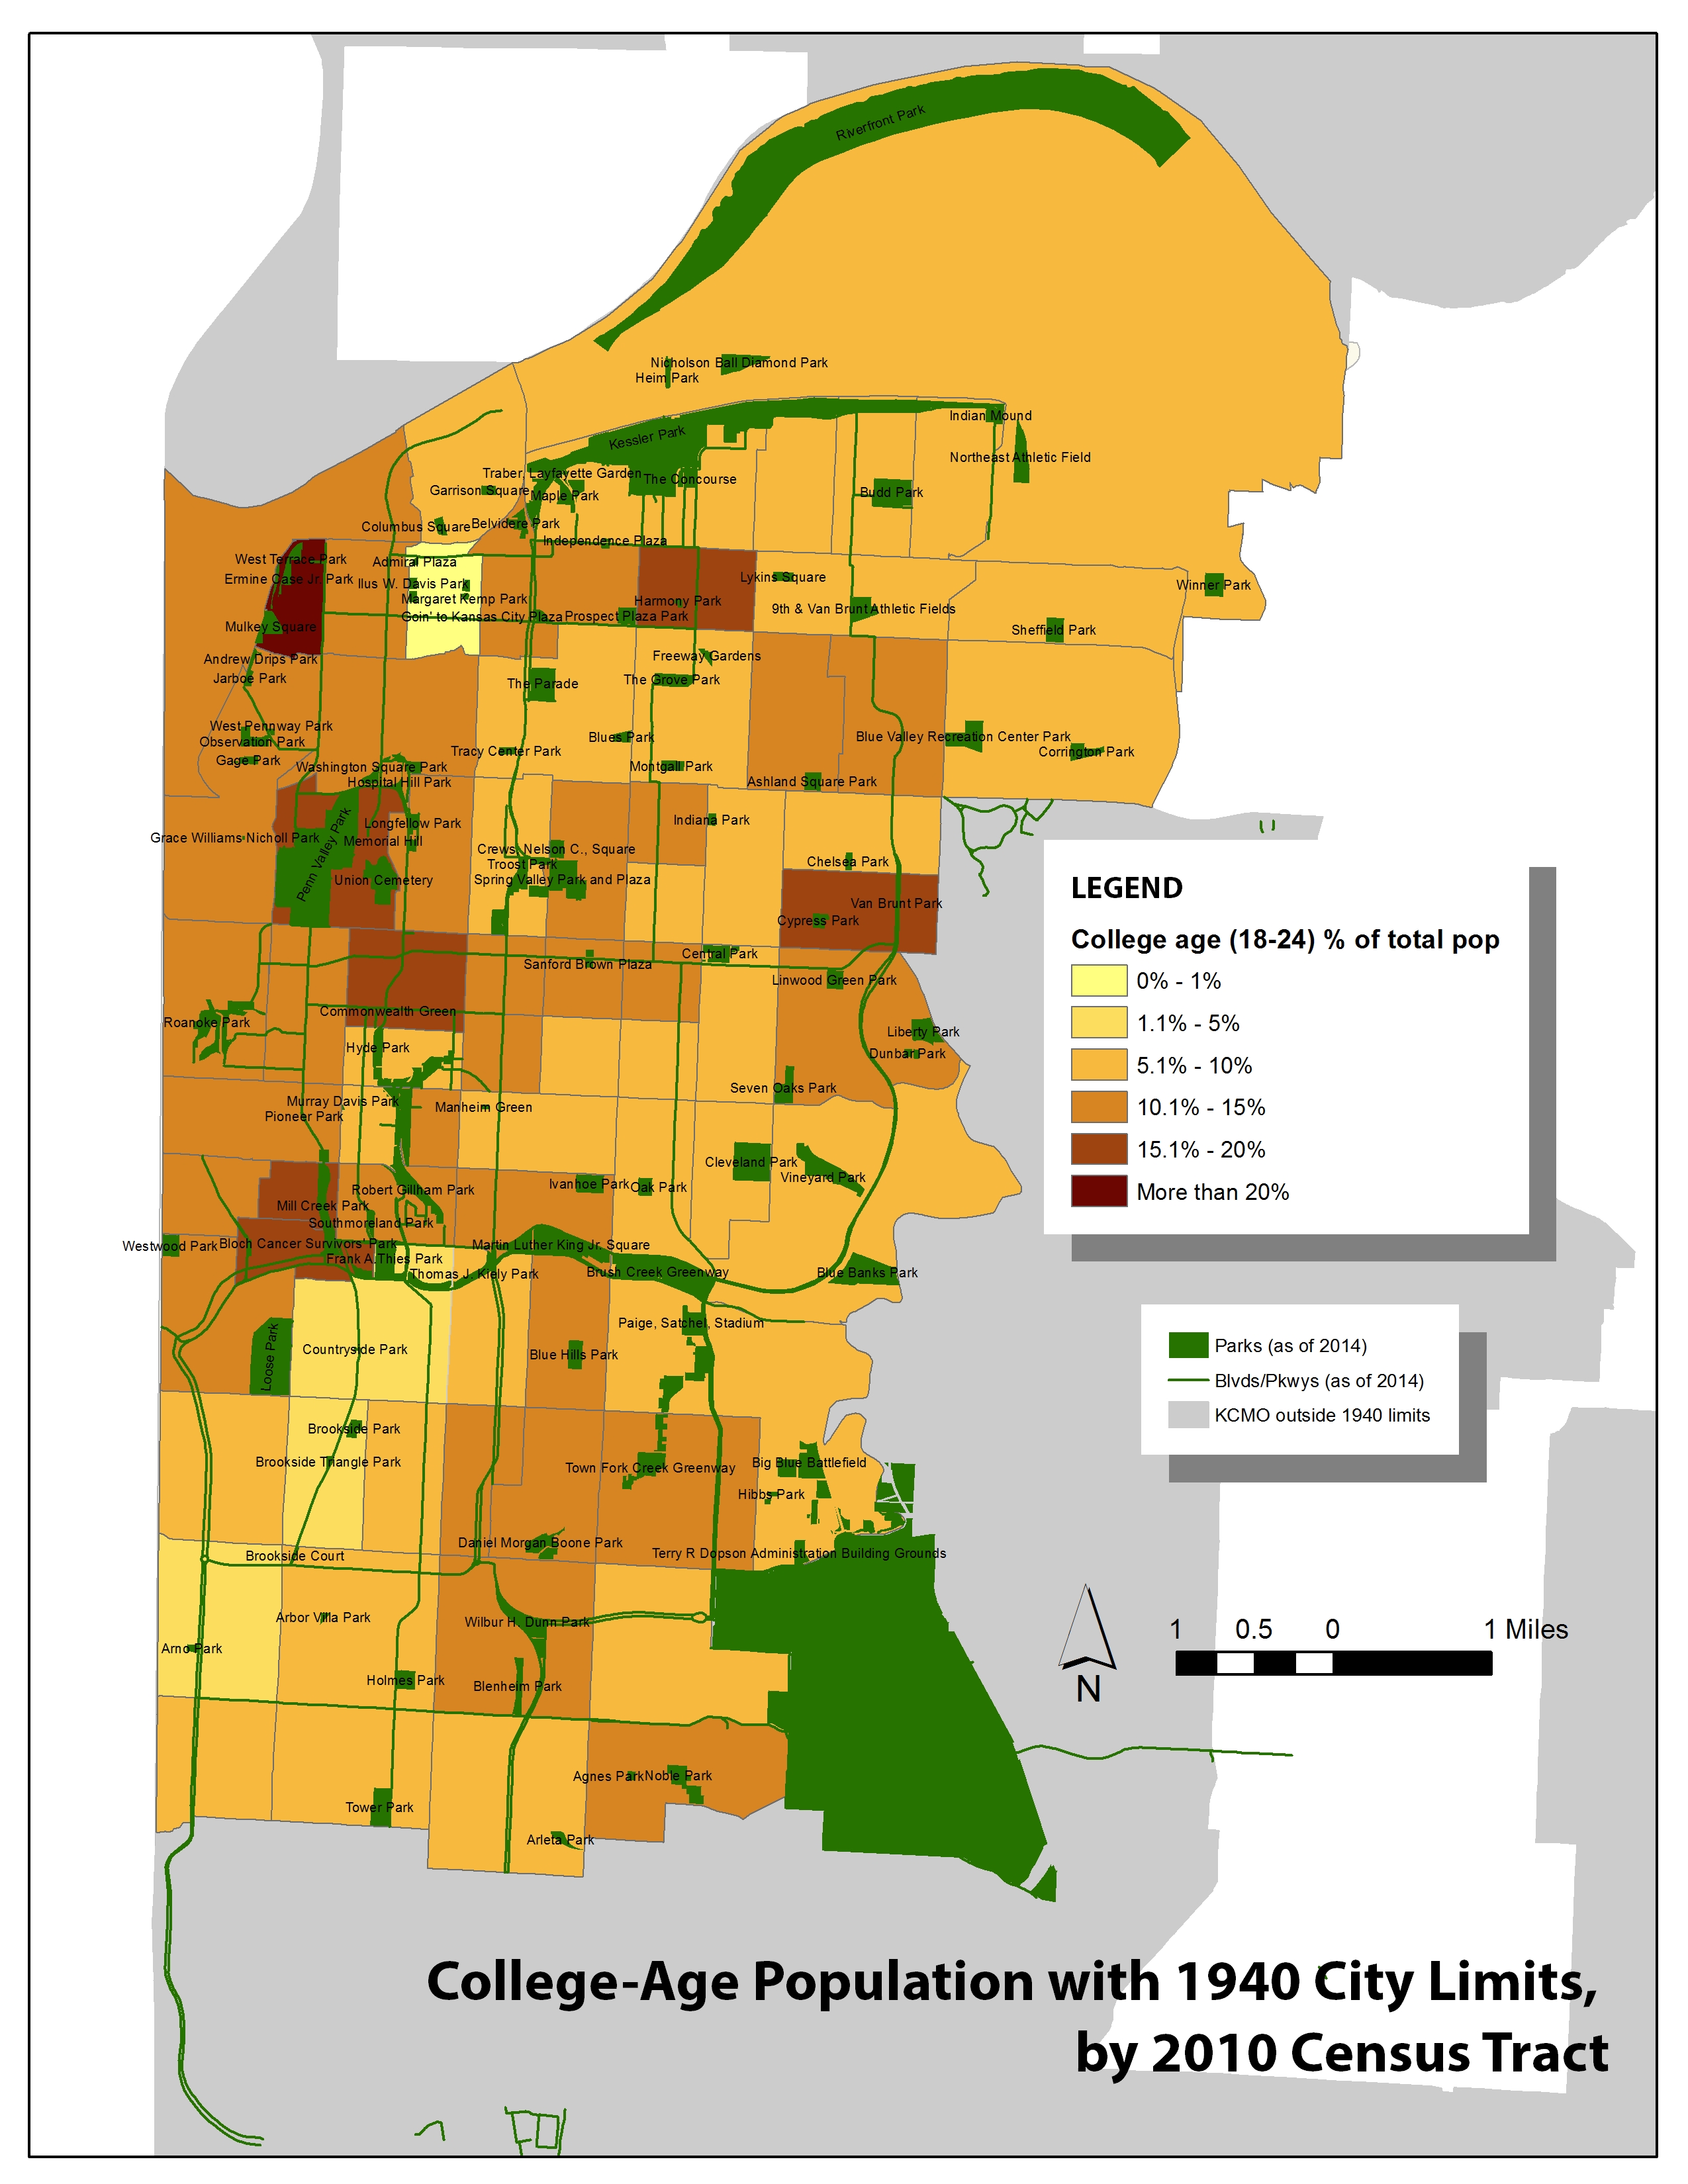
College-age residents (which is not to say college students, necessarily) are skewed more the north and west of the part of the city we’re studying. In fact, they seem clustered around some of the city’s most popular parks, like Penn Valley and Mill Creek. It’s doubtful that this age group is choosing to locate around parks specifically — but what about these popular parks affects the neighborhoods around them such that these young people want to live there?
Young adults, which I’m defining as people aged 25-34, appear more spread out. (There are more of them — it’s a bigger age group.) The most popular area for this group is the Roanoke neighborhood, which is centered around Roanoke Park. 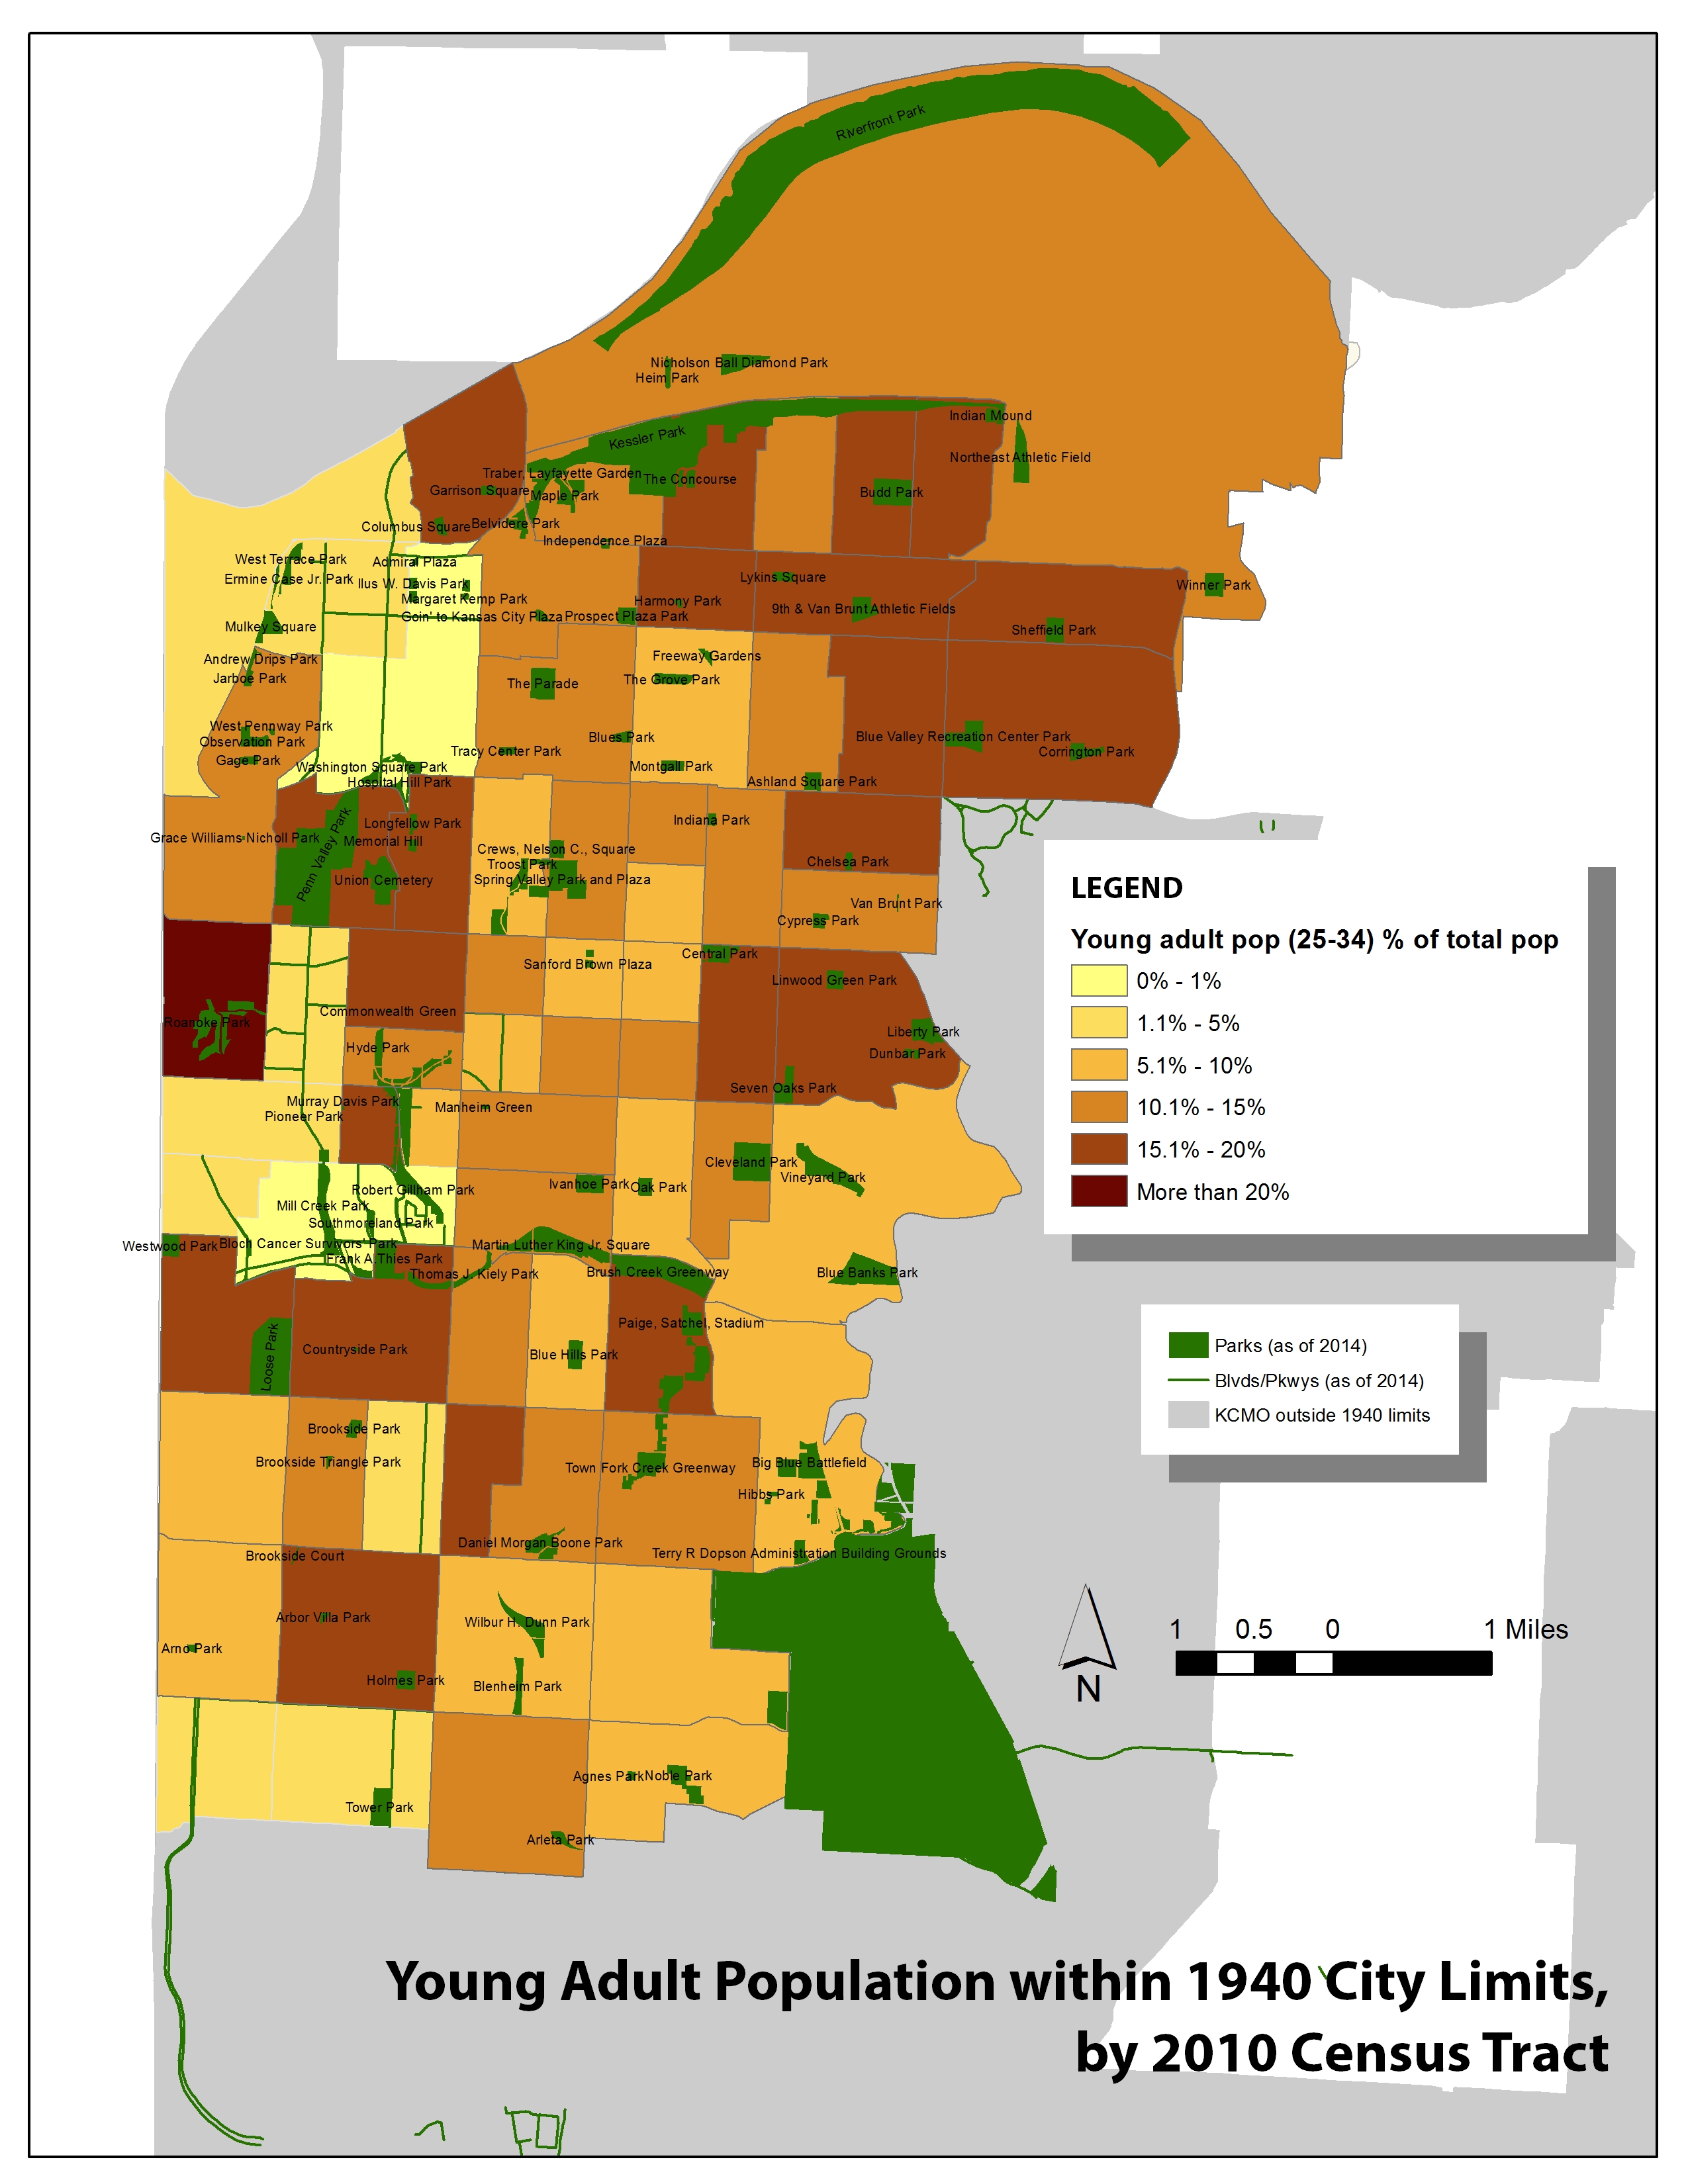
The population aged 35-64 is skewed a little towards the east, not “unserved” by parks, but far from the most iconic ones. 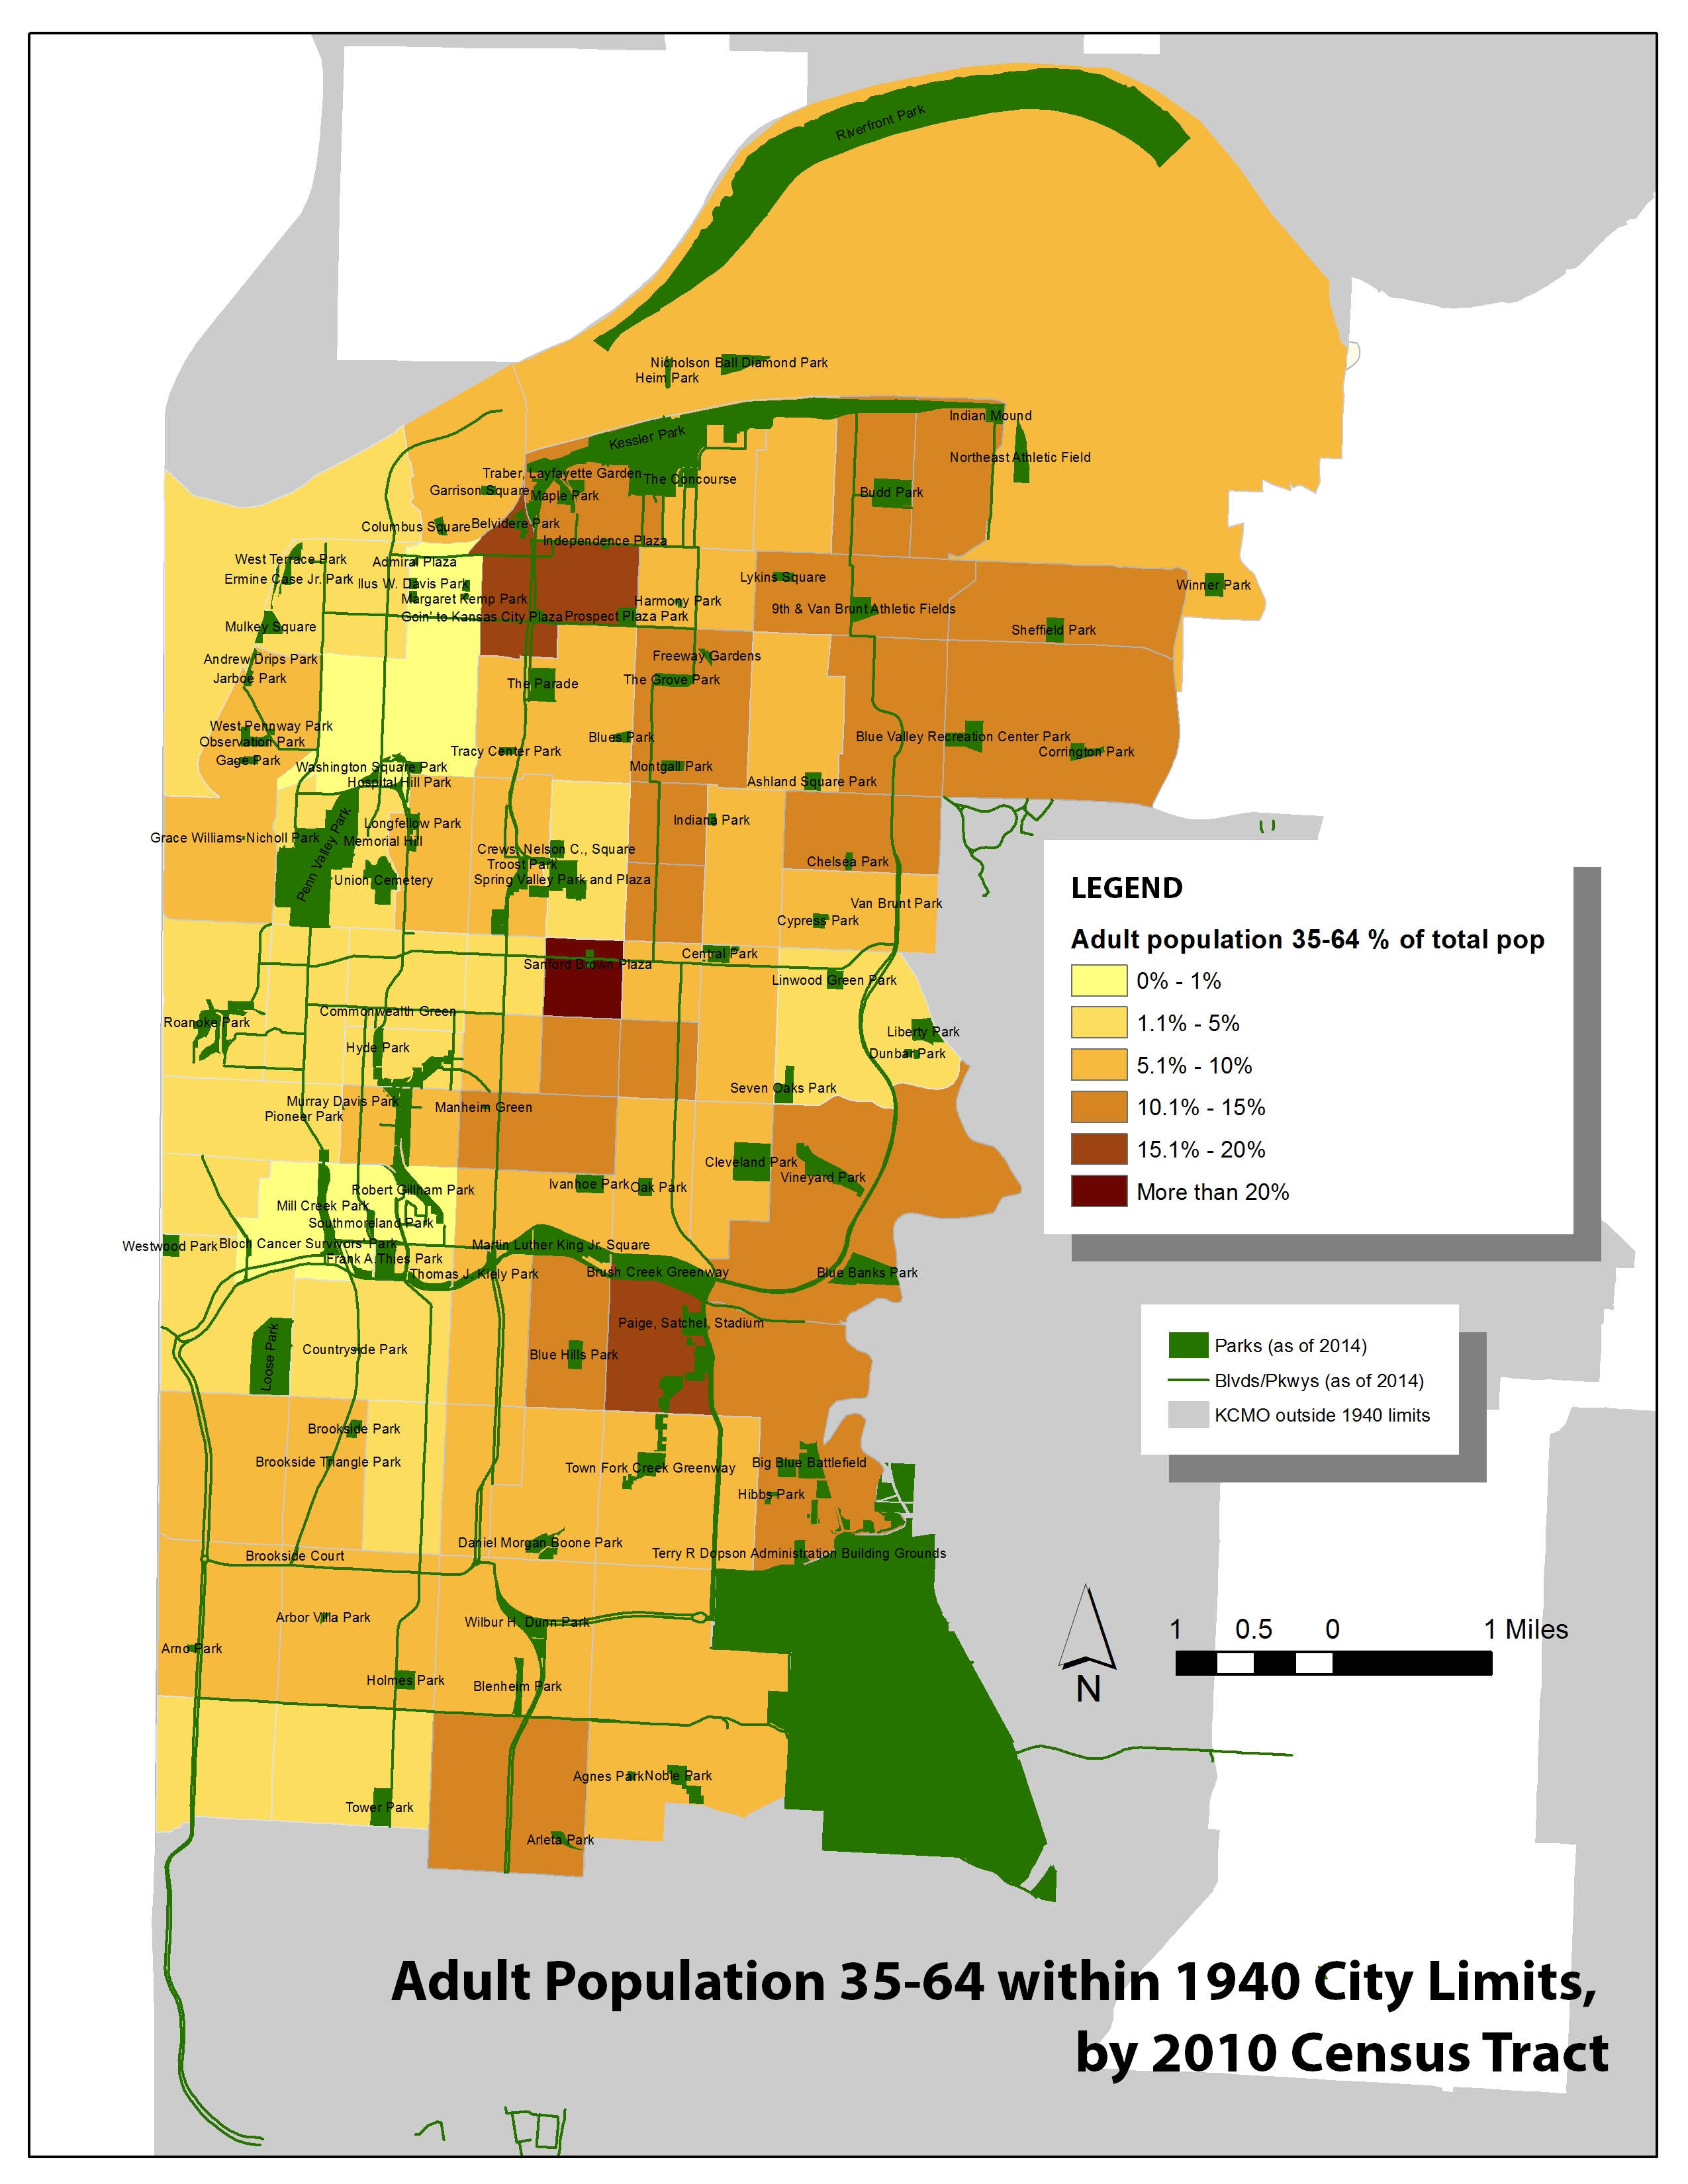
Seniors are spread out, but clustered towards the heart of the city, in areas generally served by a large park. There is also some clustering around Mill Creek and Penn Valley Park again. 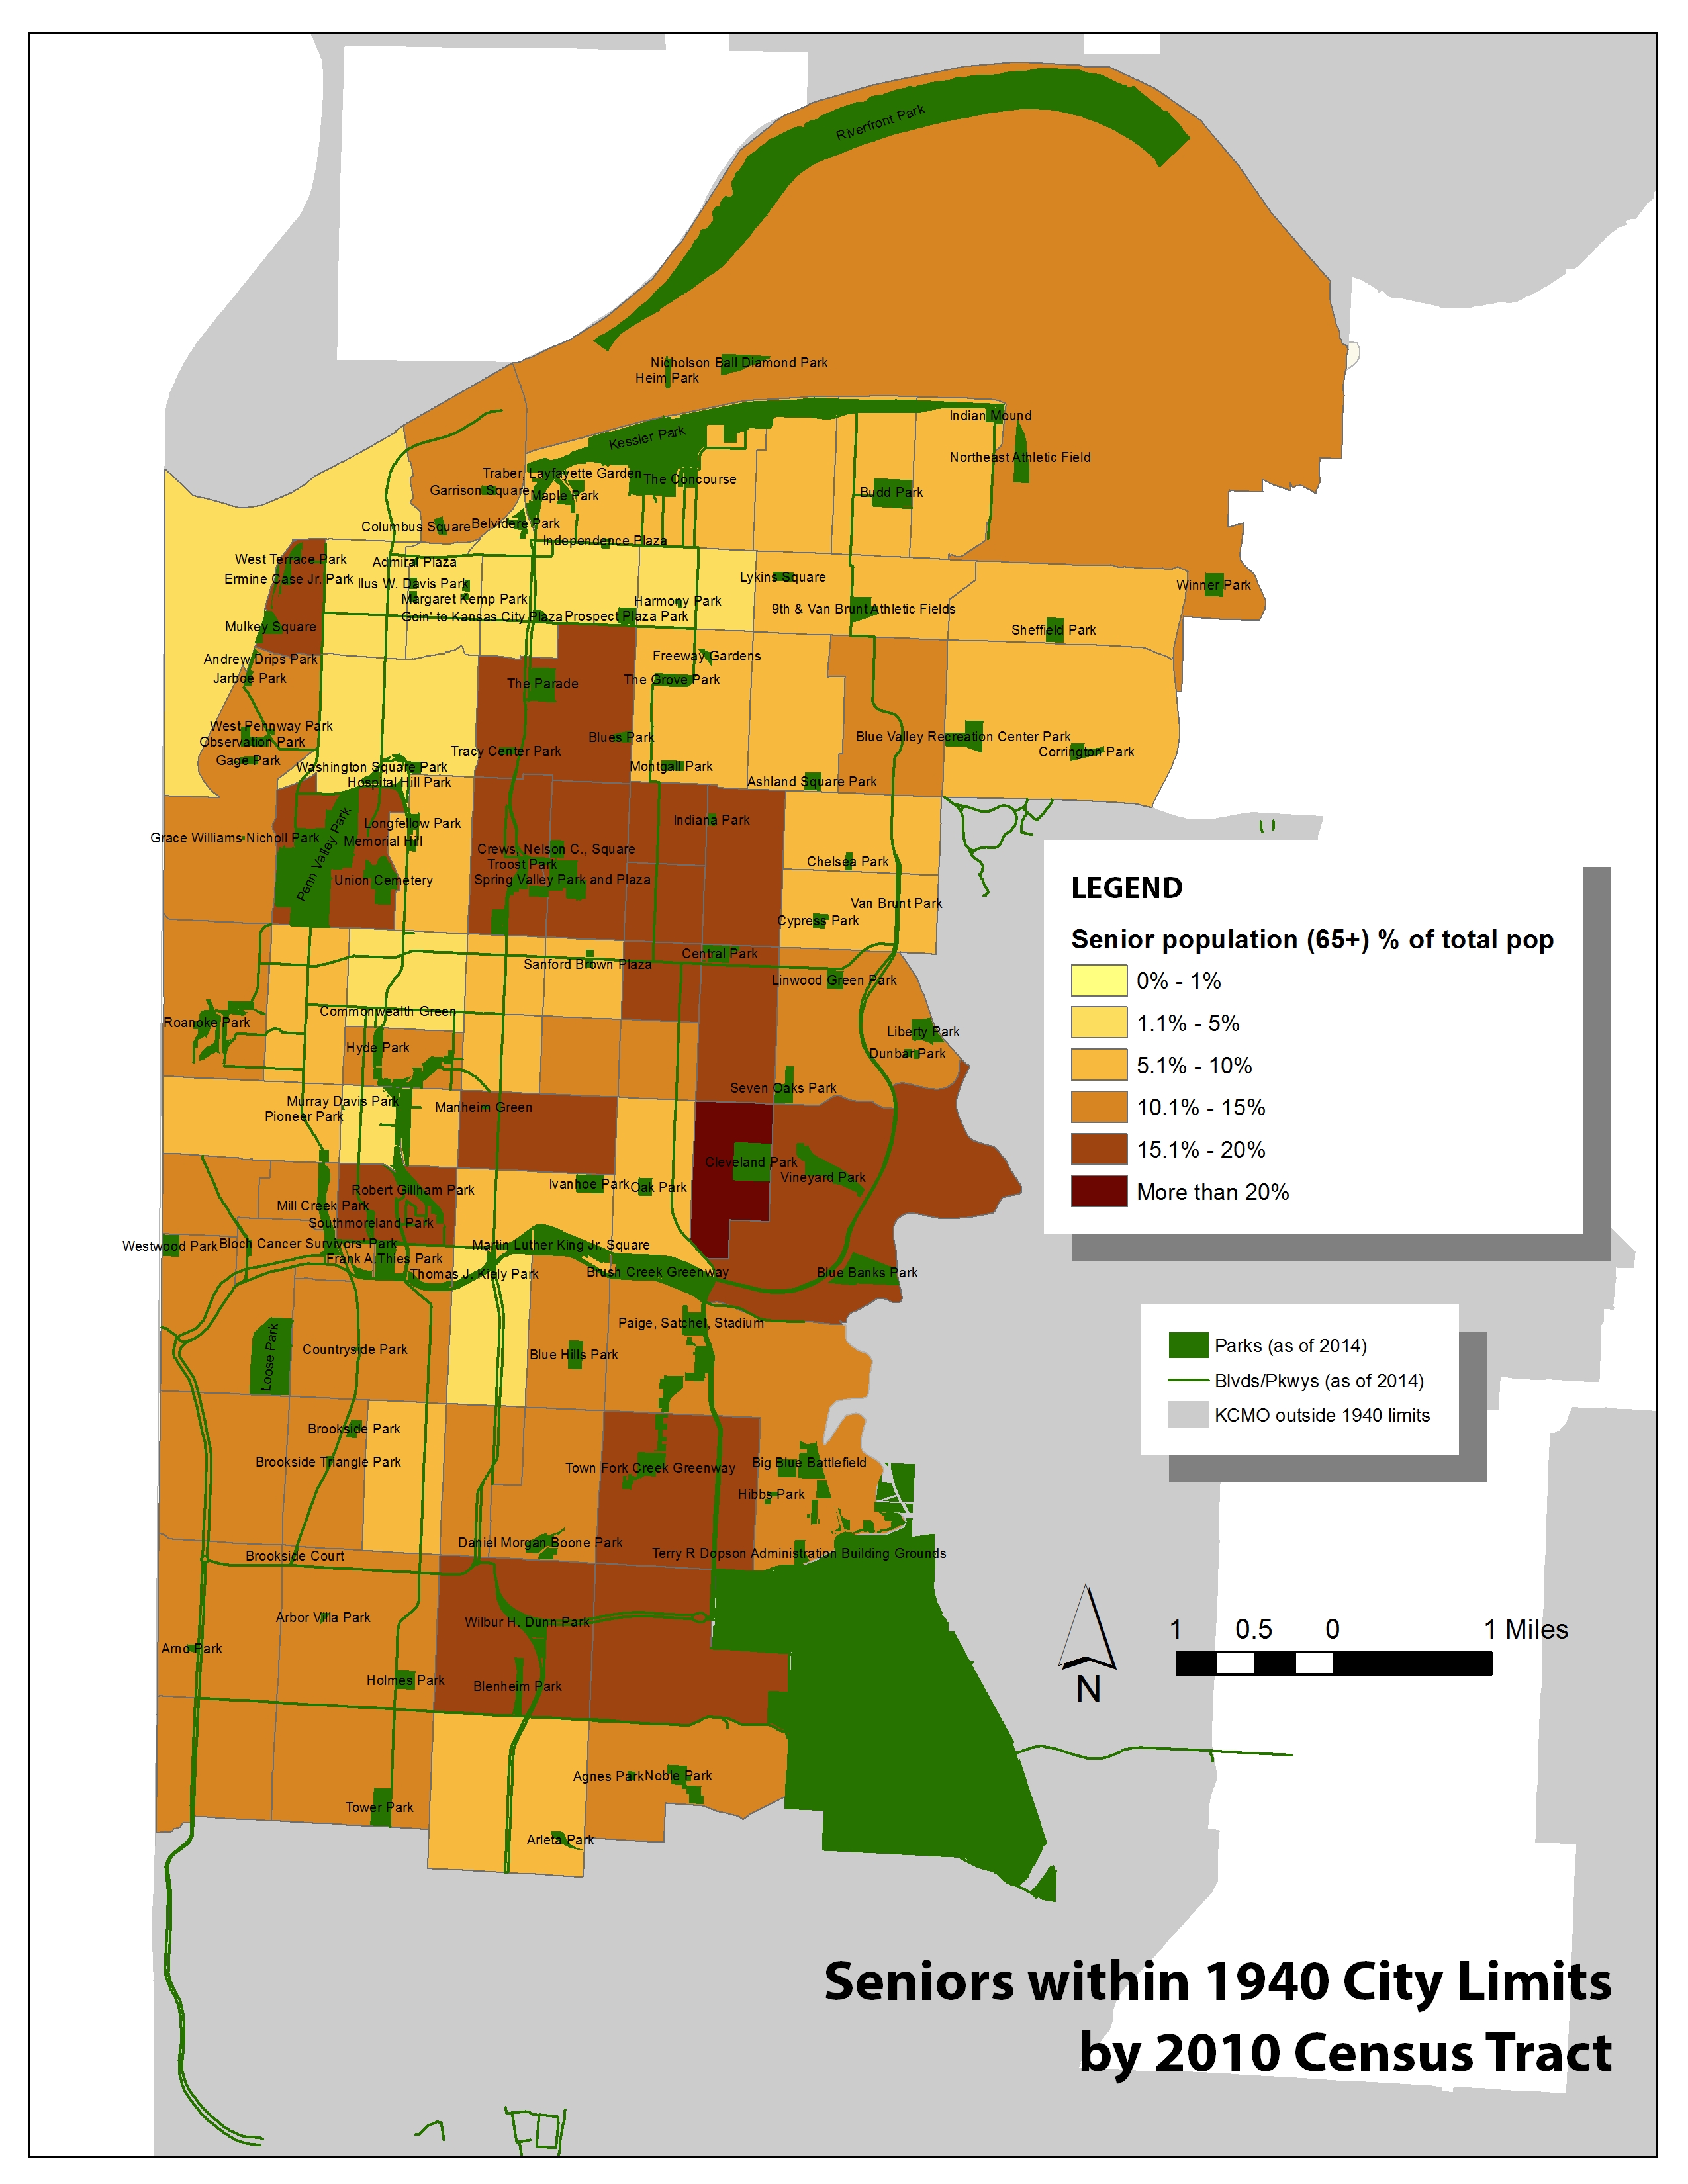
Without more data, it’s impossible to know how these clusters of different age groups feel about the parks around them. But what is clear some age groups are found are certain parks. Meanwhile, many people — many young people — appear to not have any access to a park. More work is needed, but these patterns are a start.
