Continuing our research analysis on the Parks and Boulevard system, our studio was assigned to complete our analysis and presentation work. Each student was assigned to three different groups to combat the analysis research and presentations. The analysis topics were decided on after a SWOT analysis was done over our previous work. Today, I will be covering a work example from each of my three topics. All maps will use the 1940’s Kansas City, Missouri boundaries.
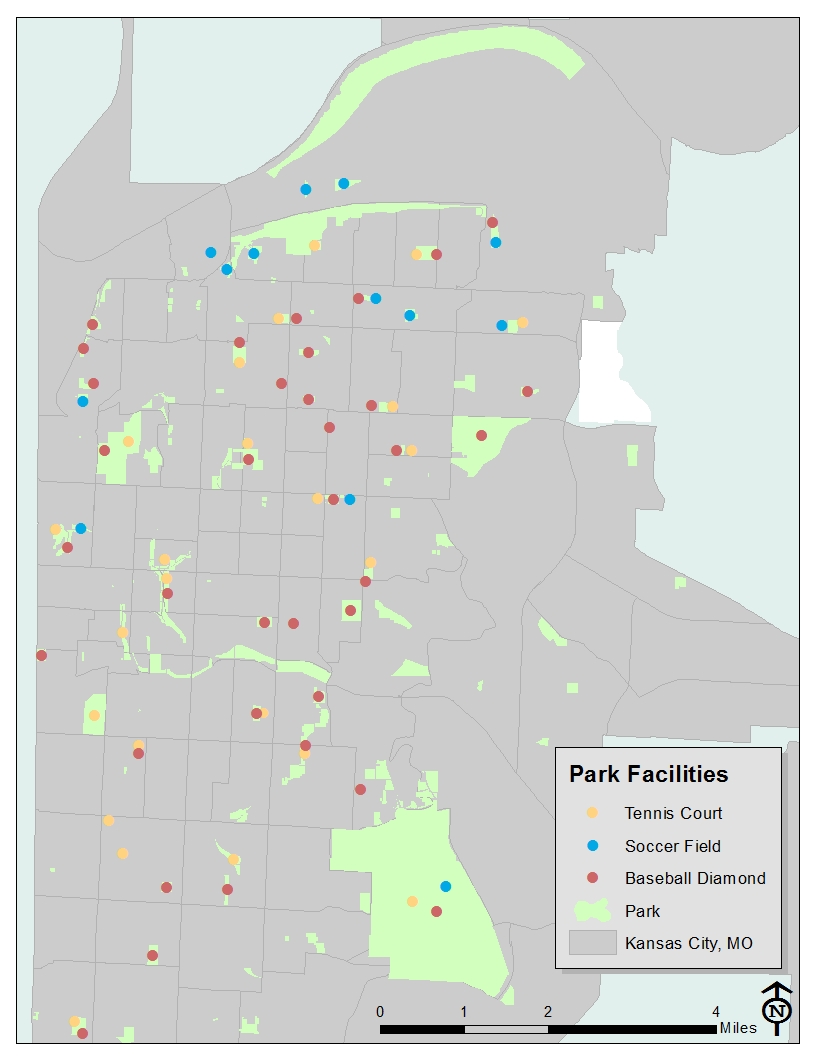
Park System Metrics
Park System Metrics covers a wide range of elements when analyzing the Parks and Boulevards system. Because there are no specific classifications with the topic, it have many different overlaps. Figure 1. (seen below), is a location map produced by my group partner and I. It identifies the locations of different park facilities such as Tennis Courts, Soccer Fields, and Baseball Diamonds within the Parks system. This map can be used when identifying areas of the city, which may lack certain facilities within the park system. Another great thing about this map is that it can be used with census data to identify inequality in locations of minority and low income areas.
Parks and Demographics
Demographic analysis in most cases, can be the most important tool to when studying a geographical location. Figure 2. (shown below) is a map using census block level data to show areas with the majority of residents being Hispanic or Latino. This map can be used for many things, such as identifying inequality in the total number of park acreage within the majority Hispanic neighborhoods, or to identify areas to locate specific facilities based on residential culture.

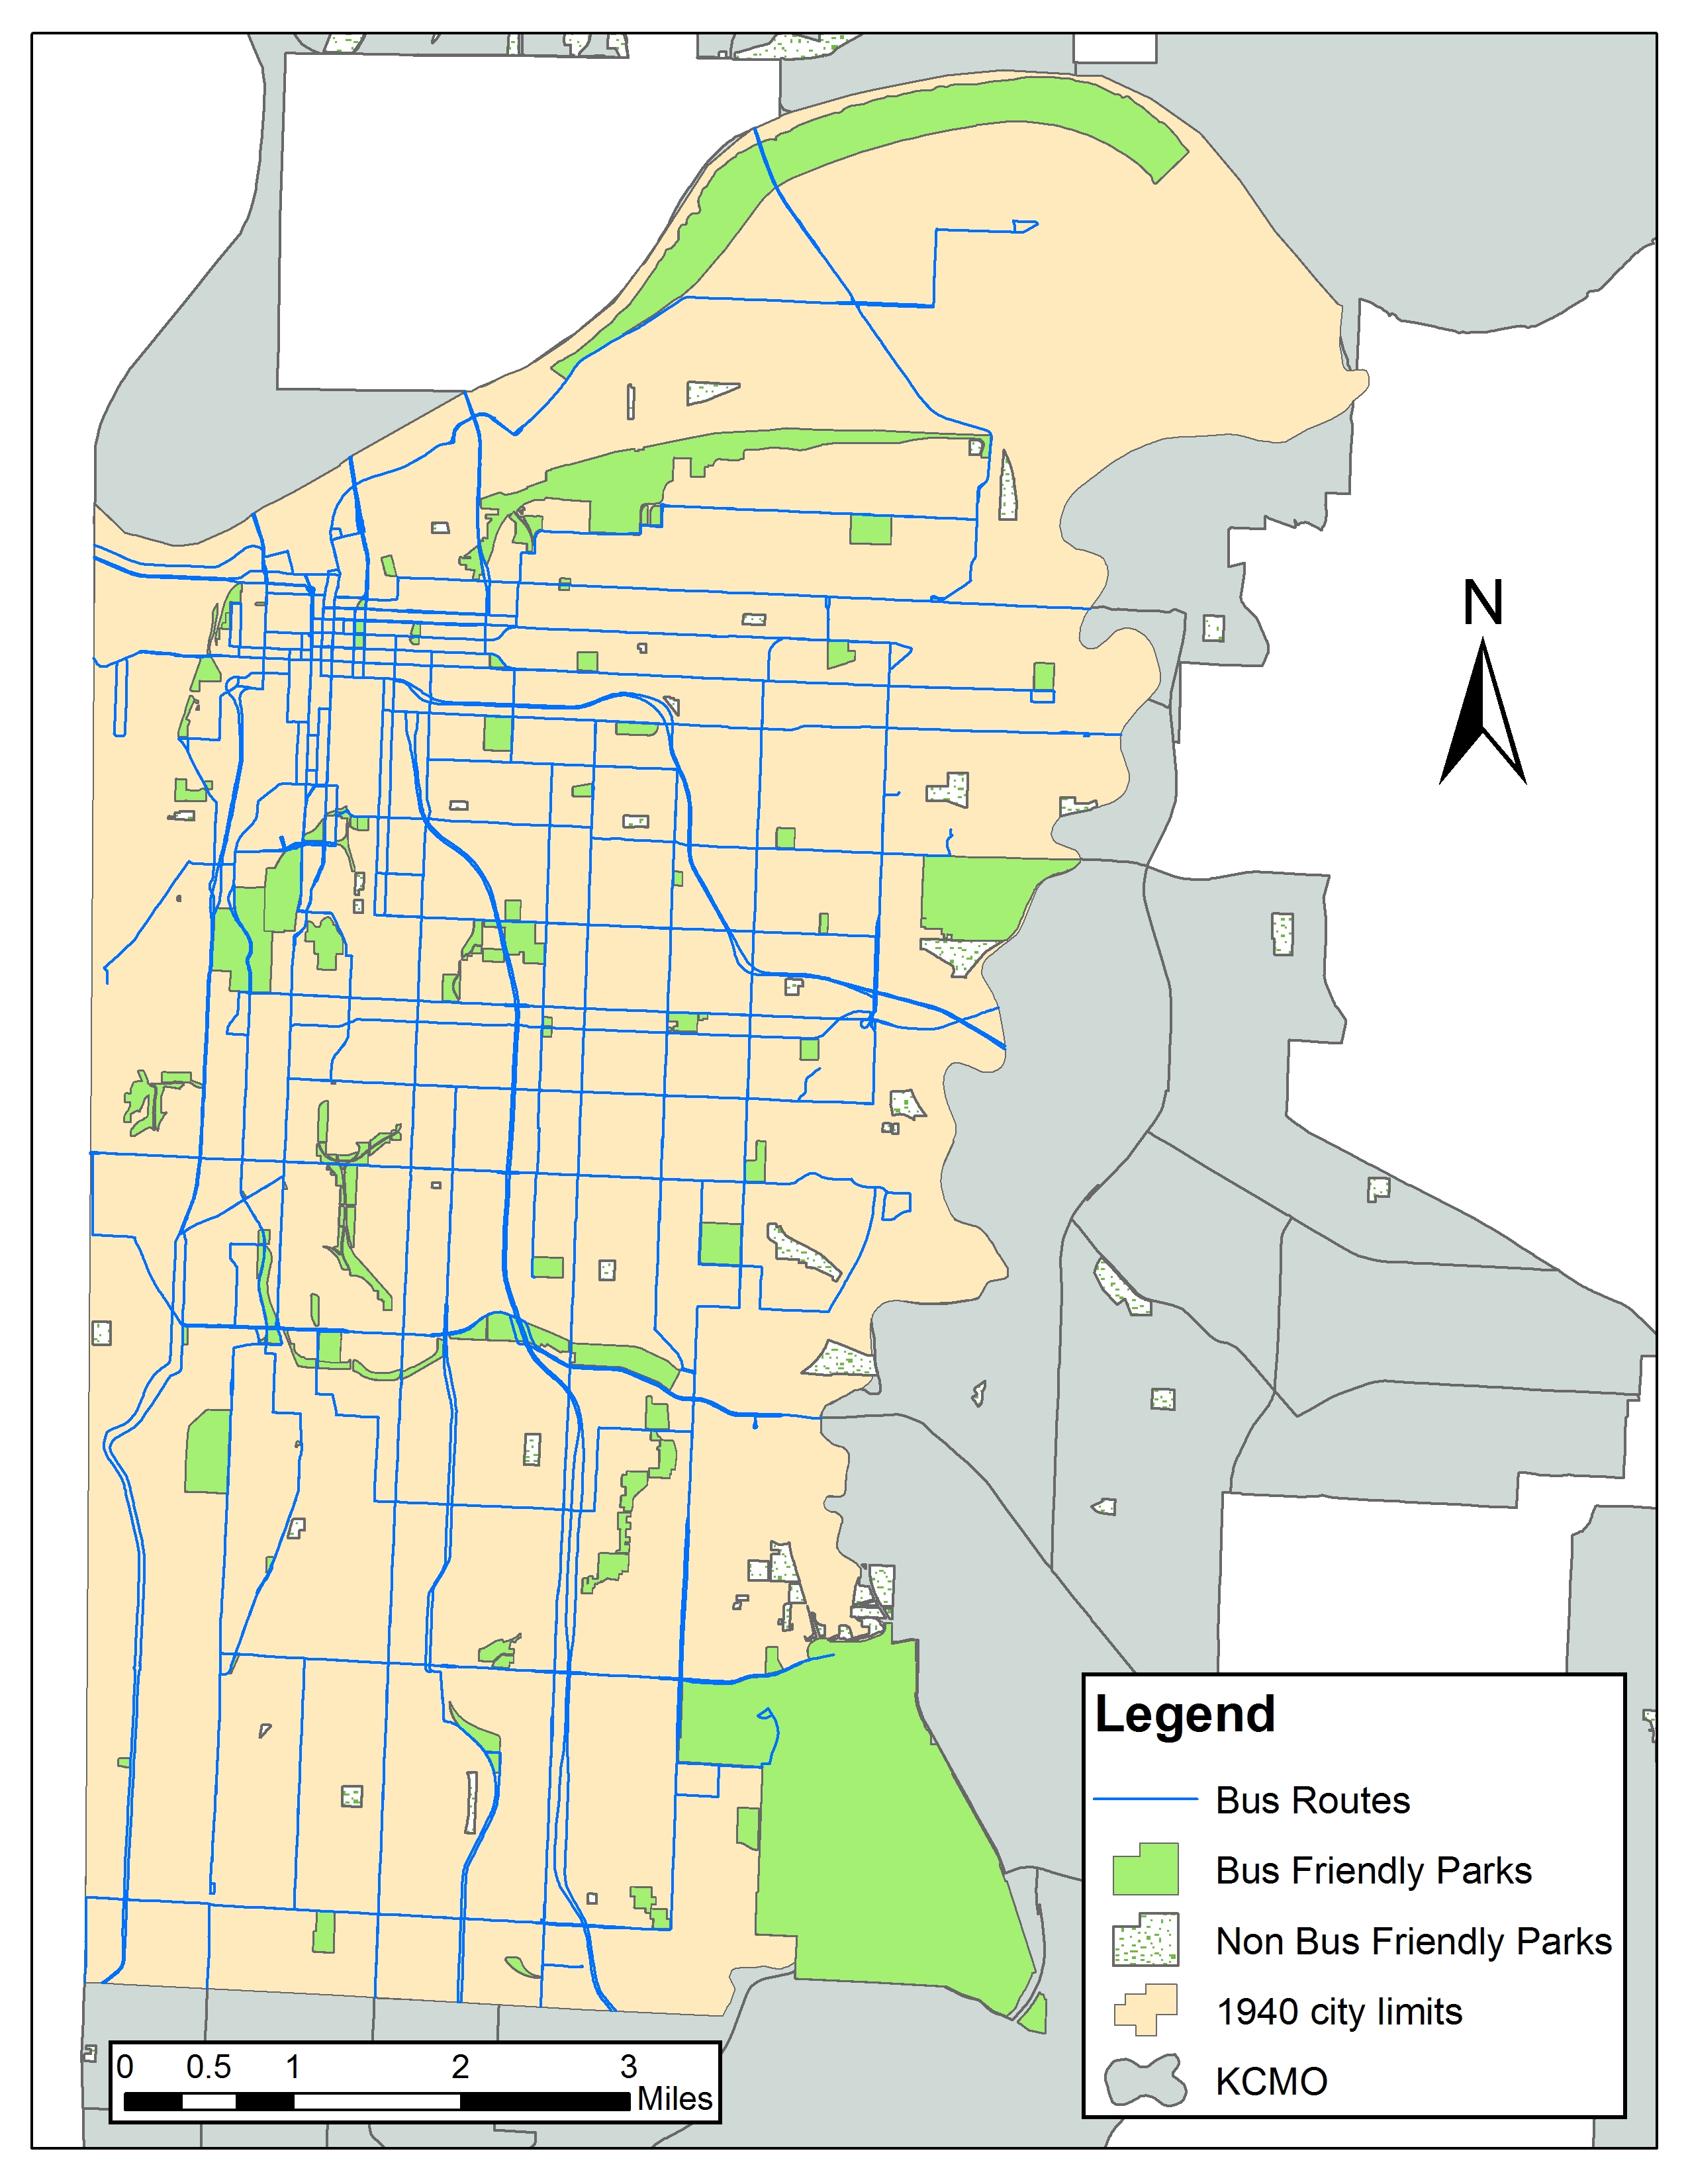
Parks and Transportation
When analyzing the Kansas City Parks and Boulevard system, the location of the specific analysis is important because although most of Kansas City has been shaped by suburbia, the inner core is still very reliant on public transportation. As you can see in Figure 3. (shown below), and the prior two maps, we have been using the original 1940 Kansas City, Missouri boundary area for the analysis. Image 3 is a map showing the parks that are, and are not within 100 feet of a bus route. This map can be useful when planning for bus route extensions, or identifying a lack of park space along a certain corridor.