There are patterns that only emerge when looking at the city from a birds eye view. Using data from various governmental sources, we can use mapping software like ArcGIS to analyze this information.
Housing on Parks and Boulevards
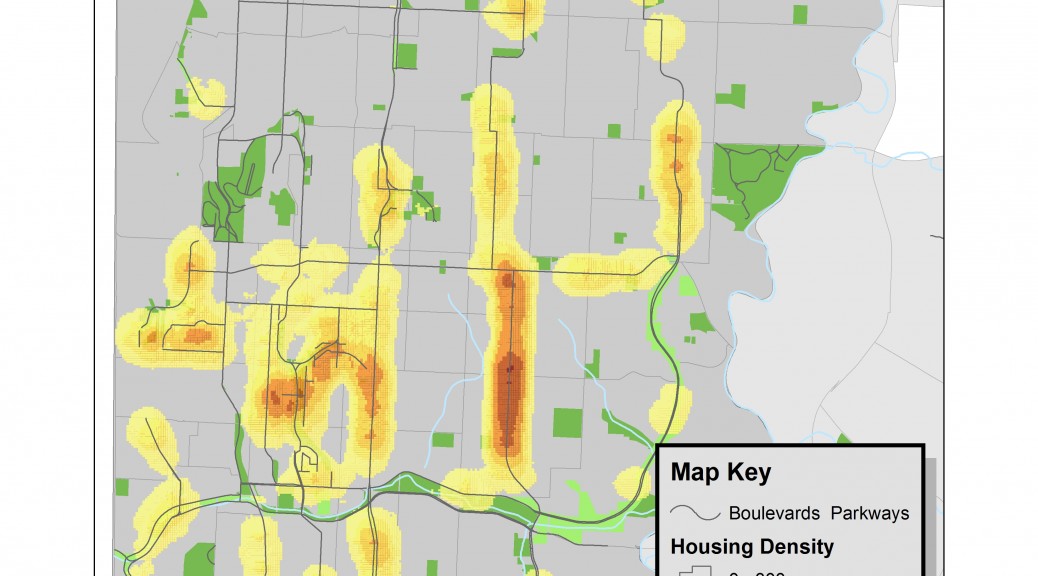
By mapping the parcels of land that contained housing units within 250′ of each side of the parkways and boulevards, we can visually see the areas that contain more single family over multi-family housing units. It shows where there are no housing units at all and where there are areas that were once occupied units yet are now vacant.
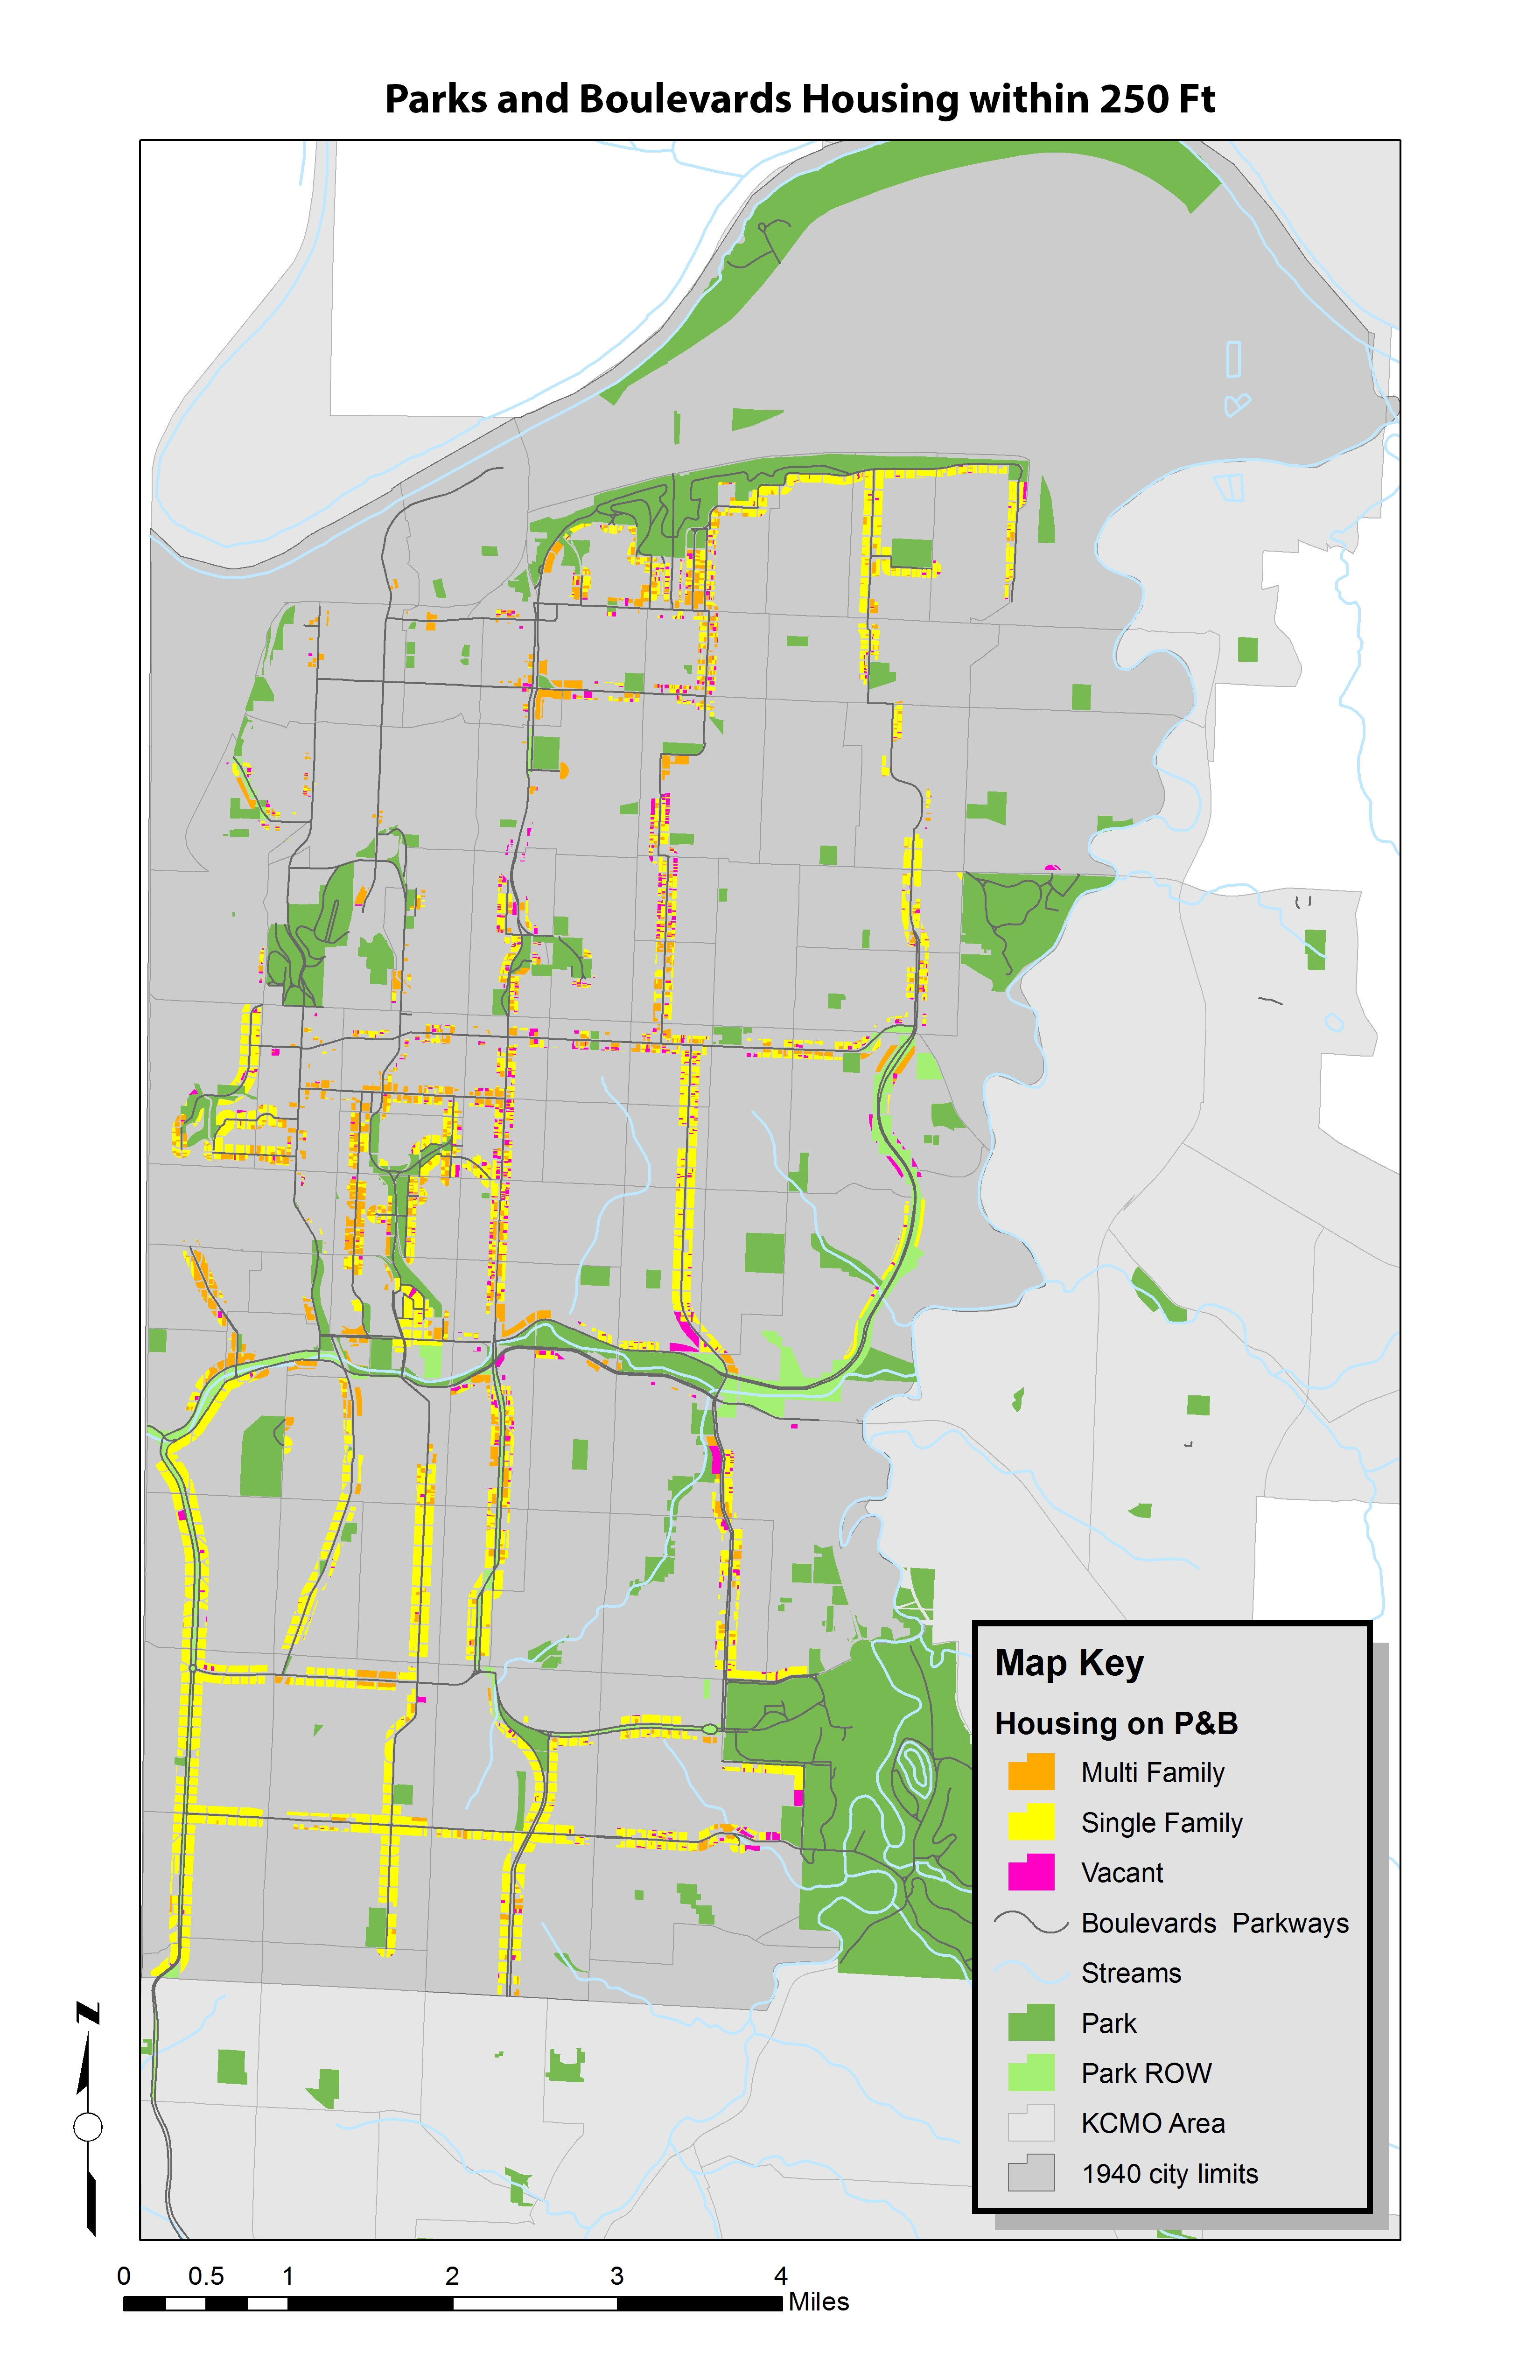
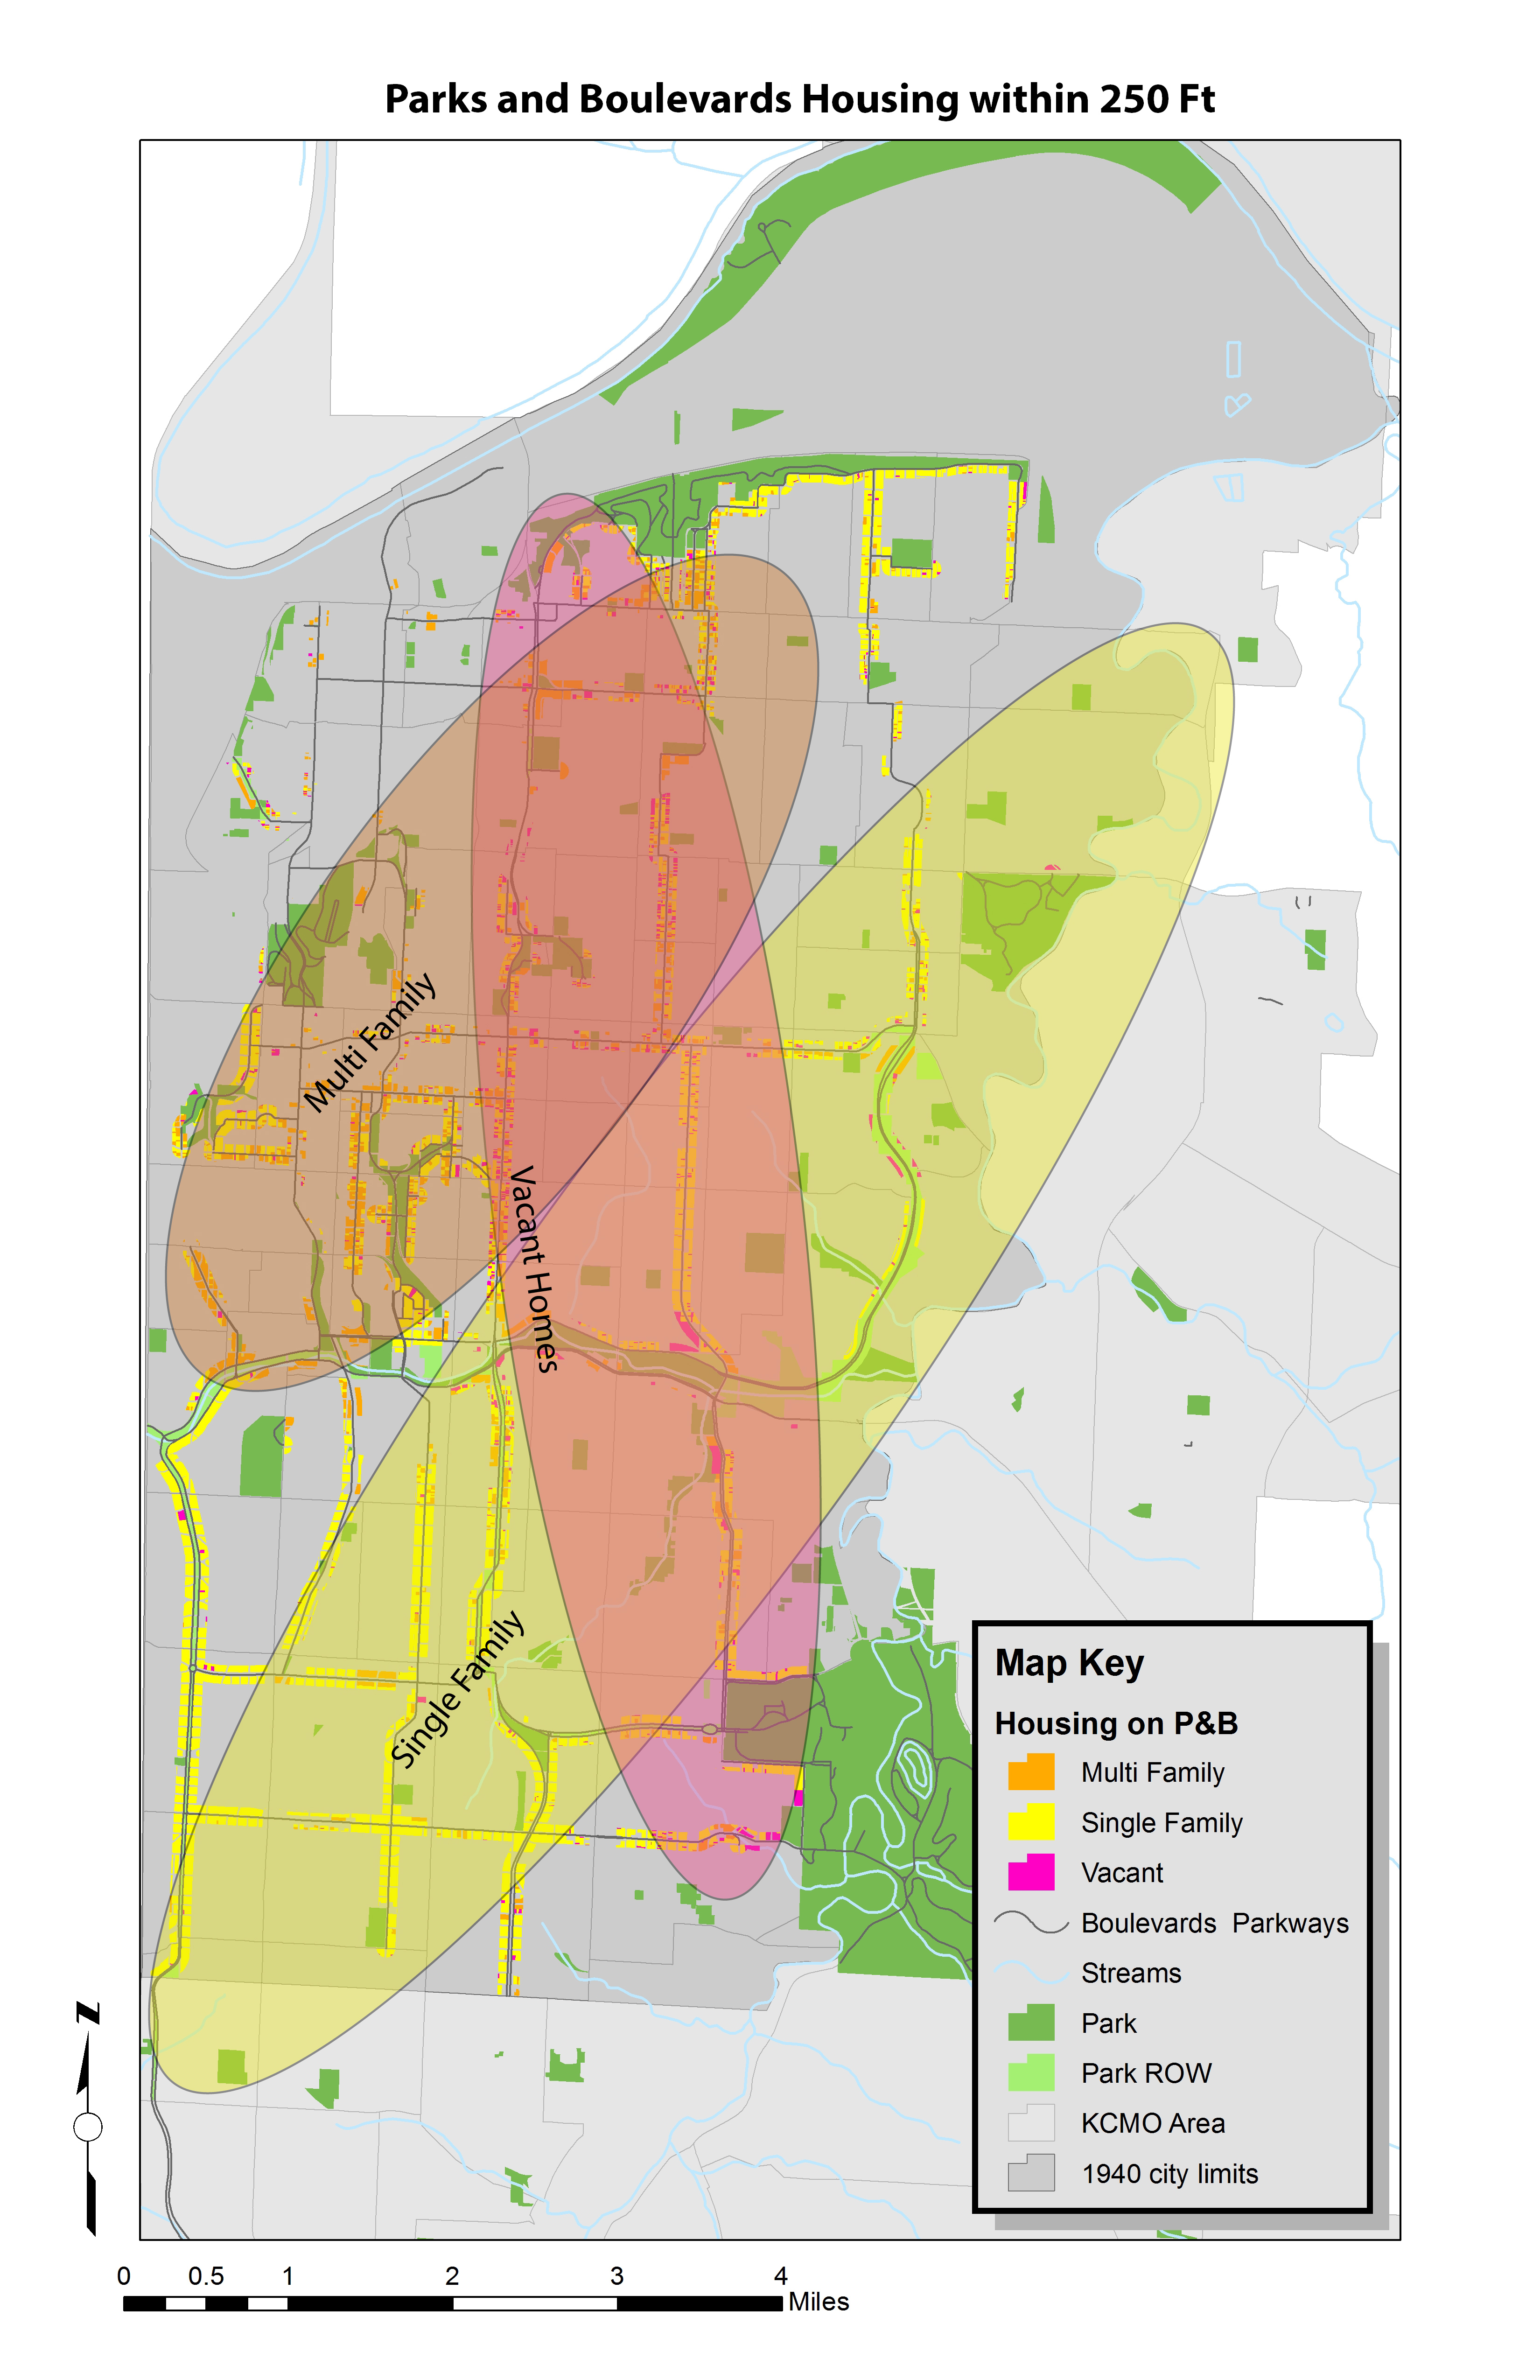
There are generalized areas that can be seen when grouping the different kinds of housing types. To the south and east, there are generally single family homes. To the north, the inner ring around the city contains many of the multi-family housing units that line the parkways and boulevards. There is also a long band of vacant properties that stretch from north to south along the east side of Paseo Boulevard.
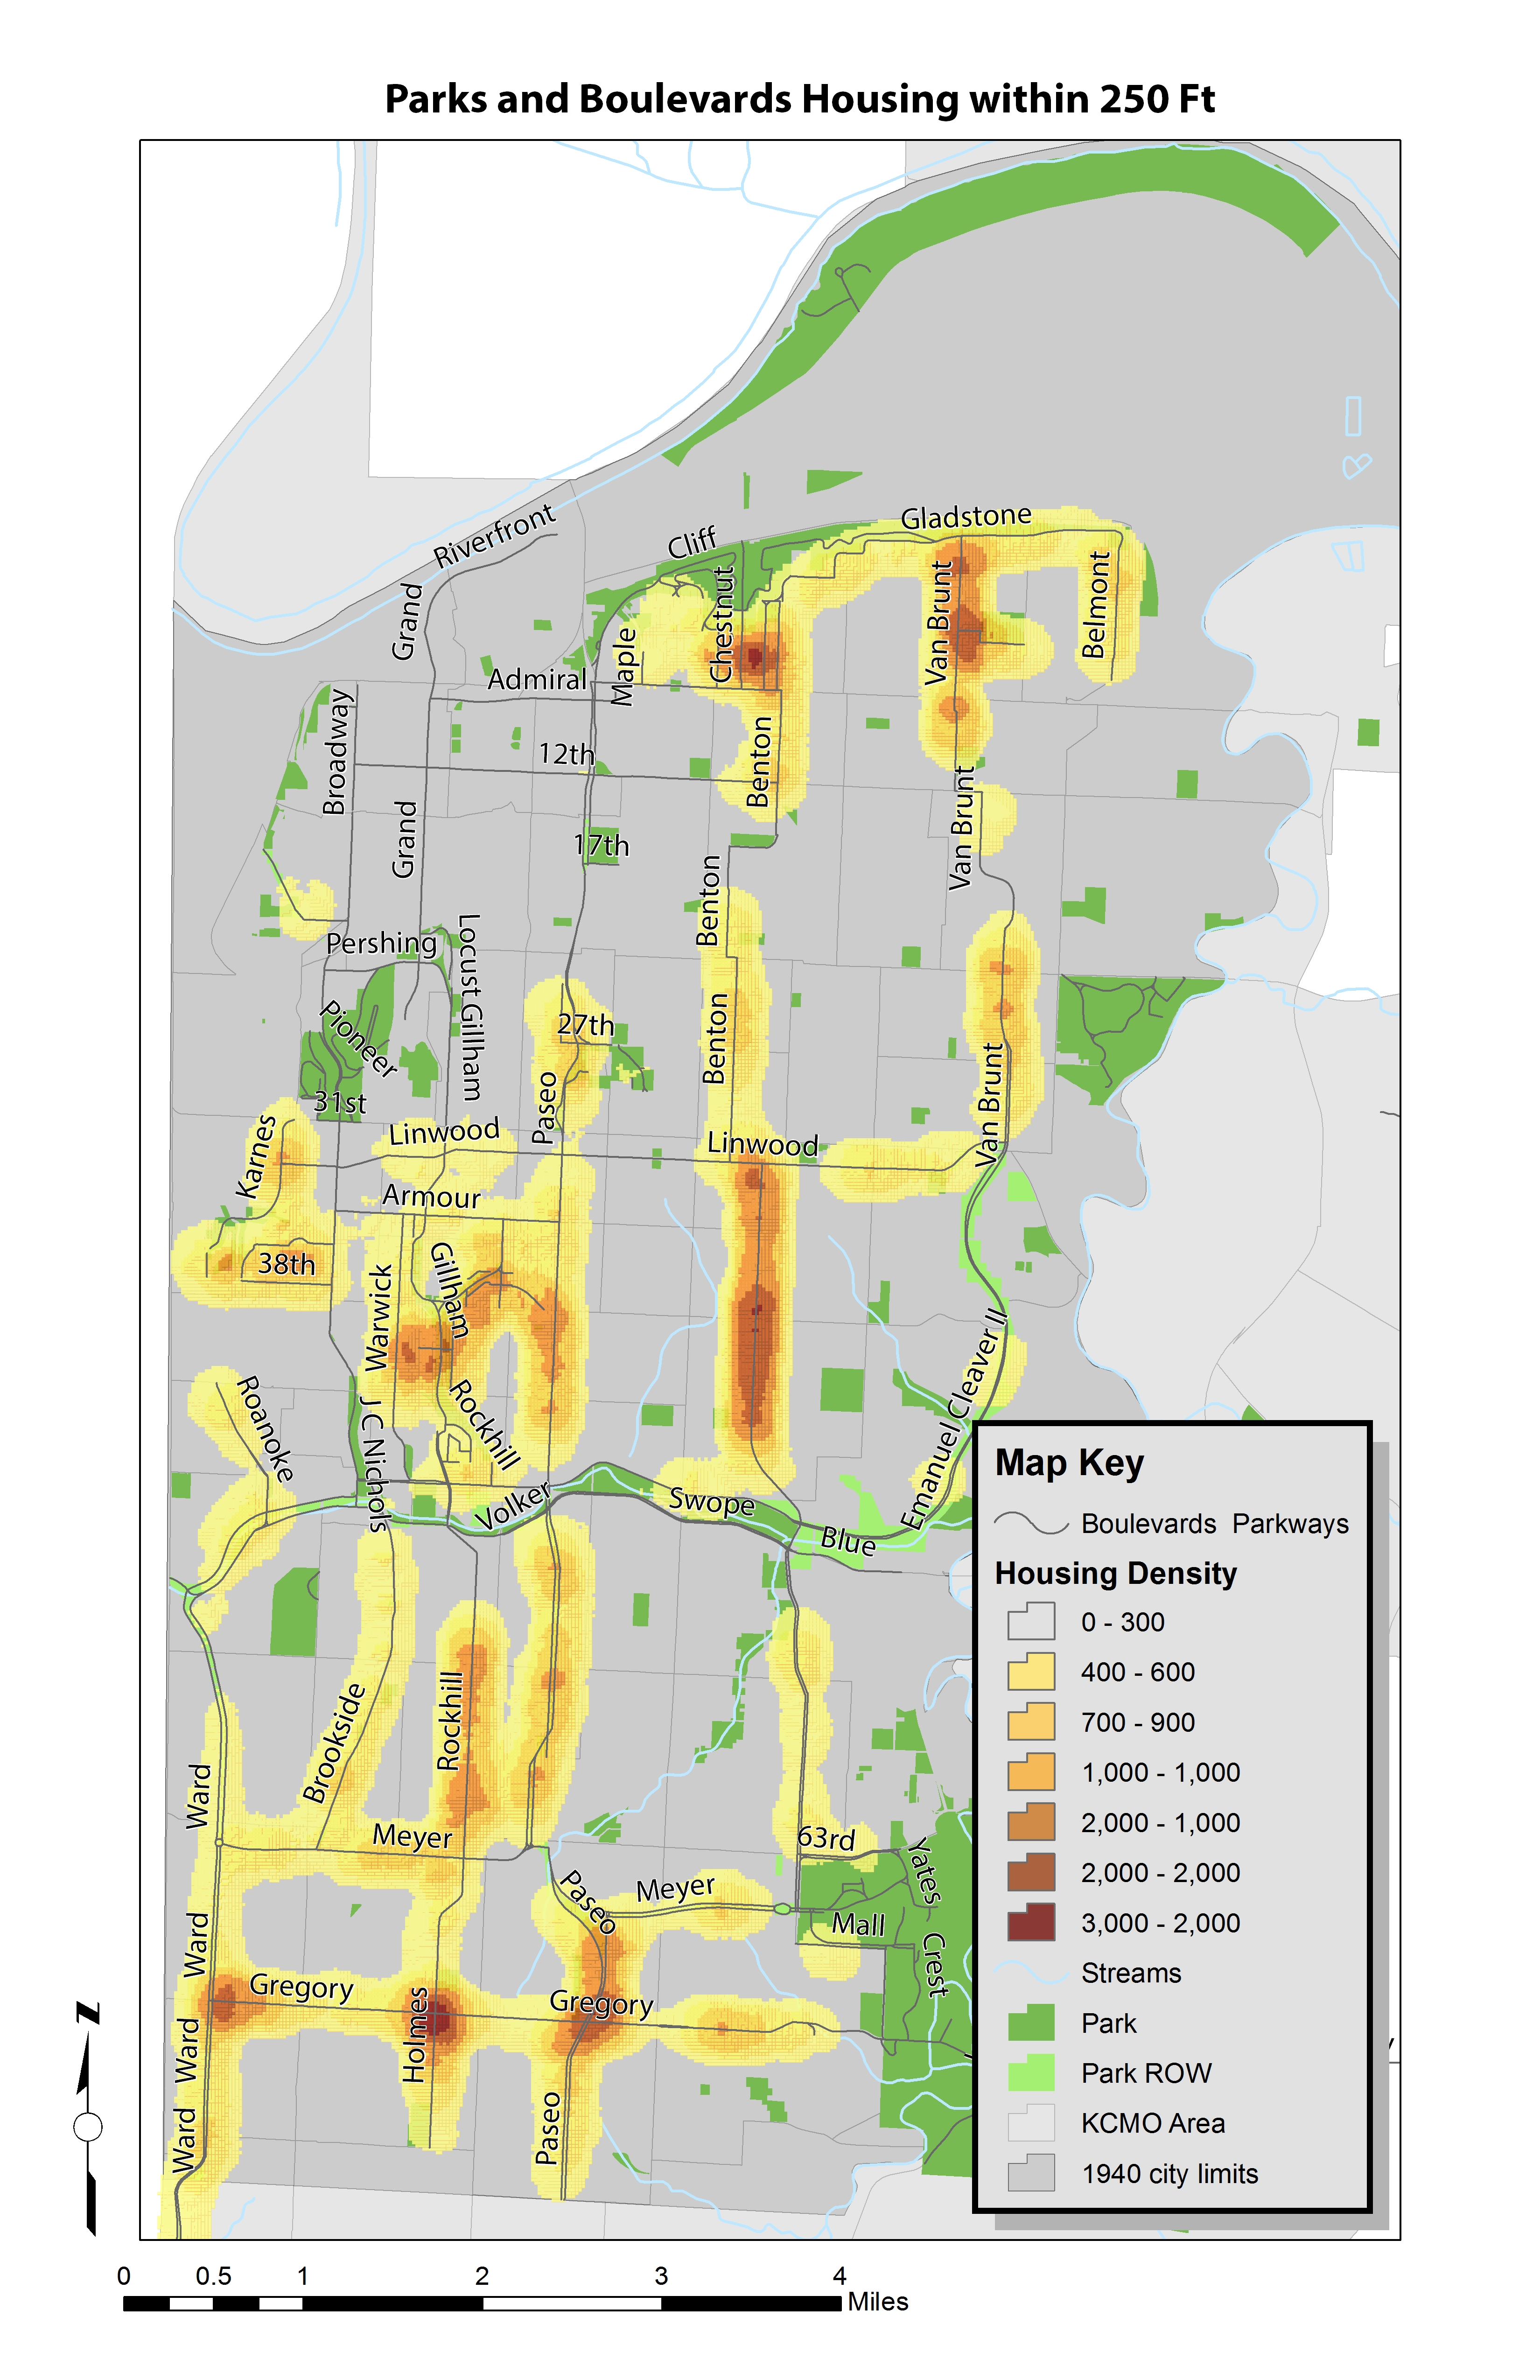
This next map shows the relative density of housing units along the parks and boulevards. Several of the ‘hot spots’ occur along Benton, Gillham and at Gregory and Holmes.
Land Use and Zoning
The following two maps show that Land Use and Zoning along the parks and boulevards.
Land Use
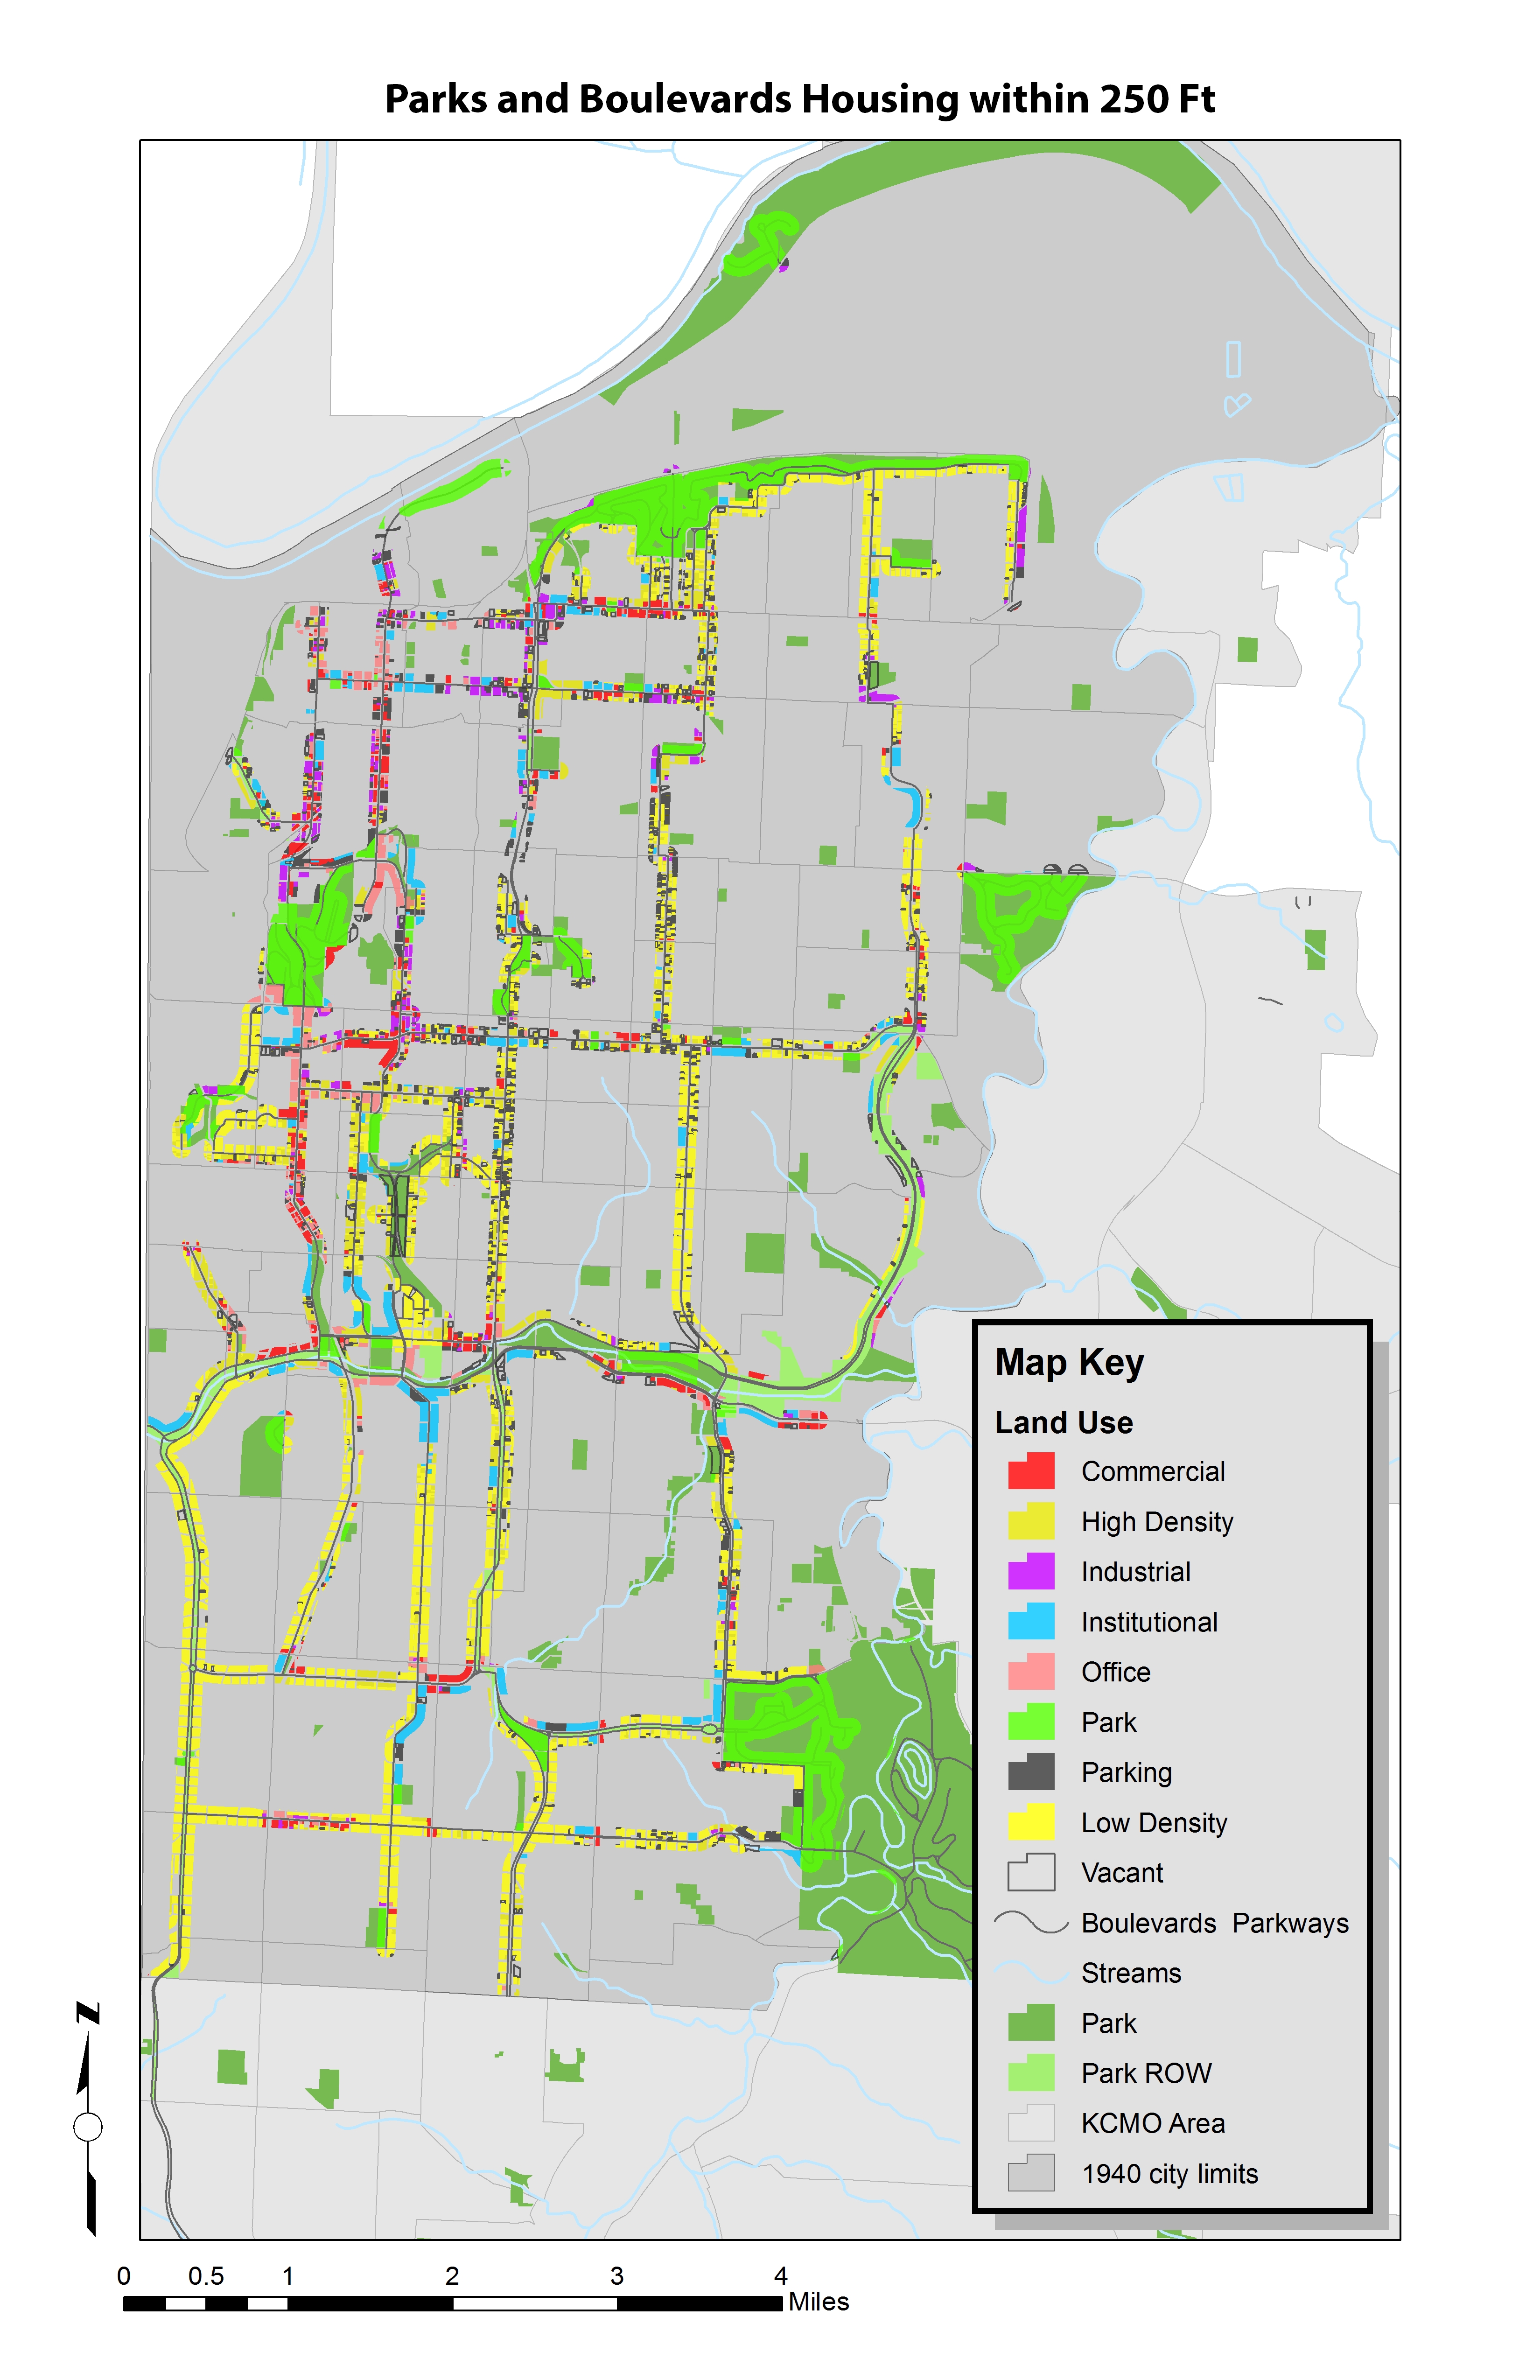
From this map, we can clearly see the separation of the mostly residential areas towards the extents and the Industrial and Commercial areas towards the center of the city.
Zoning
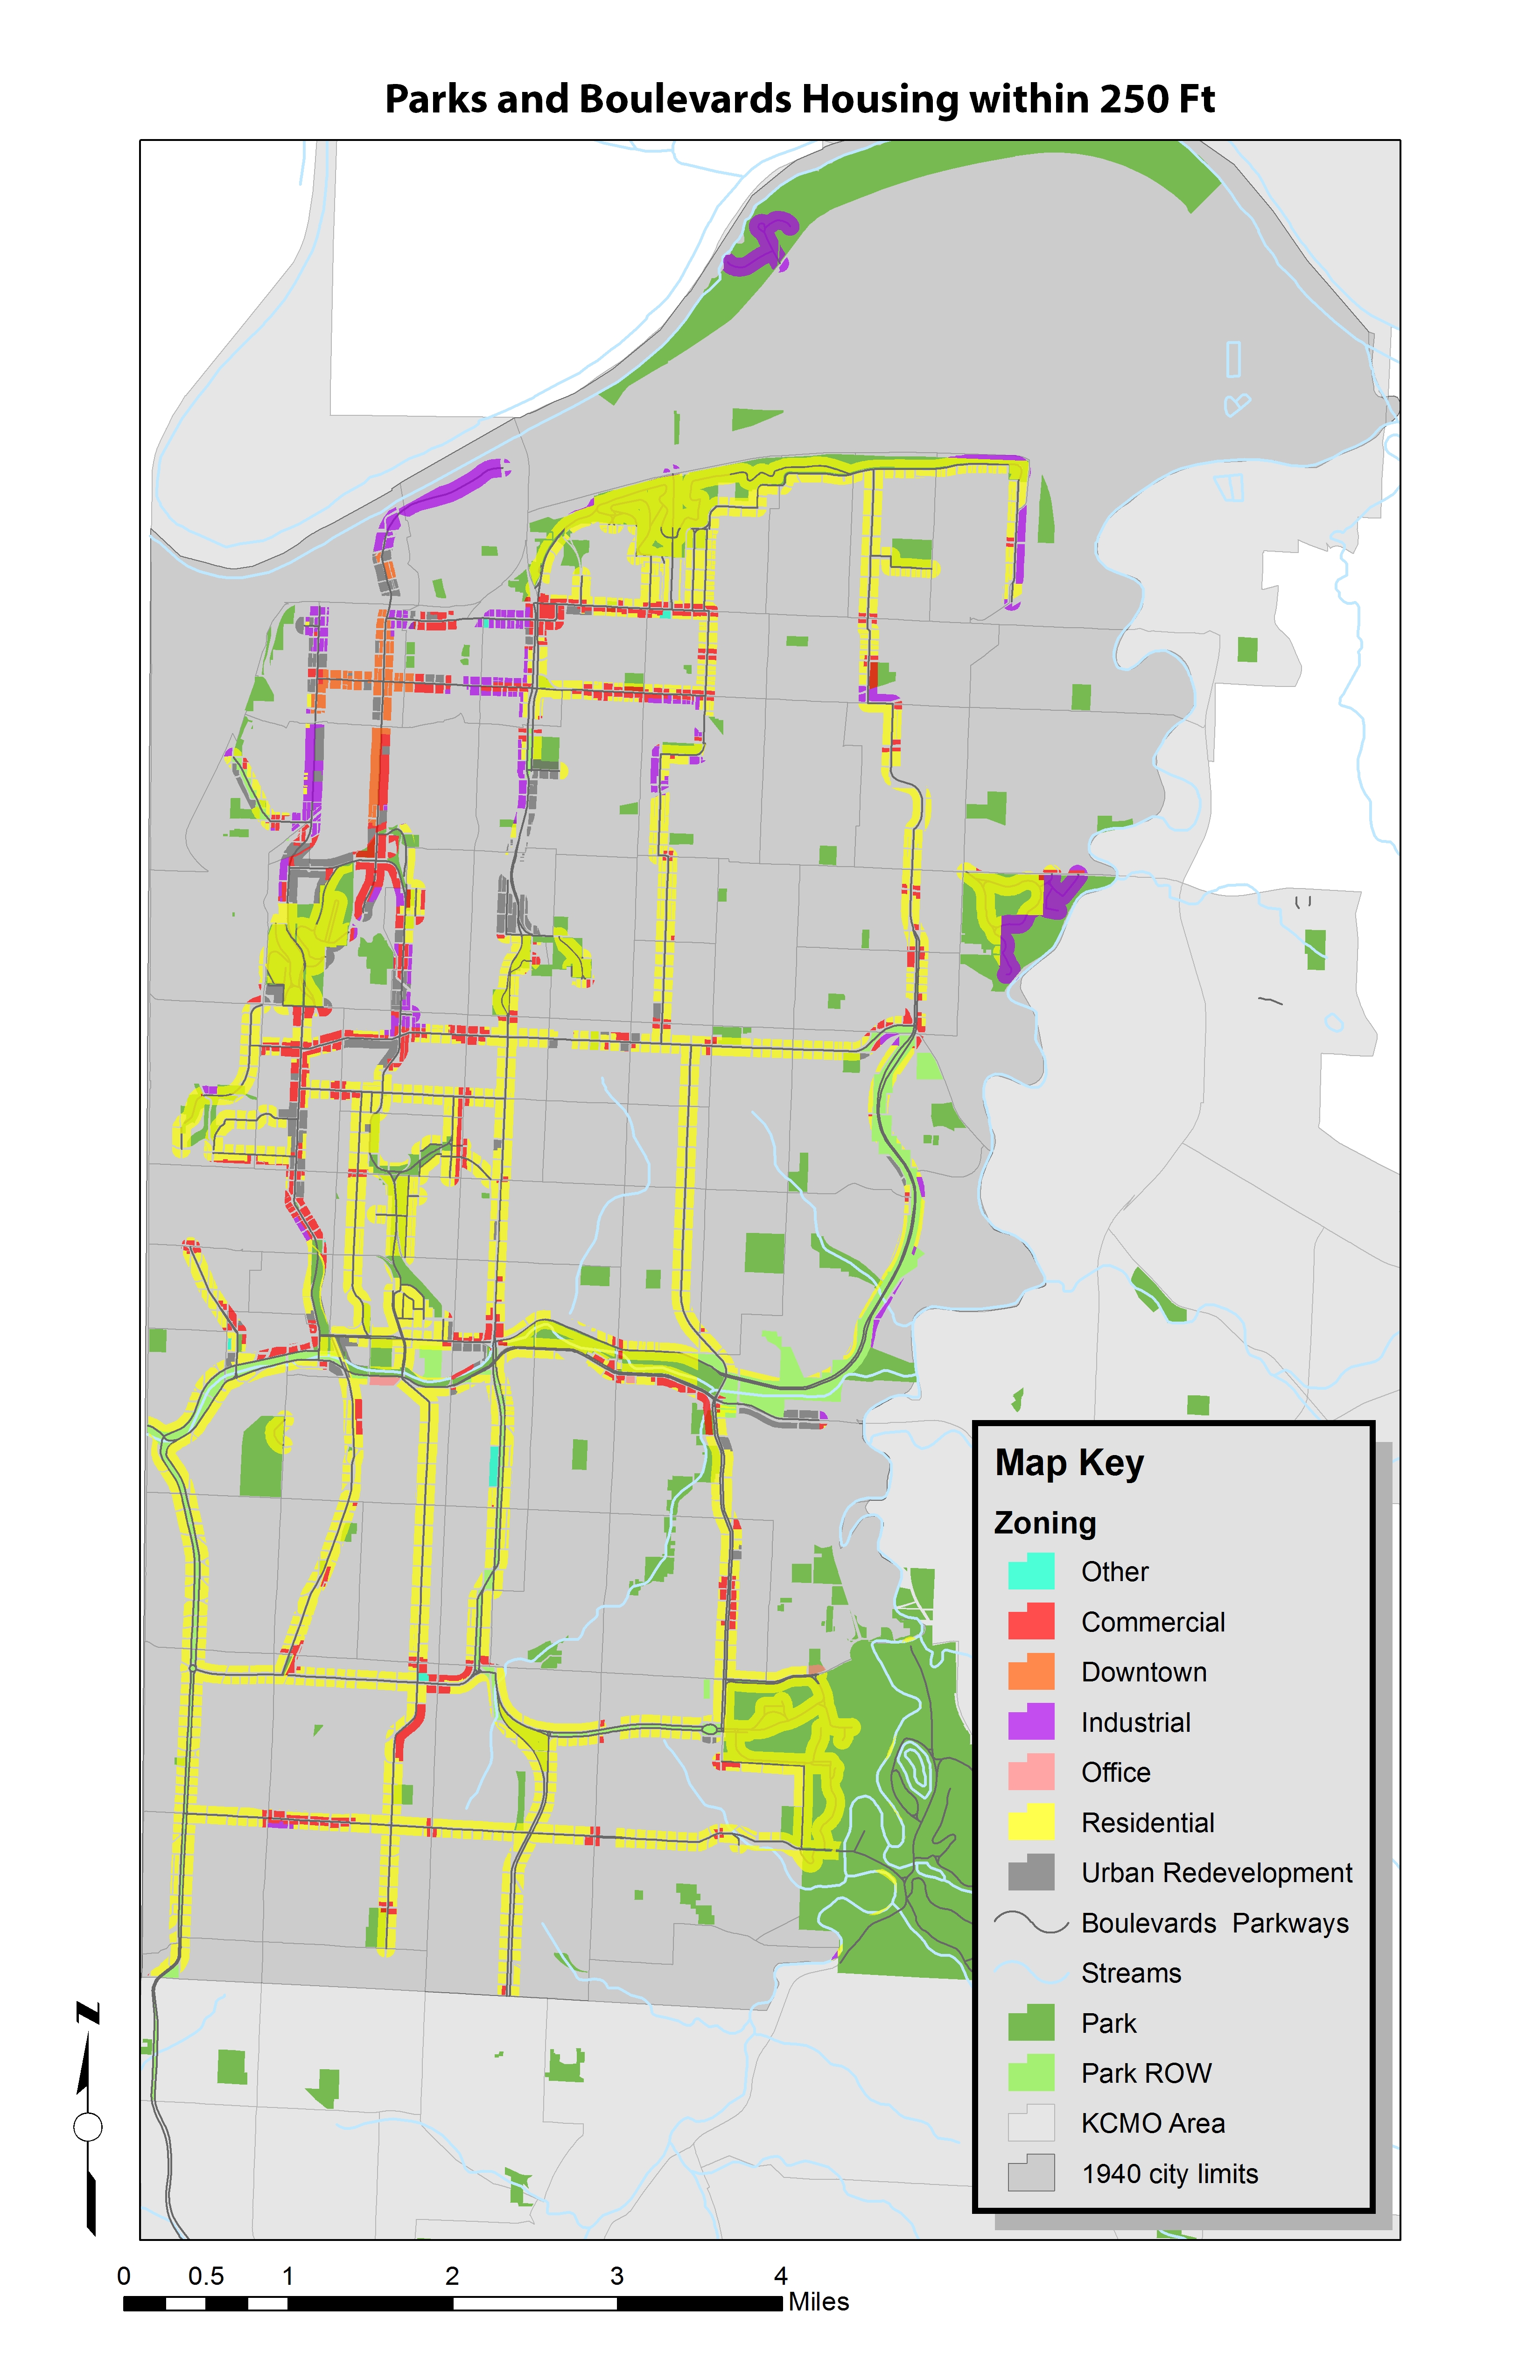
There are long bands of zoned areas on the system. These show that towards the CBD – Central Business District – there are large zoned industrial, commercial and office plats of land. Several of the knuckles that we have been studying are also zoned commercial.
Land Use in Residential Zoned Areas
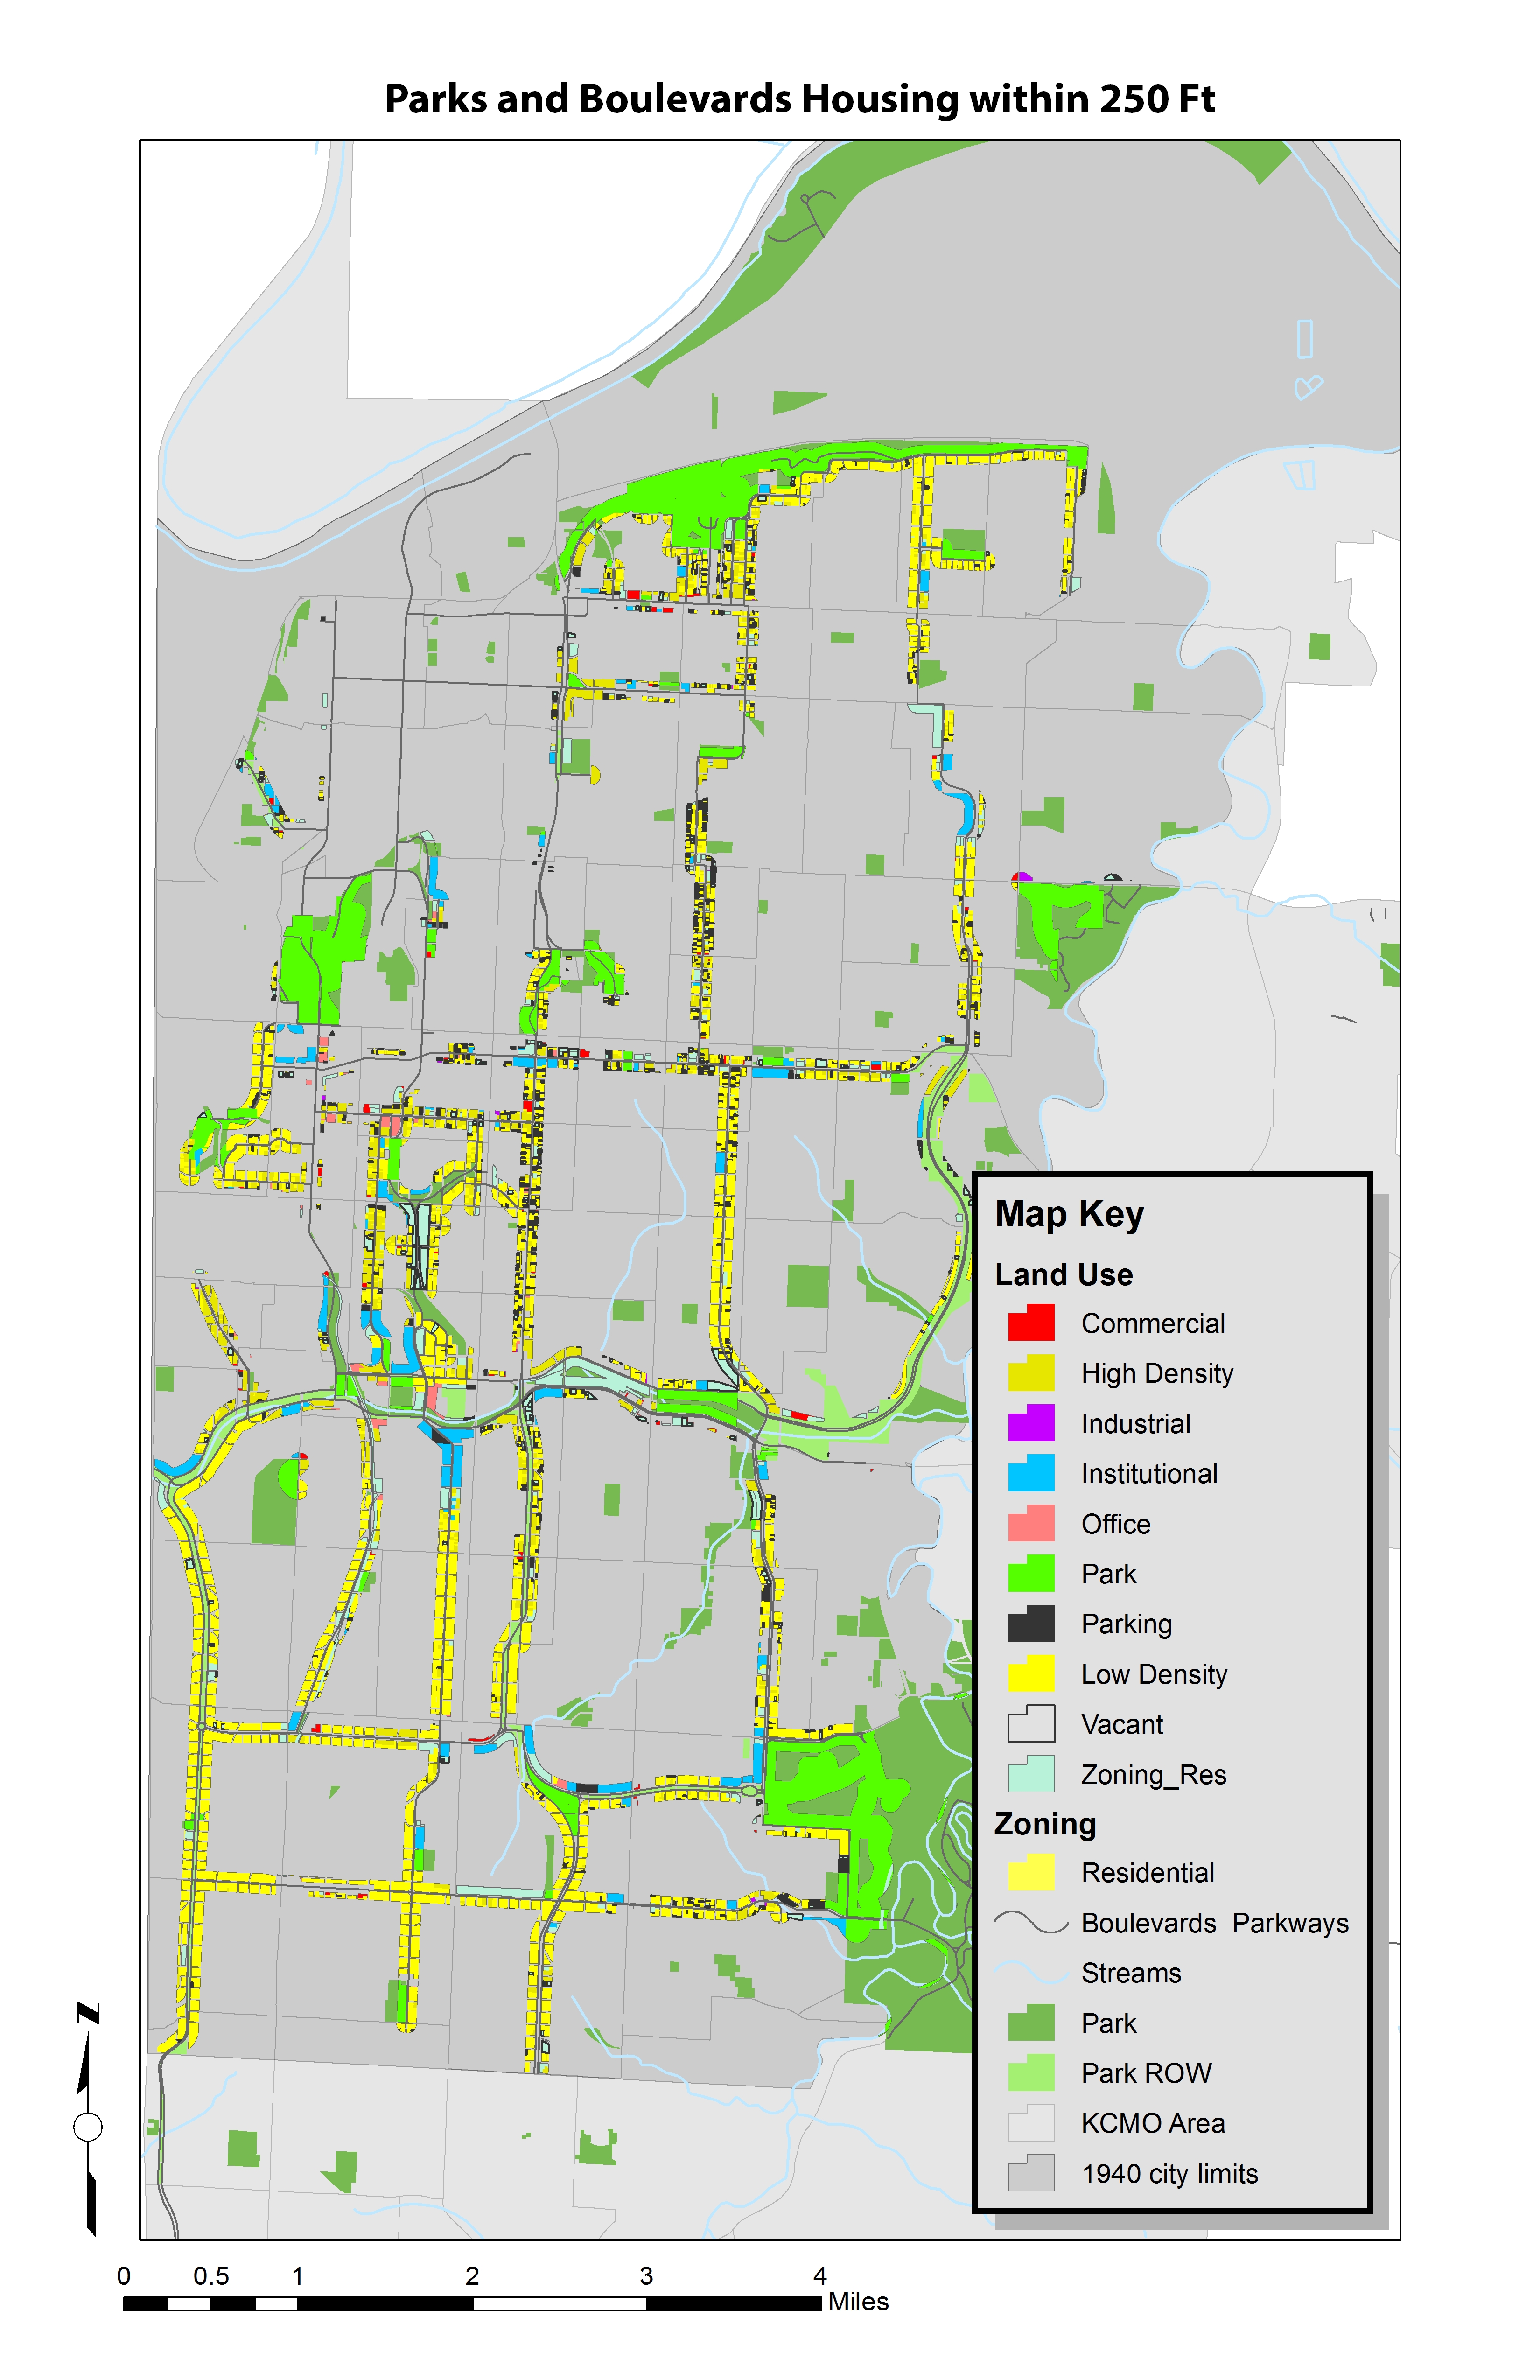
This map is particularly interesting. It shows all the land uses that are within residential zoned areas. We can see that these conflicts of land use are quite common. There are many institutions that are located within these residentialy zoned areas. There are also several commercial, office and industrial land uses that are within the residential areas.
Building Footprints

This last map shows where buildings with the largest footprints are located along the system are. Many of the larger buildings are located downtown and in midtown. These are also the same locations where the land use was not residential, but commercial, industrial and office space. How do these building forms and land uses work on the parks and boulevard system?
These kinds of analysis are beneficial in determining areas of improvement within the parks and boulevards system in Kansas City.