Category Archives: Analysis

Main Street TOD

For the spring semester we completed an in depth study of the Main Street Corridor from 31st street to 51st Street. We began by compiling information about the different elements of the area and documenting what we found.

We then began a study of the area using the LBCS standards. This data collected was then used to help determine areas of interest and key areas for interventions.

I choose the node of 31st and Main Street. Currently on the north eastern corner there is a great building utilizing the corner and adding character and value to the intersection. However across the street there is a vacant lot and mostly parking. I thought this would be a good area to focus the intervention.

I used this idea, adding buildings of value on the corner, and continued it along the next 2 blocks. Focusing firstly on the corners and then transitioning out from there. Using the surface level parking lots are areas of greatest need for improvements.

Another reason to focus on the node of 31st and Main Street, was its low amount of density and no real sense of connection to the area. It lacks a strong connection to the surrounding areas, and fails to establish a sense of place. 

Another design method was to use unique architecture as a way of creating a unique place, and a distinct stop on the streetcar. Rather than being another boring stop between Crown Center and Wesport, I wanted to create a place where people would want to gather, at all times of the day.

There would be numerous pedestrian areas, a slight road diet, and other traffic calming measures to make the intersection and area more friendly to pedestrians.

Along with increasing commercial activity my design would increase housing density as well. Not just luxury housing, but a wide variety of options.

Walls, Fences and Bollards

The Public realm is often defined as the space between the buildings. In this space is where people can walk, talk, meet, sit, and stay. There are certain design elements that benefit the Pedestrian experience, and some well intentioned design elements that failed. The issue of Human scale and continuity all contribute to the success or failure of an element.  I choose to study the region of Main Street from 31st to 51st, including the next closest streets, Walnut and Baltimore.

Walls

“Walls are put up in the mistaken notion that they will make a space feel safer. They make it feel isolated and gloomy.” – William Whyte

Most of the walls along Main Street fulfill the Main Street Plan’s requirement for screening a parking lot but they fail to add to the overall experience of the corridor. The purpose of these walls is ideal to help maintain a street edge and create a sense of continuity. However, because of the change in materials and scale, the walls become confusing and inconsistent.


Fences

According to the Kansas City Urban Design guidelines and the Historic preservation guidelines, fences should be low and reflect the house style. This should be done to help preserve the original historic material. However most of the fences I came into contact with were overwhelmingly utilitarian and non-compliant with the design standards.


Bollards

Bollards are used to help provide a barrier between the Pedestrian realm and the Automobile. They provide a visual and Structural deterrent and range in type and effectiveness.  The sacrificial nature of bollards allows them to stop vehicles and be easily replaced if necessary.  There are many types of bollards, permanent, movable, lighting bollards, in various shapes and sizes.

The low level of present population in the 1940 boundaries of KCMO

The largest lesson learned in a review of thematic maps on the status of the Parks and Boulevard System in Kansas City, MO is the low level of population within the 1940 boundaries of the city. In 2010, our study area with a population of just over 179,000 had almost the same population of Overland Park, Kansas with 173,000. Overland Park continues to grow and has reached 181,000 as of 2013 — a higher number than the 2010 population in our study area. In the 1940 Census Kansas City Missouri had just over 399,000 people. Our city has lost 220,000 people within our study area boundary. This is a 55% decline over the period and reveals a rate of decline of more than 1% a year.  The 1940 boundaries of Kansas City Mo are essentially the same as the 1909 boundaries. Our population today is 79,000 less in this area than our 1910 population of 248,000.

This has large implications on the capacity to maintain and restore the historic parks and boulevard system within this area of the city.

Sources: US Census Bureau 2015 Quick Facts,

US Census Analysis of the 100 Largest Places since 1790 (https://www.census.gov/population/www/documentation/twps0027/tab17.txt).

Student analyses in UMKC UPD 312 Urban Planning + Design studio.


In Depth Analysis – Kansas City Parks and Boulevards

Following up on some of work covered in our studio over the past few weeks, this assignment was designed to compile all of our findnings, and collectively synthesize what these findings meant for the future of the Parks and Boulevards System. After a group SWOT analysis, specific focus topics were identified and assigned for an in-depth analysis

PARK SYSTEM METRICS

The analysis of Park System Metrics looked at the system as a whole, and focused on the distribution of parks and boulevard and related ameinities throught the Kansas City area. Here, parks and boulevards were identified and categorized based on a number of attirbutes. Figure 1 shows the location and differentiation between parkways and bouevards throught the system. Note how the Parkways seems to offer a “direct route” to a destination, more or less, while the Boulevards tend follow more of an organic, free-flowing pattern.

Street Classification
Figure 1: Boulevards and Parkways Classifification

Kansas City’s Parks and Recreation Department categorize park space into four classifications: Community Parks, Neighborhood Parks, Regional Parks, and Greenways. Figure 2 shows the distribution of these park types in Kansas City. The majority of park space, in terms of total number of parks, in Kansa City appears to be neighborhood and community parks, and are spread sporadically throughout. The southern

ParkType
Figure 2: Kansas City Parks Classifications

As you can see, the majority of parks are classified as either neighborhood  or community park space.  There appears to be a nice balance of regional park space in ares of souther Kansas City, as well as the Midtown area, however, the northeastern portion of the city seems to lacking this type of development.

PARKS AND ECONOMY

This analysis looked at the effects that the Parks and Boulevard system plays in Kansas Cities economy. In the last assignment, I looked particularly at median household income level throughout Kansas City at the census tract level. The findings in that research showed a relationship between amount of available park space and income level, in the sense that census tracts with more park space, or even a higher concentration of park space were often associated with higher income. In the case, I focused in on property values per parcel, both surrounding park space, and in areas with less park space.

PropertyValuesNorthEast
Figure 3: Assessed Property Values – Northeast Kansas City

Figure 3 accurtately depicts the relationship between the presence of park space or proximiety to a parkway or boulevard and property values. This analysis concluded that parcels located near a parkway or boulevard, or in close proximety to a park were often associated with a higher property value. In Kansas City, the average assessed property value is around $13,500. On average, homes located at least a quarter mile of a public park showed a value of $13,650, and homes within one quarter mile of a parkway or boulevard showed an average value of $14,291.

Housing and Land Use on KC’s Parks and Boulevards

There are patterns that only emerge when looking at the city from a birds eye view. Using data from various governmental sources, we can use mapping software like ArcGIS to analyze this information.


Housing on Parks and Boulevards

By mapping the parcels of land that contained housing units within 250′ of each side of the parkways and boulevards, we can visually see the areas that contain more single family over multi-family housing units. It shows where there are no housing units at all and where there are areas that were once occupied units yet are now vacant.

Housing Map 03_05
View of Parcels Current Land Use in Terms of Housing

There are generalized areas that can be seen when grouping the different kinds of housing types. To the south and east, there are generally single family homes. To the north, the inner ring around the city contains many of the multi-family housing units that line the parkways and boulevards. There is also a long band of vacant properties that stretch from north to south along the east side of Paseo Boulevard.

Housing Map 03_05 REGIONS
Regions of Generalized Housing Type

This next map shows the relative density of housing units along the parks and boulevards. Several of the ‘hot spots’ occur along Benton, Gillham and at Gregory and Holmes.


Density of Housing on Parkways and Boulevards

 Land Use and Zoning

The following two maps show that Land Use and Zoning along the parks and boulevards.

Land Use

LandUseMap03_05
Land Use on Parkways and Boulevards

From this map, we can clearly see the separation of the mostly residential areas towards the extents and the Industrial and Commercial areas towards the center of the city.

Zoning

ZoningMap03_05
Zoning on Parkways and Boulevards

There are long bands of zoned areas on the system. These show that towards the CBD – Central Business District – there are large zoned industrial, commercial and office plats of land. Several of the knuckles that we have been studying are also zoned commercial.


 Land Use in Residential Zoned Areas


ZoningMap03_05COMPAREDwithLANDUSE
Land Use in Residential Zoned Areas

This map is particularly interesting. It shows all the land uses that are within residential zoned areas. We can see that these conflicts of land use are quite common. There are many institutions that are located within these residentialy zoned areas. There are also several commercial, office and industrial land uses that are within the residential areas.

Building Footprints

Building FtPrnt Density Map03_05wlabels
Density of Building Footprints

This last map shows where buildings with the largest footprints are located along the system are. Many of the larger buildings are located downtown and in midtown. These are also the same locations where the land use was not residential, but commercial, industrial and office space. How do these building forms and land uses work on the parks and boulevard system?

These kinds of analysis are beneficial in determining areas of improvement within the parks and boulevards system in Kansas City.

Analyzing the Kansas City Parks and Boulevards

Continuing our research analysis on the Parks and Boulevard system, our studio was assigned to complete our analysis and presentation work. Each student was assigned to three different groups to combat the analysis research and presentations. The analysis topics were decided on after a SWOT analysis was done over our previous work. Today, I will be covering a work example from each of my three topics. All maps will use the 1940’s Kansas City, Missouri boundaries.

Park System Metrics

Park System Metrics covers a wide range of elements when analyzing the Parks and Boulevards system. Because there are no specific classifications with the topic, it have many different overlaps. Figure 1. (seen below), is a location map produced by my group partner and I. It identifies the locations of different park facilities such as Tennis Courts, Soccer Fields, and Baseball Diamonds within the Parks system. This map can be used when identifying areas of the city, which may lack certain facilities within the park system. Another great thing about this map is that it can be used with census data to identify inequality in locations of minority and low income areas.

Park Facilities
Figure 1. Park Facilities throughout the 1940 KCMO boundaries.


Parks and Demographics

Demographic analysis in most cases, can be the most important tool to when studying a geographical location. Figure 2. (shown below) is a map using census block level data to show areas with the majority of residents being Hispanic or Latino. This map can be used for many things, such as identifying inequality in the total number of park acreage within the majority Hispanic neighborhoods, or to identify areas to locate specific facilities based on residential culture.

Majority Hispanic
Figure 2. Majority Hispanic/Latino location map according to 2010 Census Block data within the 1940 KCMO boundaries.


Parks and Transportation

When analyzing the Kansas City Parks and Boulevard system, the location of the specific analysis is important because although most of Kansas City has been shaped by suburbia, the inner core is still very reliant on public transportation. As you can see in Figure 3. (shown below), and the prior two maps, we have been using the original 1940 Kansas City, Missouri boundary area for the analysis. Image 3 is a map showing the parks that are, and are not within 100 feet of a bus route. This map can be useful when planning for bus route extensions, or identifying a lack of park  space along a certain corridor.

Figure 3. Parks within 100 ft. of a weekend service Bus Route within the 1940 KCMO boundary.

Kids? Seniors? Who do KC’s Parks Serve?

Among one of the ways any city’s population differs noticeably is in age. Kids, teens, young adults, other adults, and seniors — they characterize a city, even affecting its built form, as they might live in different areas and need different facilities.

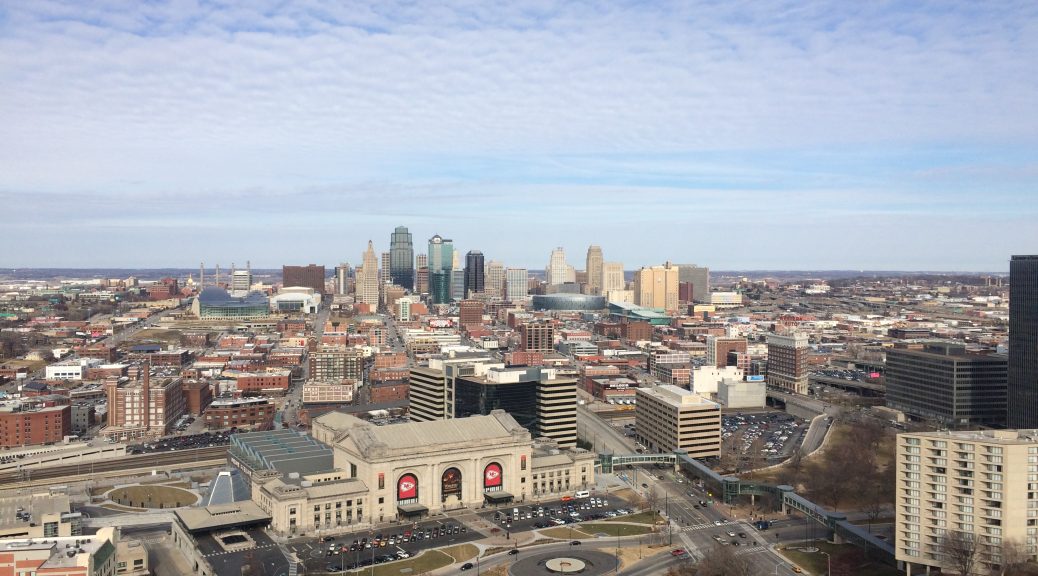
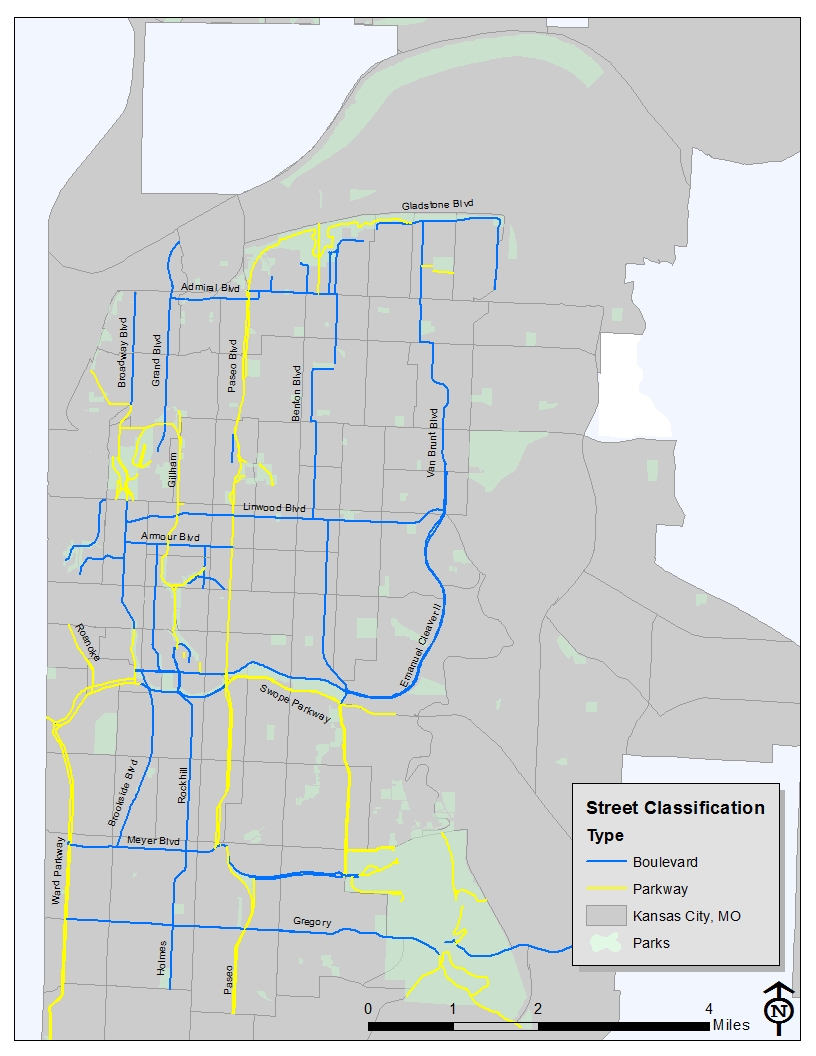
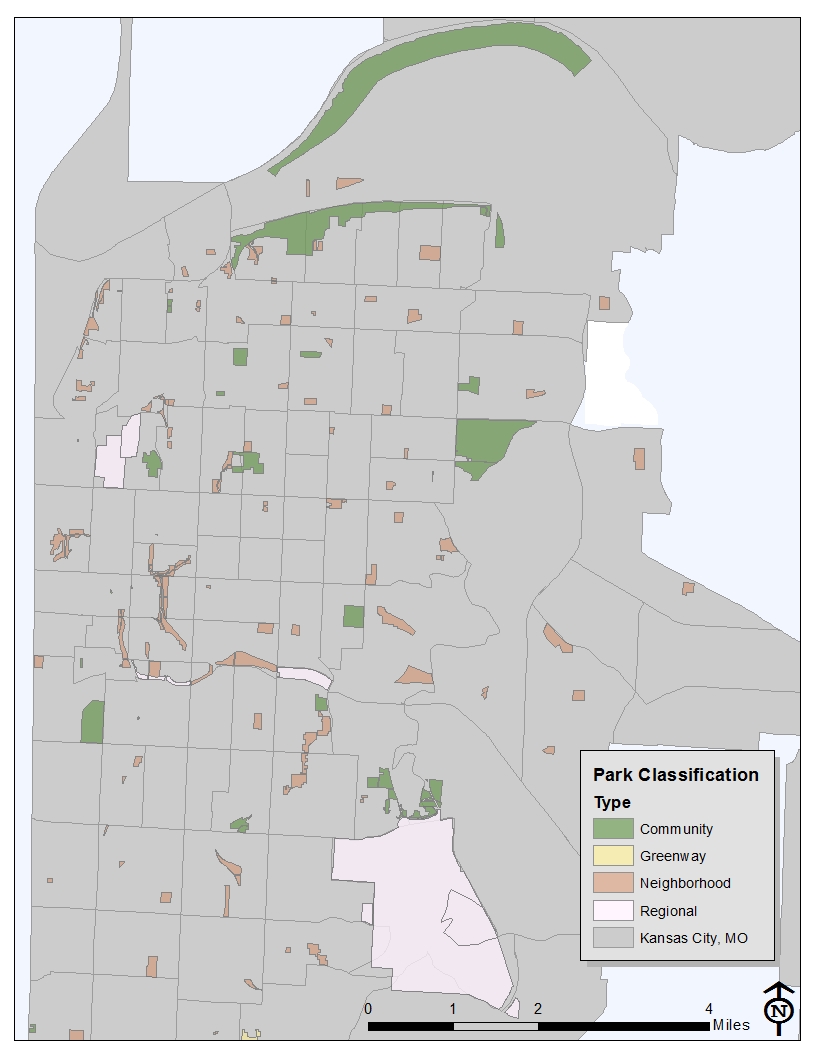
For the purposes of this project, we are dealing with just the area of the city within boundaries of Kansas City in 1940.

Within that area, the population breaks down this way today:

pop chart

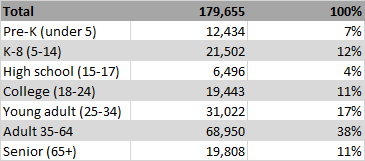
Approximately 40% of the city’s total population lives here today.

The way the Census Bureau breaks down age makes it difficult to classify age groups, or “cohorts”. The “high school” cohort I’ve created only goes up to age 17 because that’s where the Census Bureau defines the end of a group.

Still adults — “young adults” and “adults 35-64” combined — are clearly the most populous group. Now, that’s likely because they are the largest groups in terms of age — both groups combined make a 40-year span.

But the seemingly imbalanced breakdown is very telling when compared with the right data — for instance, park users by age.
Researchers from the University of Missouri — Columbia and Kansas State University undertook the Kansas City Parks and Physical Activity Project, beginning in 2008. They survey park users at four major Kansas City parks (all of which fall in the 1940 city limits), looking at demographic characteristics and at how those users used the park.

The ages of users broke down like this:

kcpapa fig 1


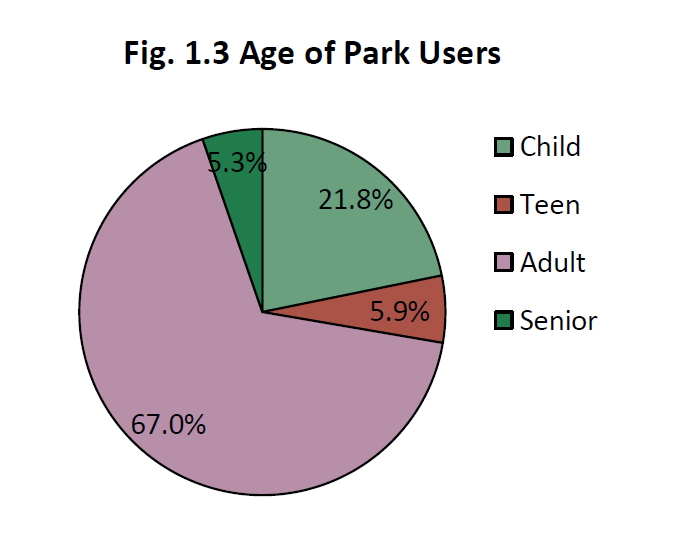
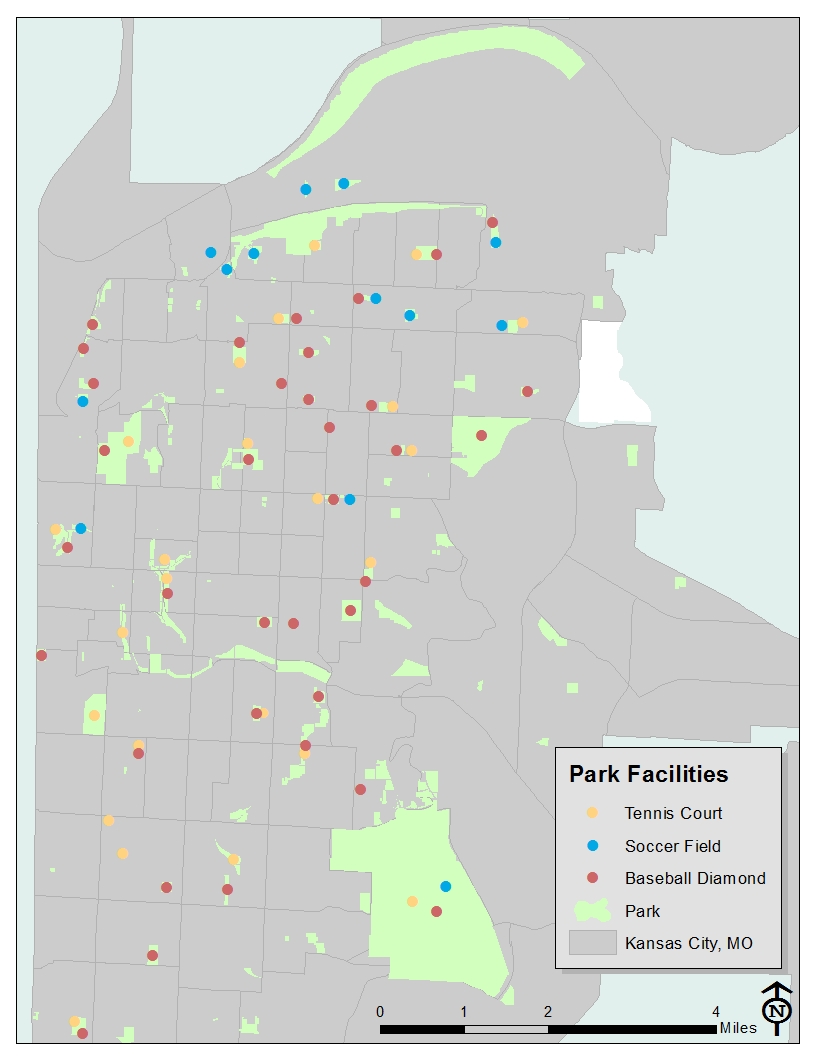
What’s interesting here is that the age breakdown of park users largely matches that of the Kansas City population in general. So in terms of age, Kansas City’s parks seem to adequately serve each group of residents. I also ran the distribution of park acreage across the city through a test in our GIS program — it came back as “random,” meaning there’s no measurable spatial clustering. (I did not include huge Swope or Riverfront parks in the test, to be clear.)

But different age groups are dispersed a little differently across the city.

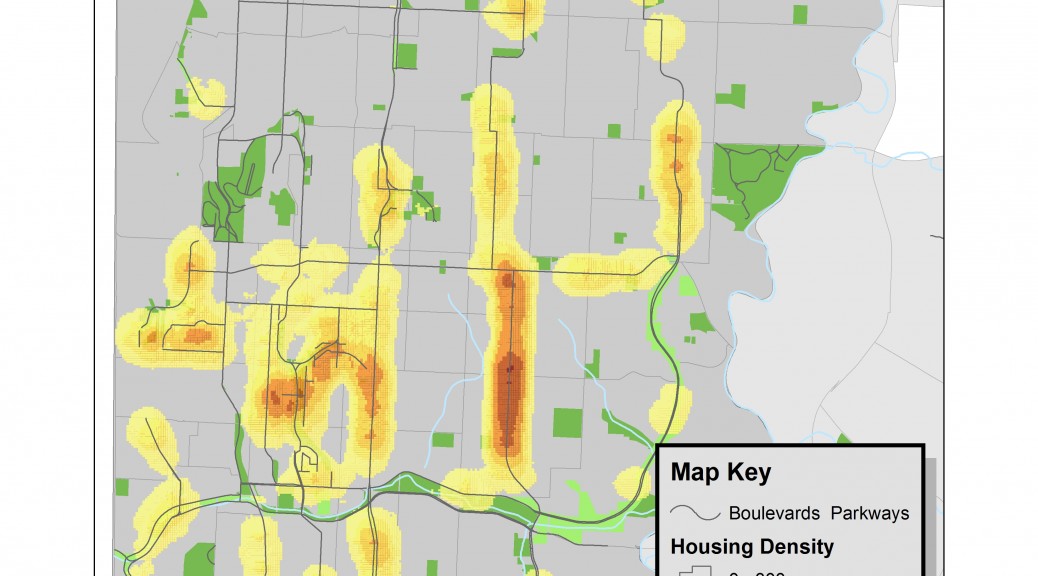
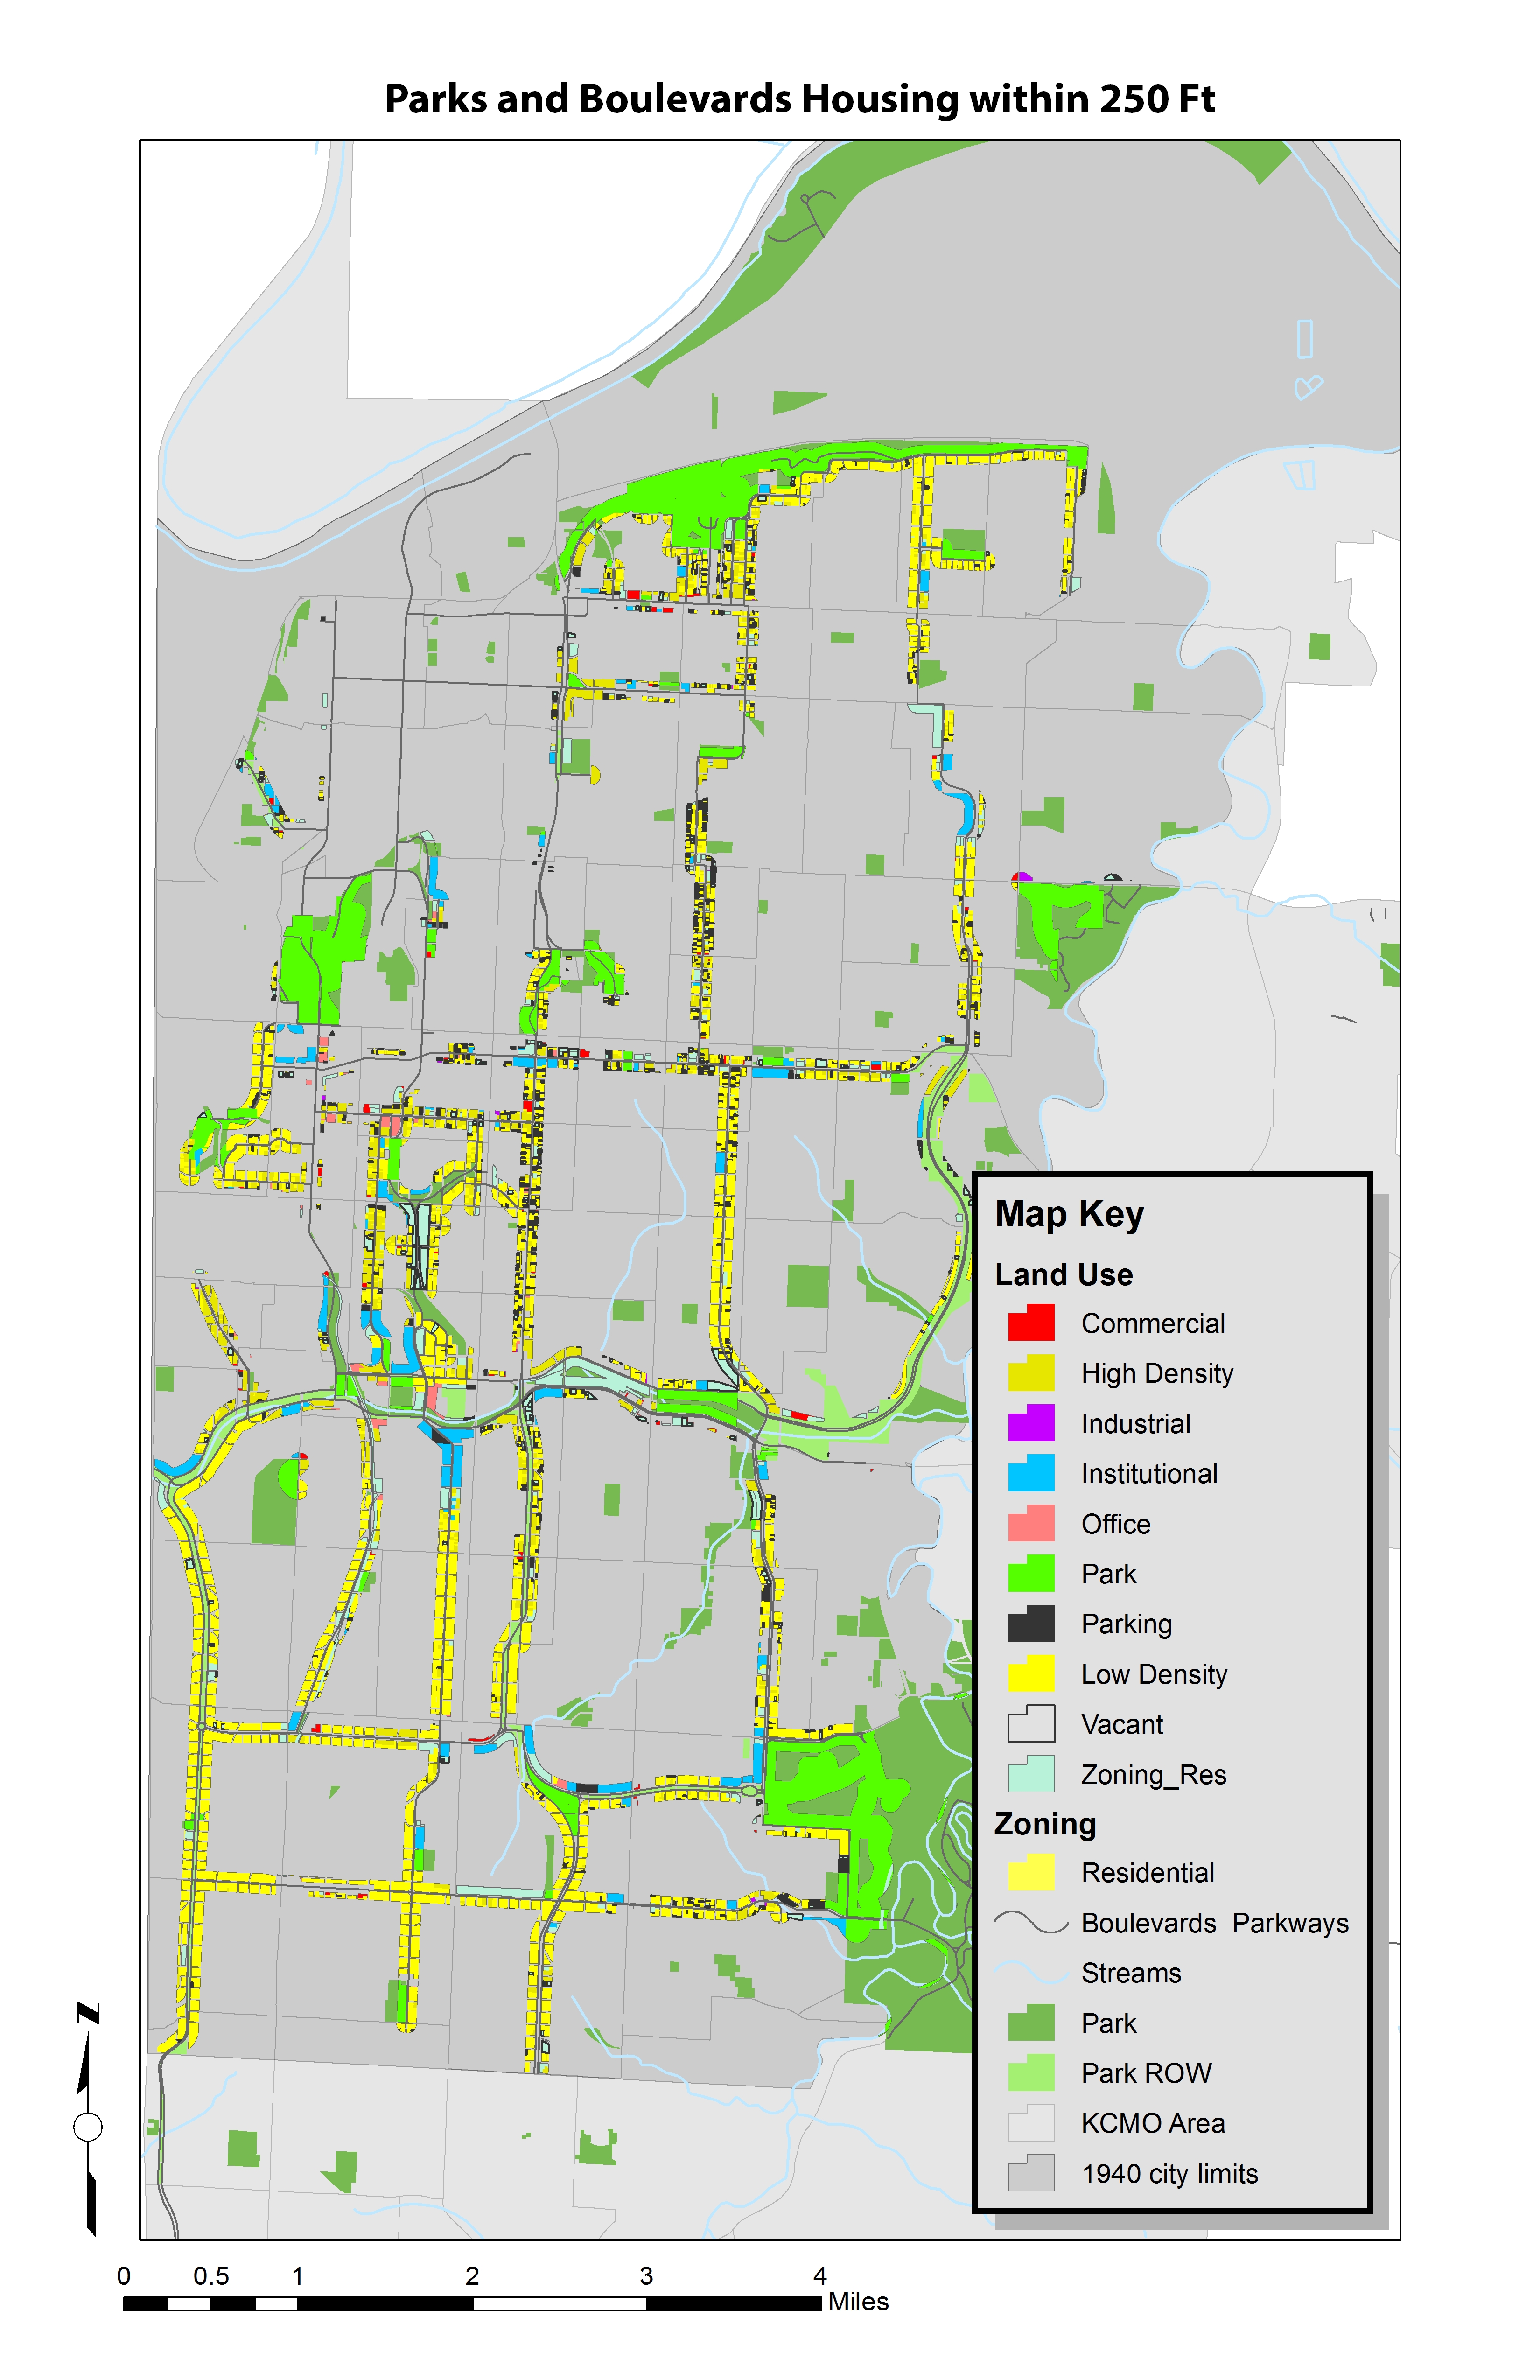
The youngest people — those who might use playgrounds — are more concentrated to the east and north of the 1940 city, as seen in the two maps below.

age - prekage - k-8 pop


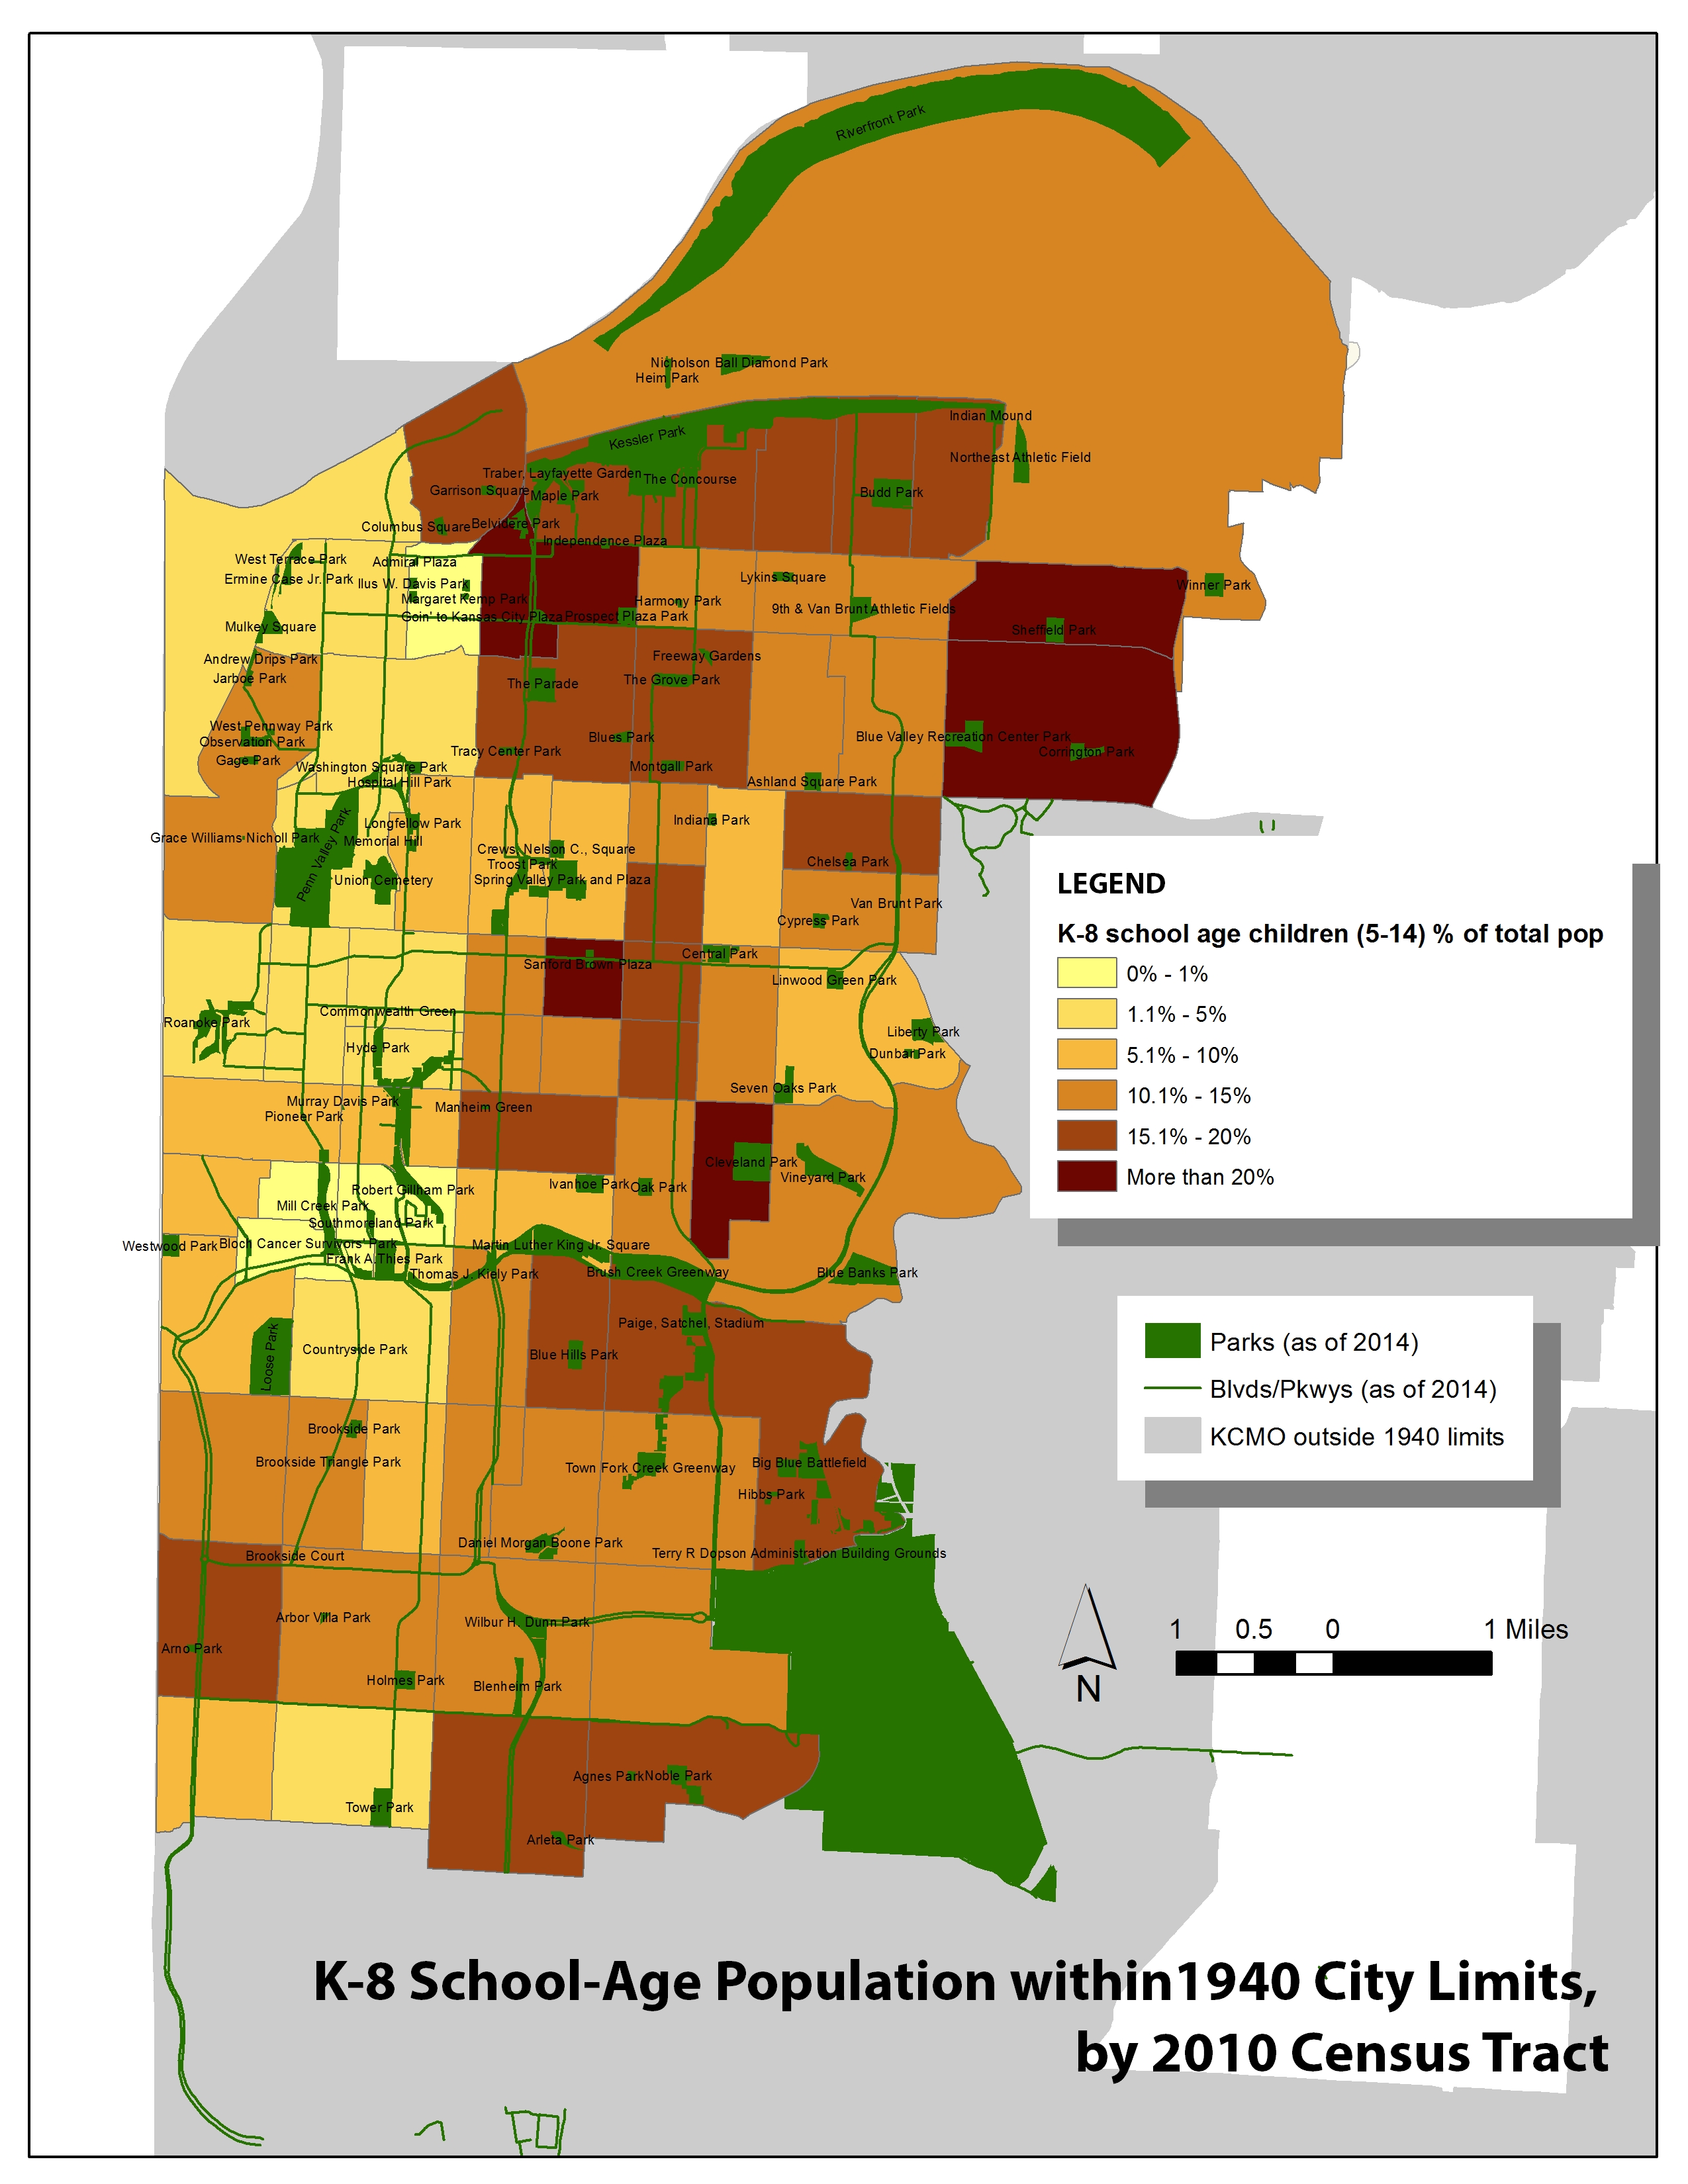
Many of the tracts where more children live have parks; some don’t, though. (I’m working on getting playgrounds into a map to see where they land.)

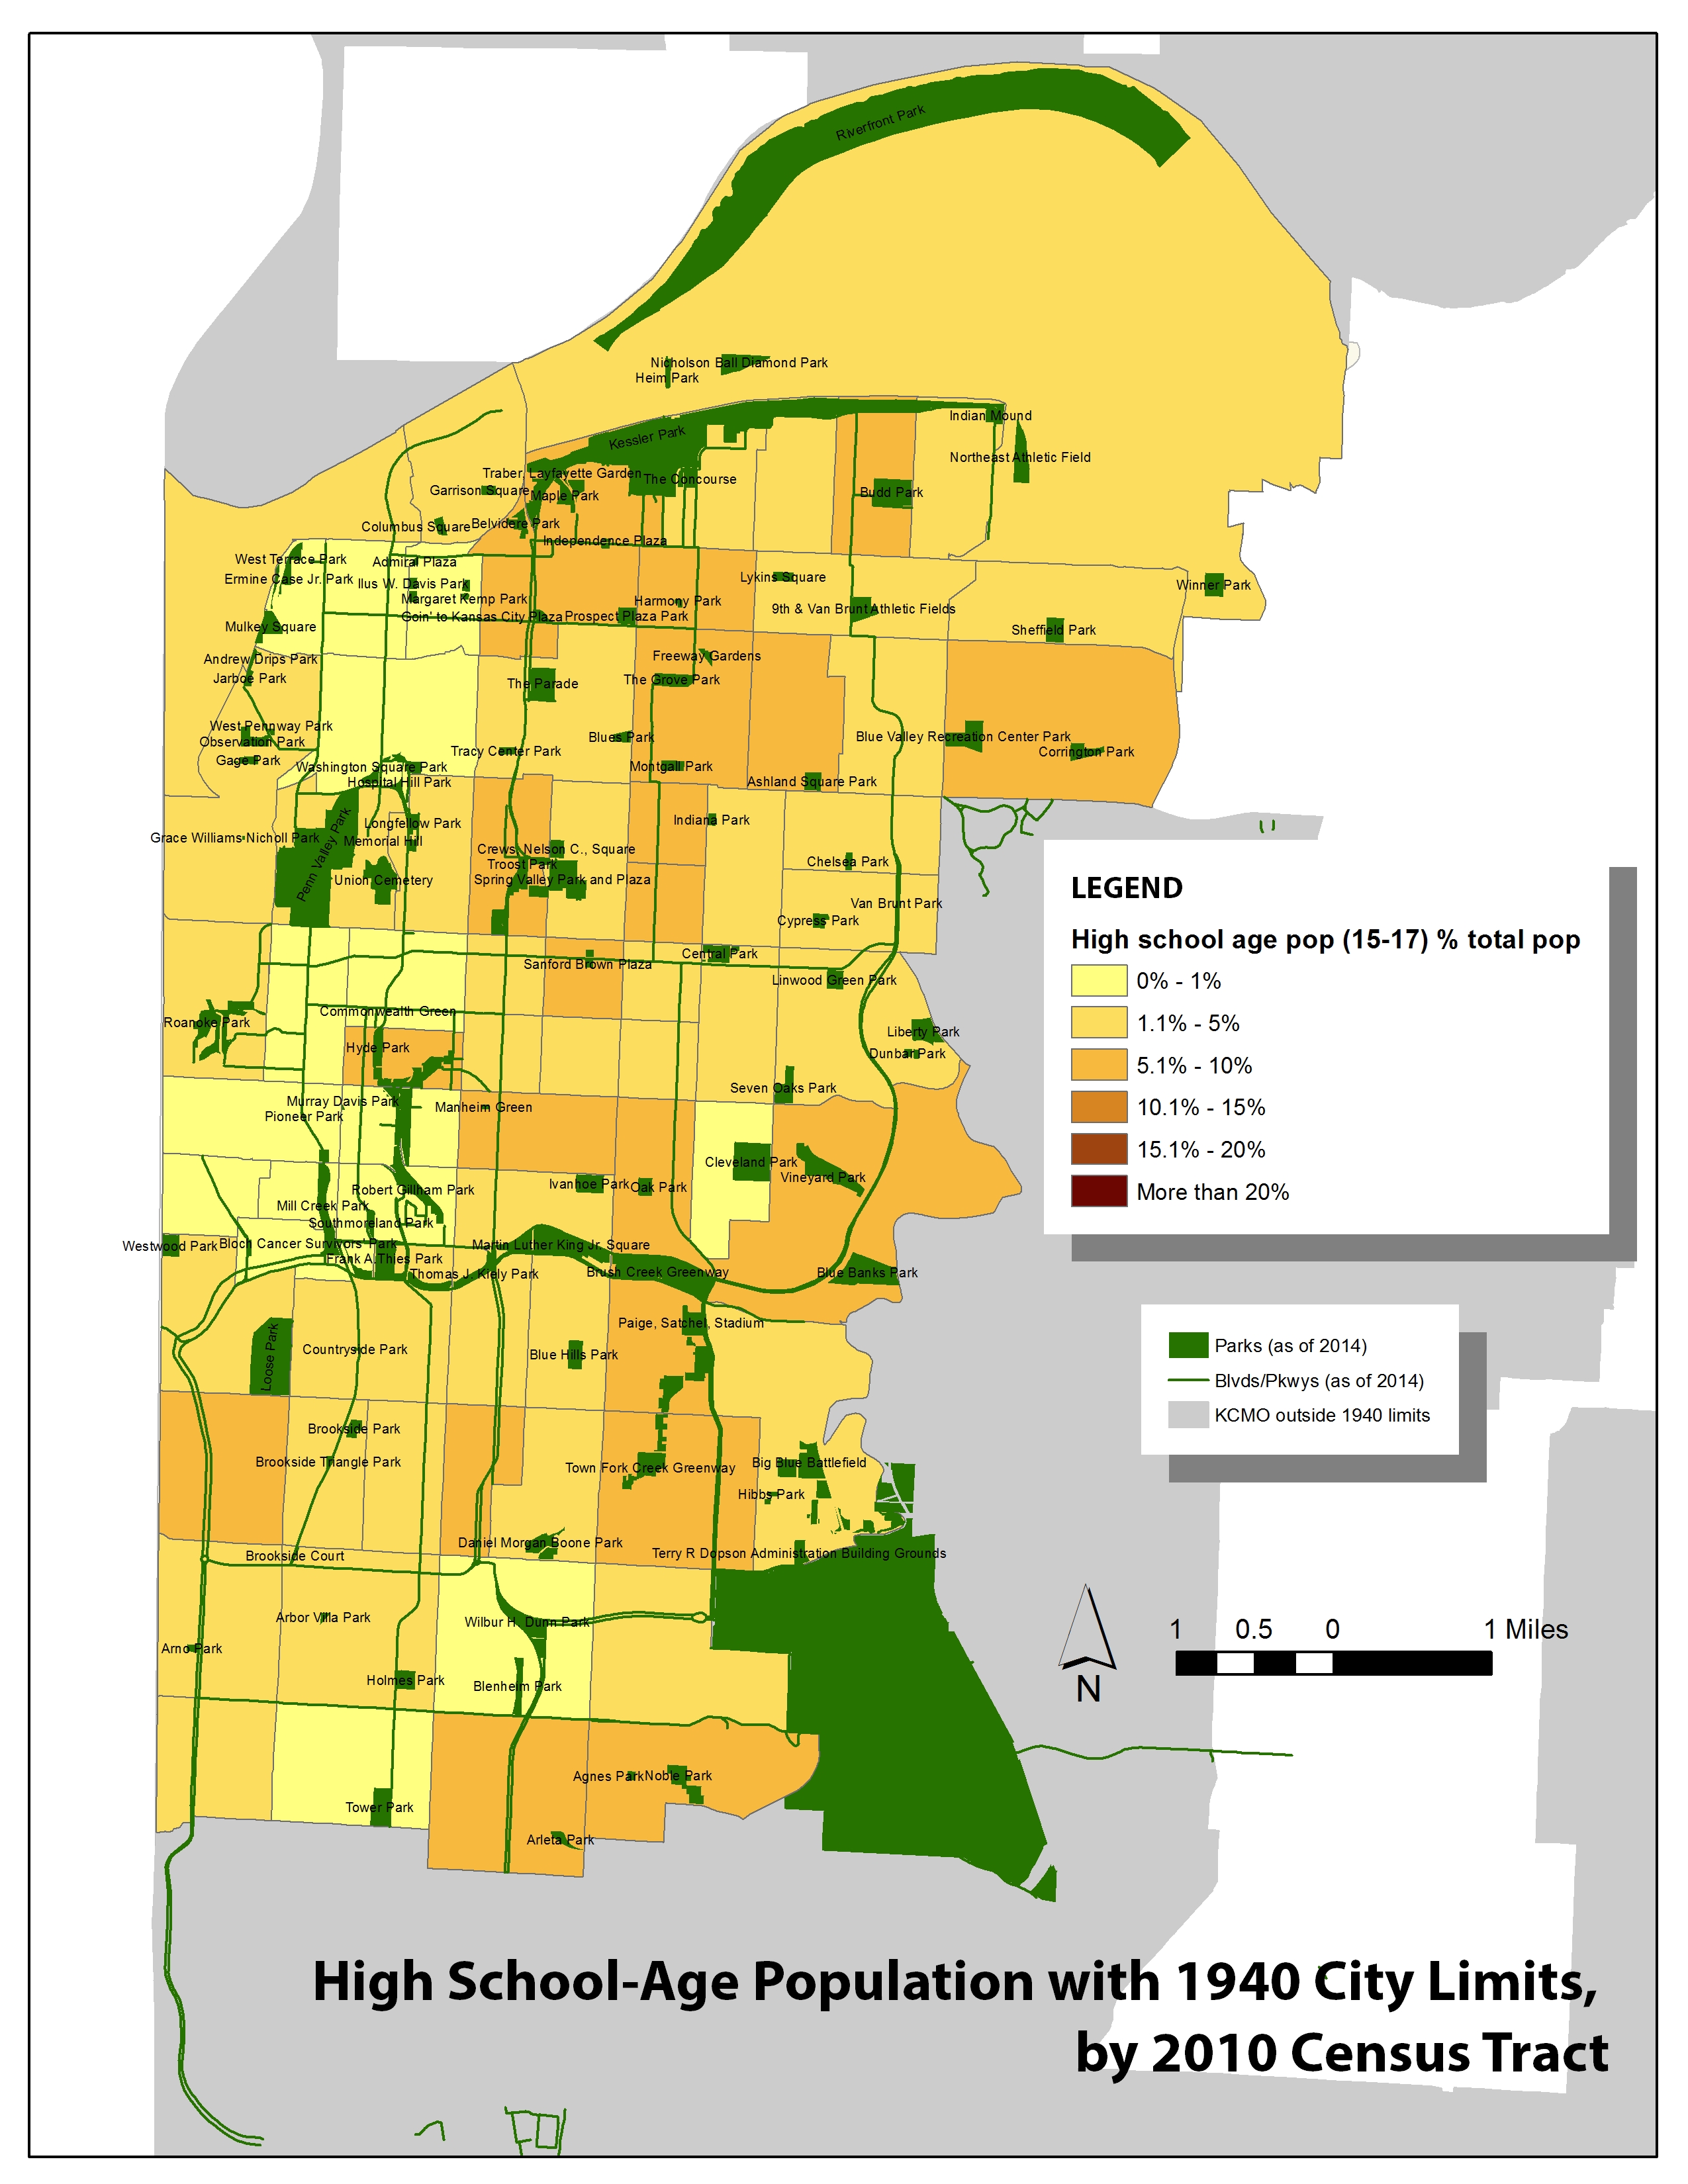
High school-aged Kansas Citians, who might use park differently, are concentrated the same — though there are simply fewer of them.


age - high school

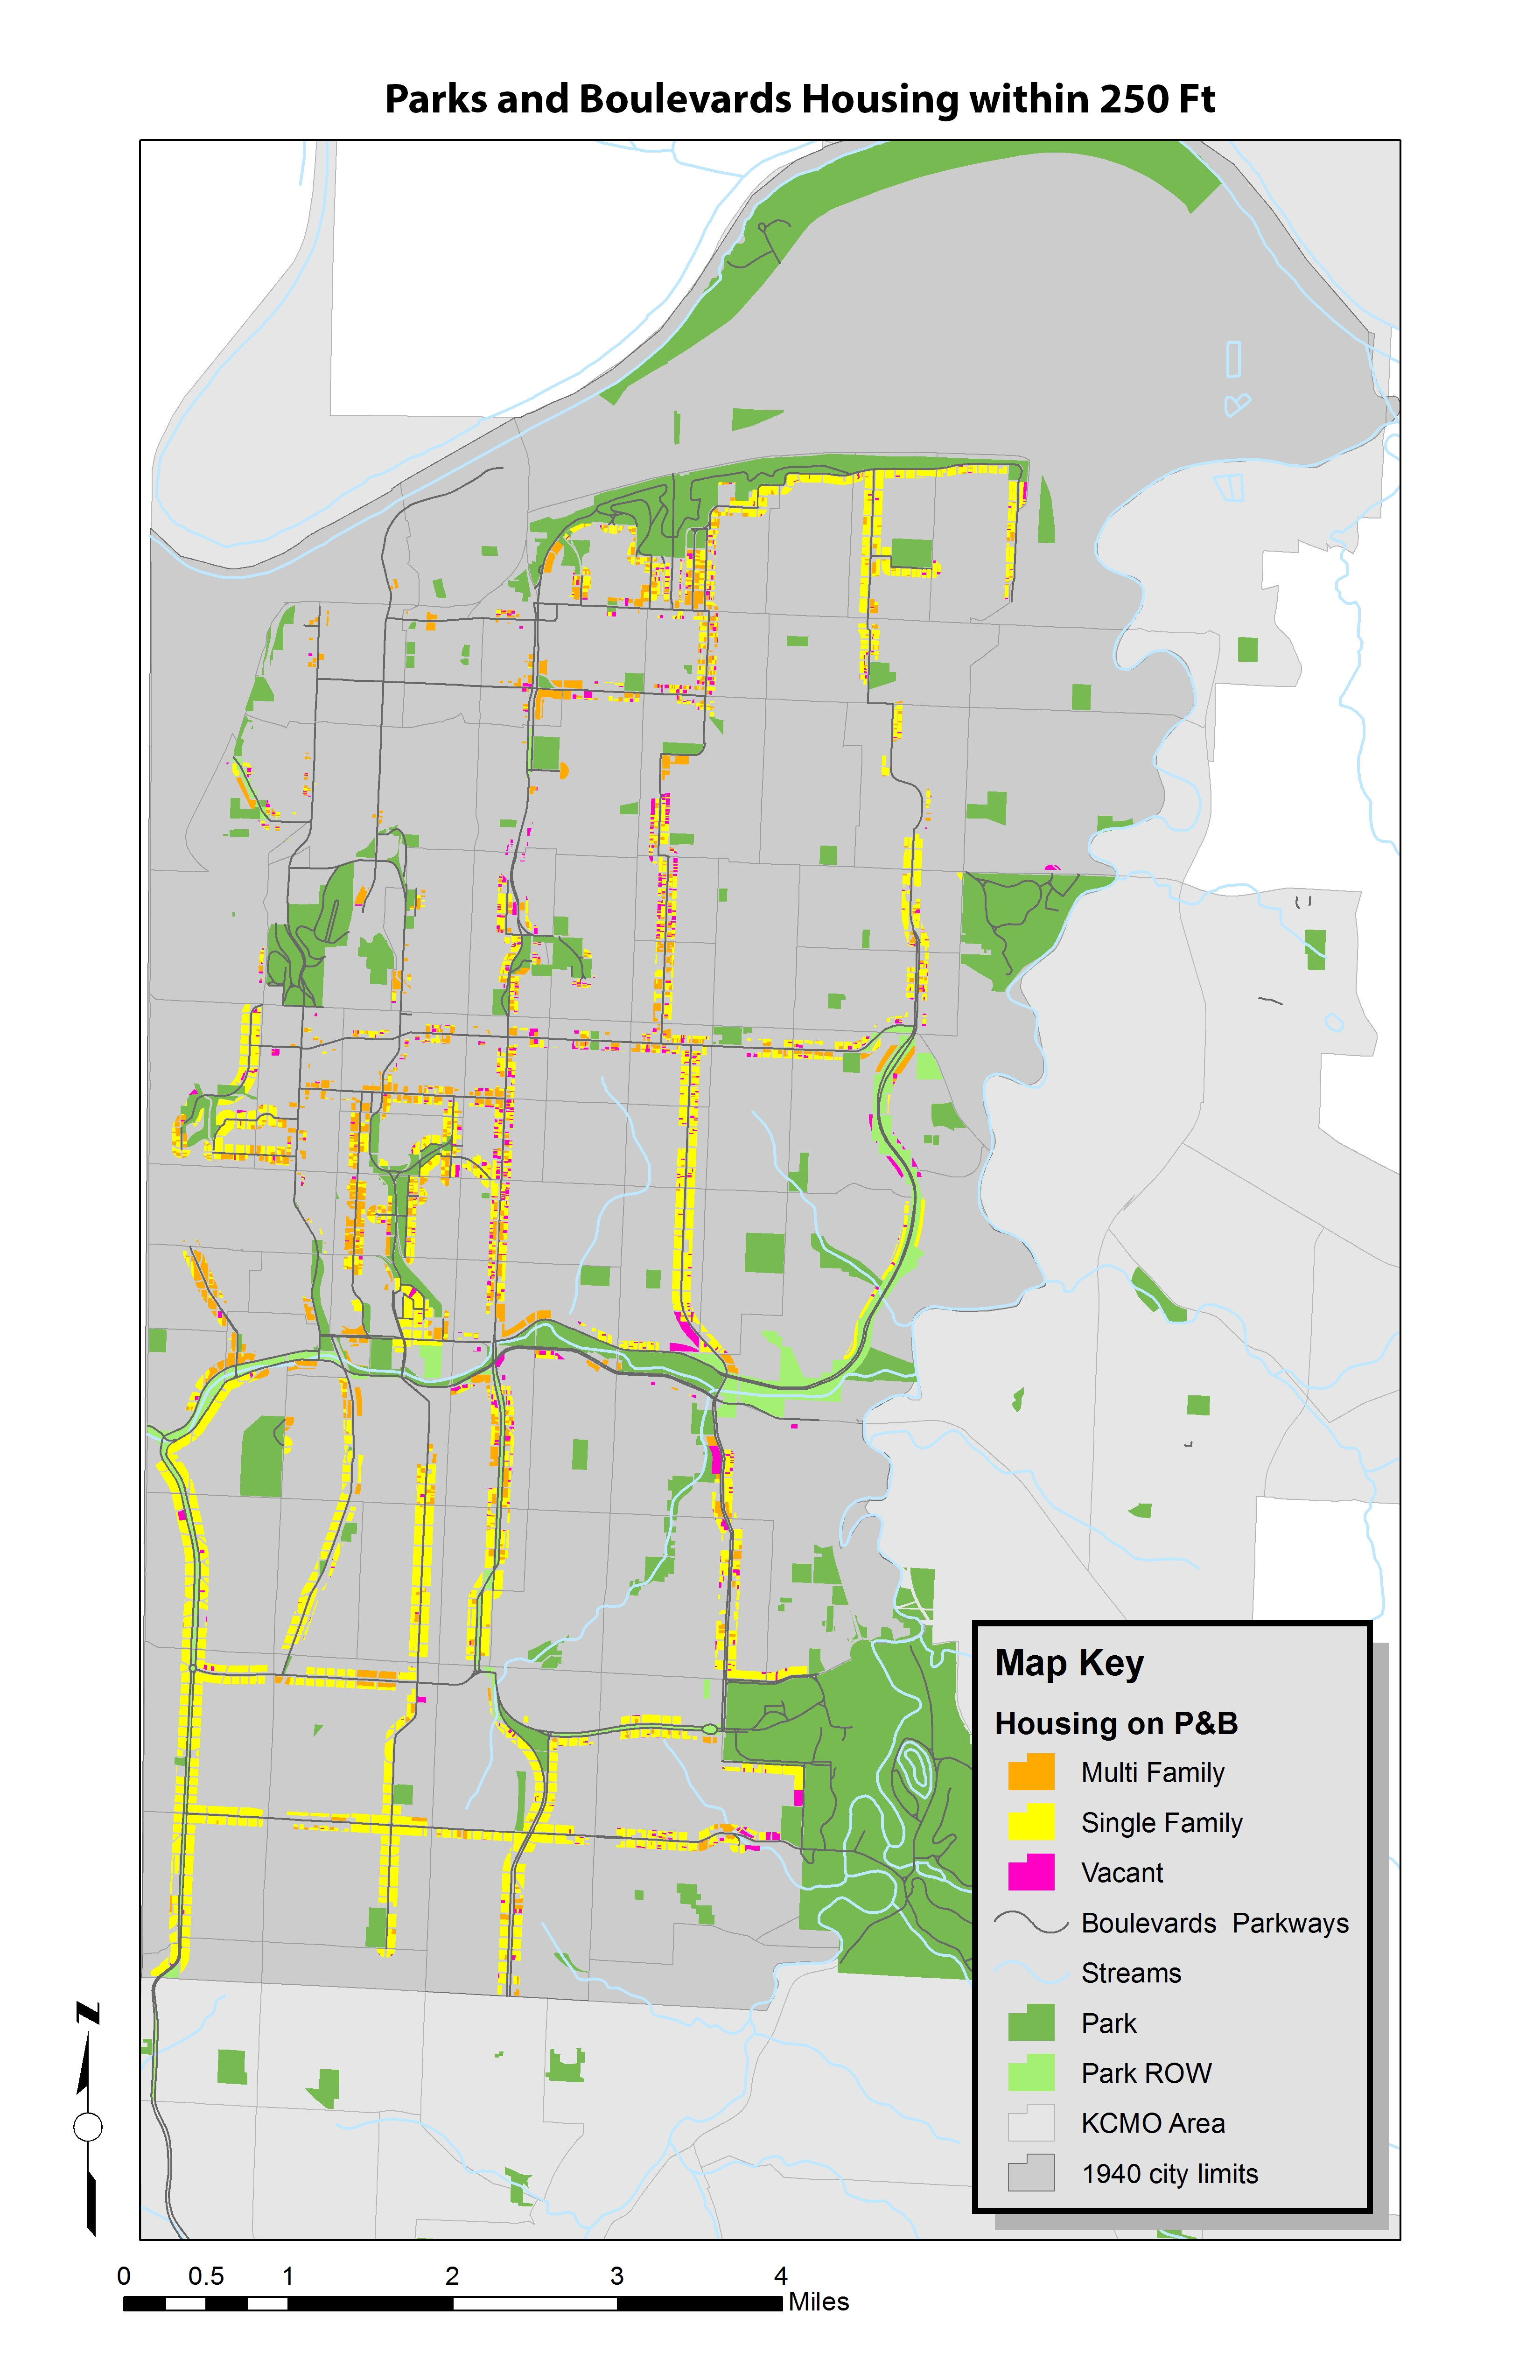
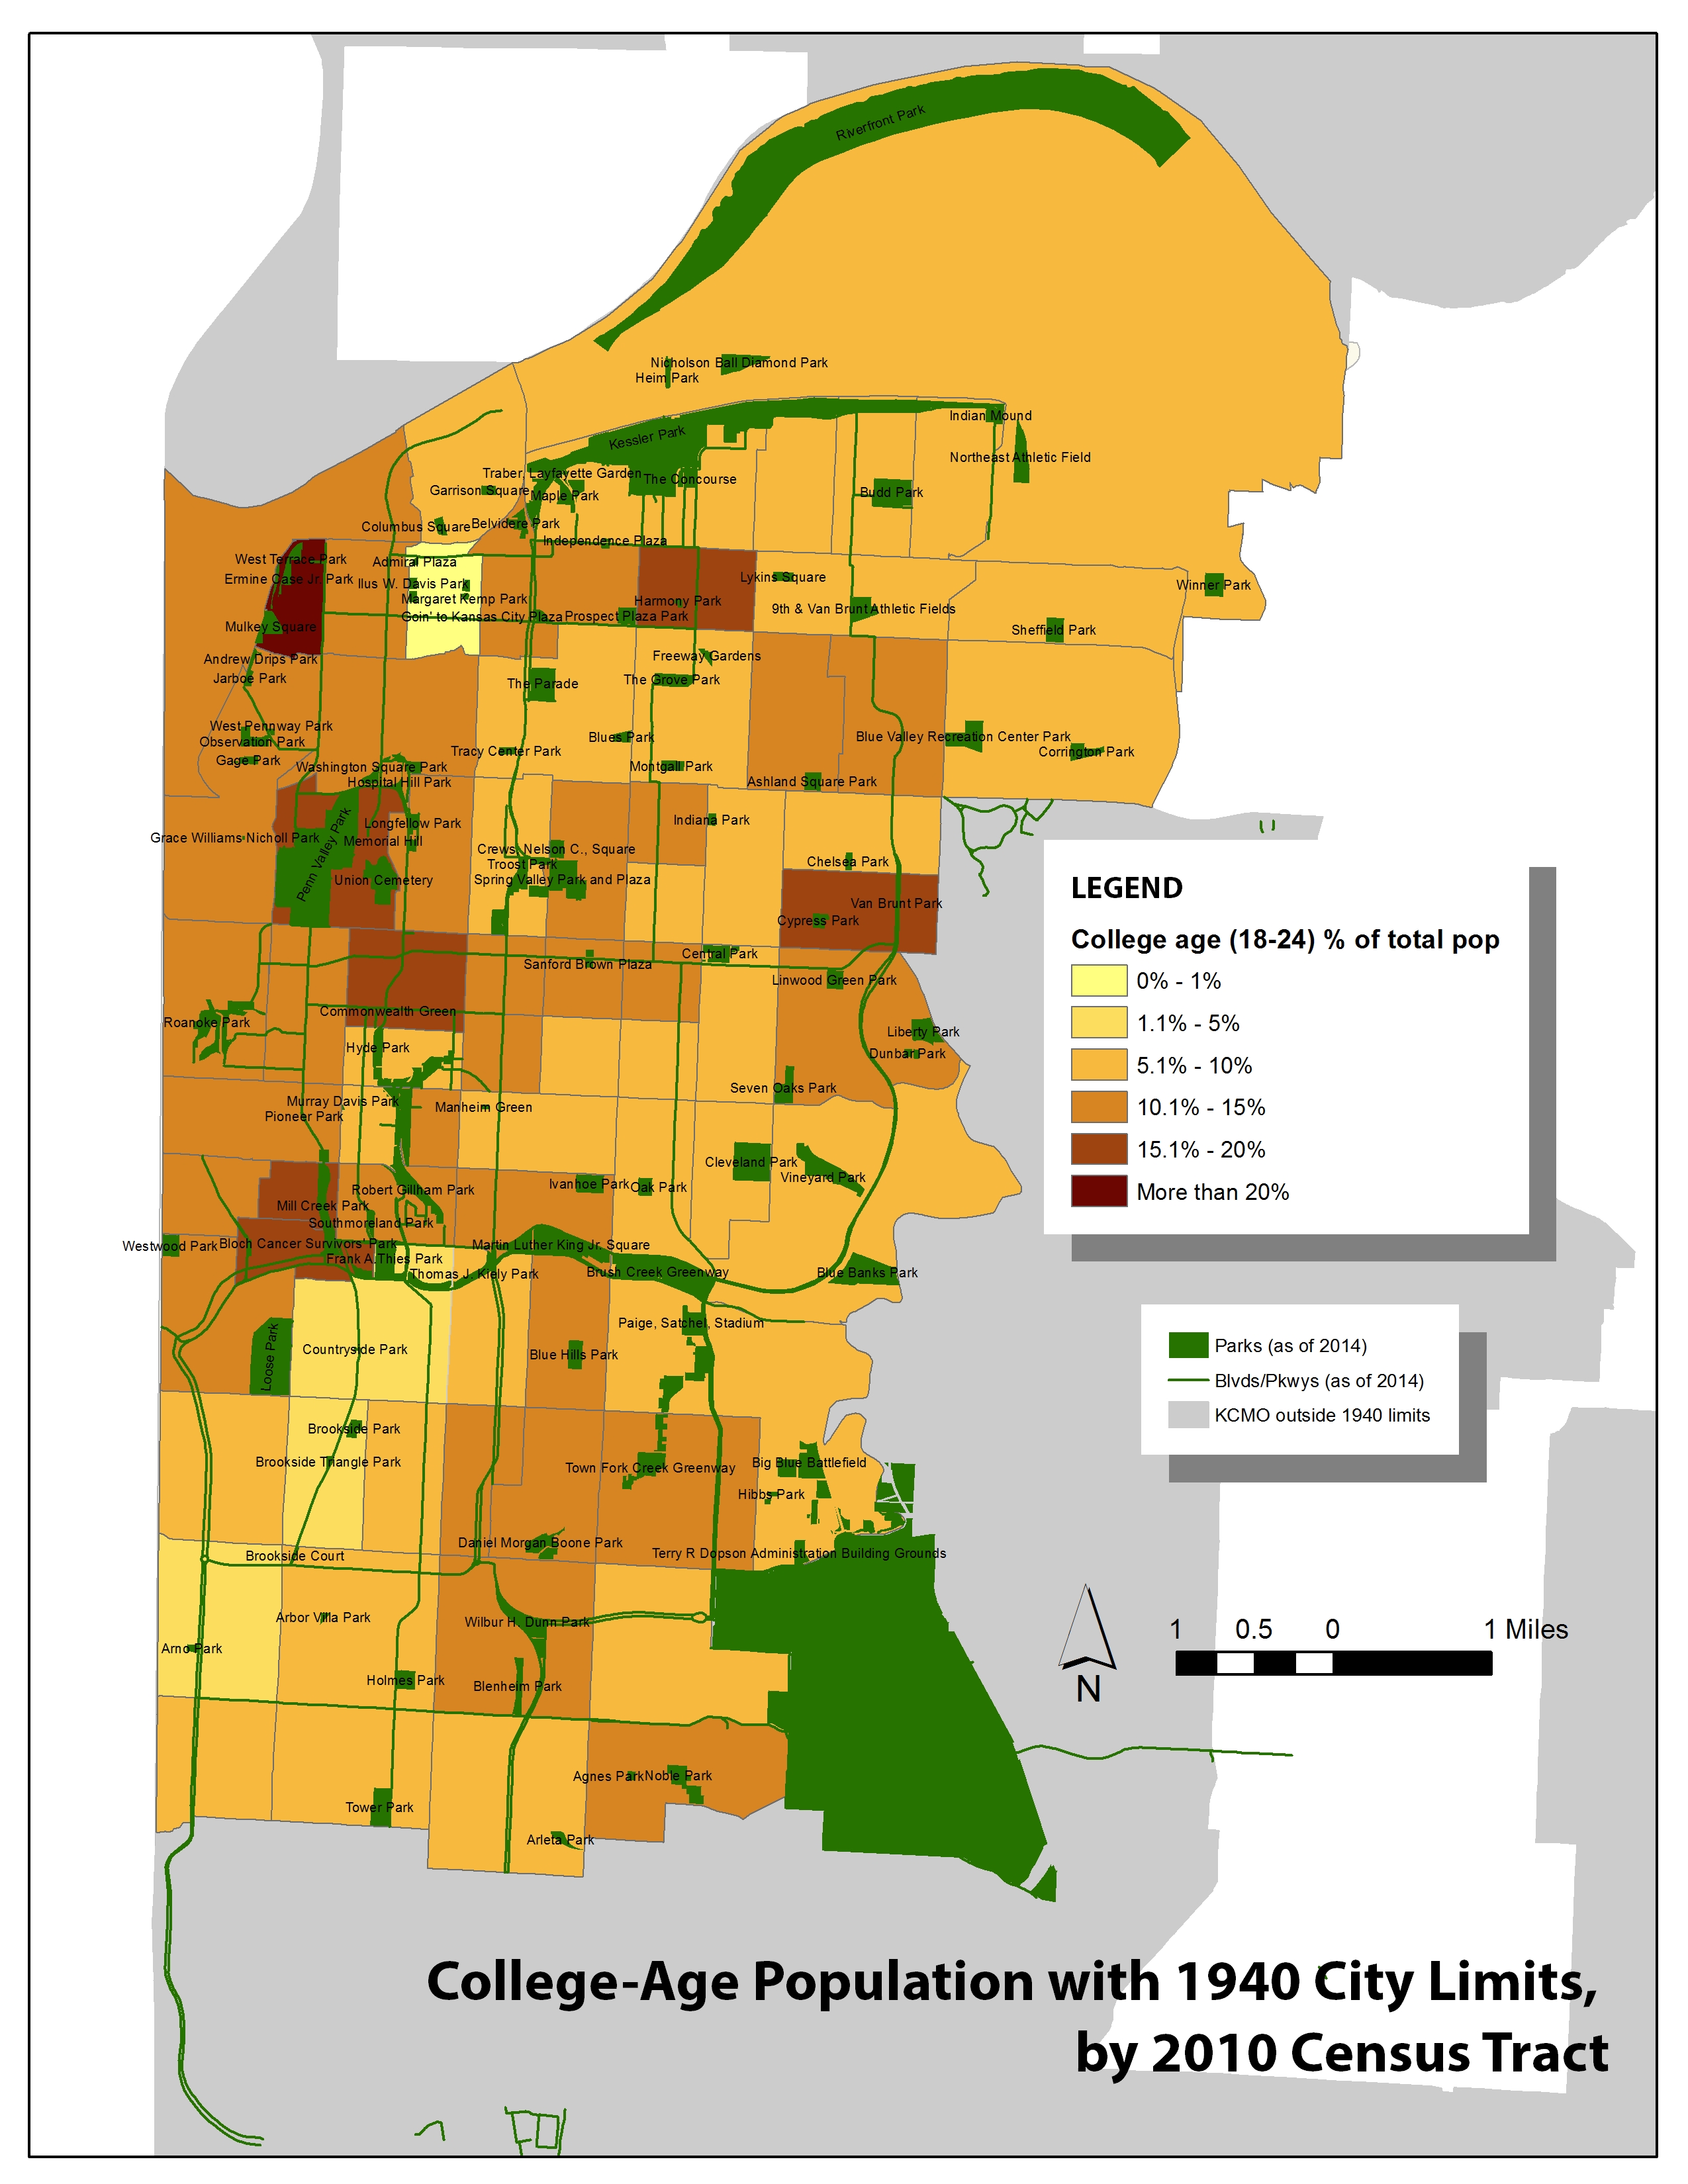
College-age residents (which is not to say college students, necessarily) are skewed more the north and west of the part of the city we’re studying. In fact, they seem clustered around some of the city’s most popular parks, like Penn Valley and Mill Creek. It’s doubtful that this age group is choosing to locate around parks specifically — but what about these popular parks affects the neighborhoods around them such that these young people want to live there?

age - college

Young adults, which I’m defining as people aged 25-34, appear more spread out. (There are more of them — it’s a bigger age group.) The most popular area for this group is the Roanoke neighborhood, which is centered around Roanoke Park. age - young adult

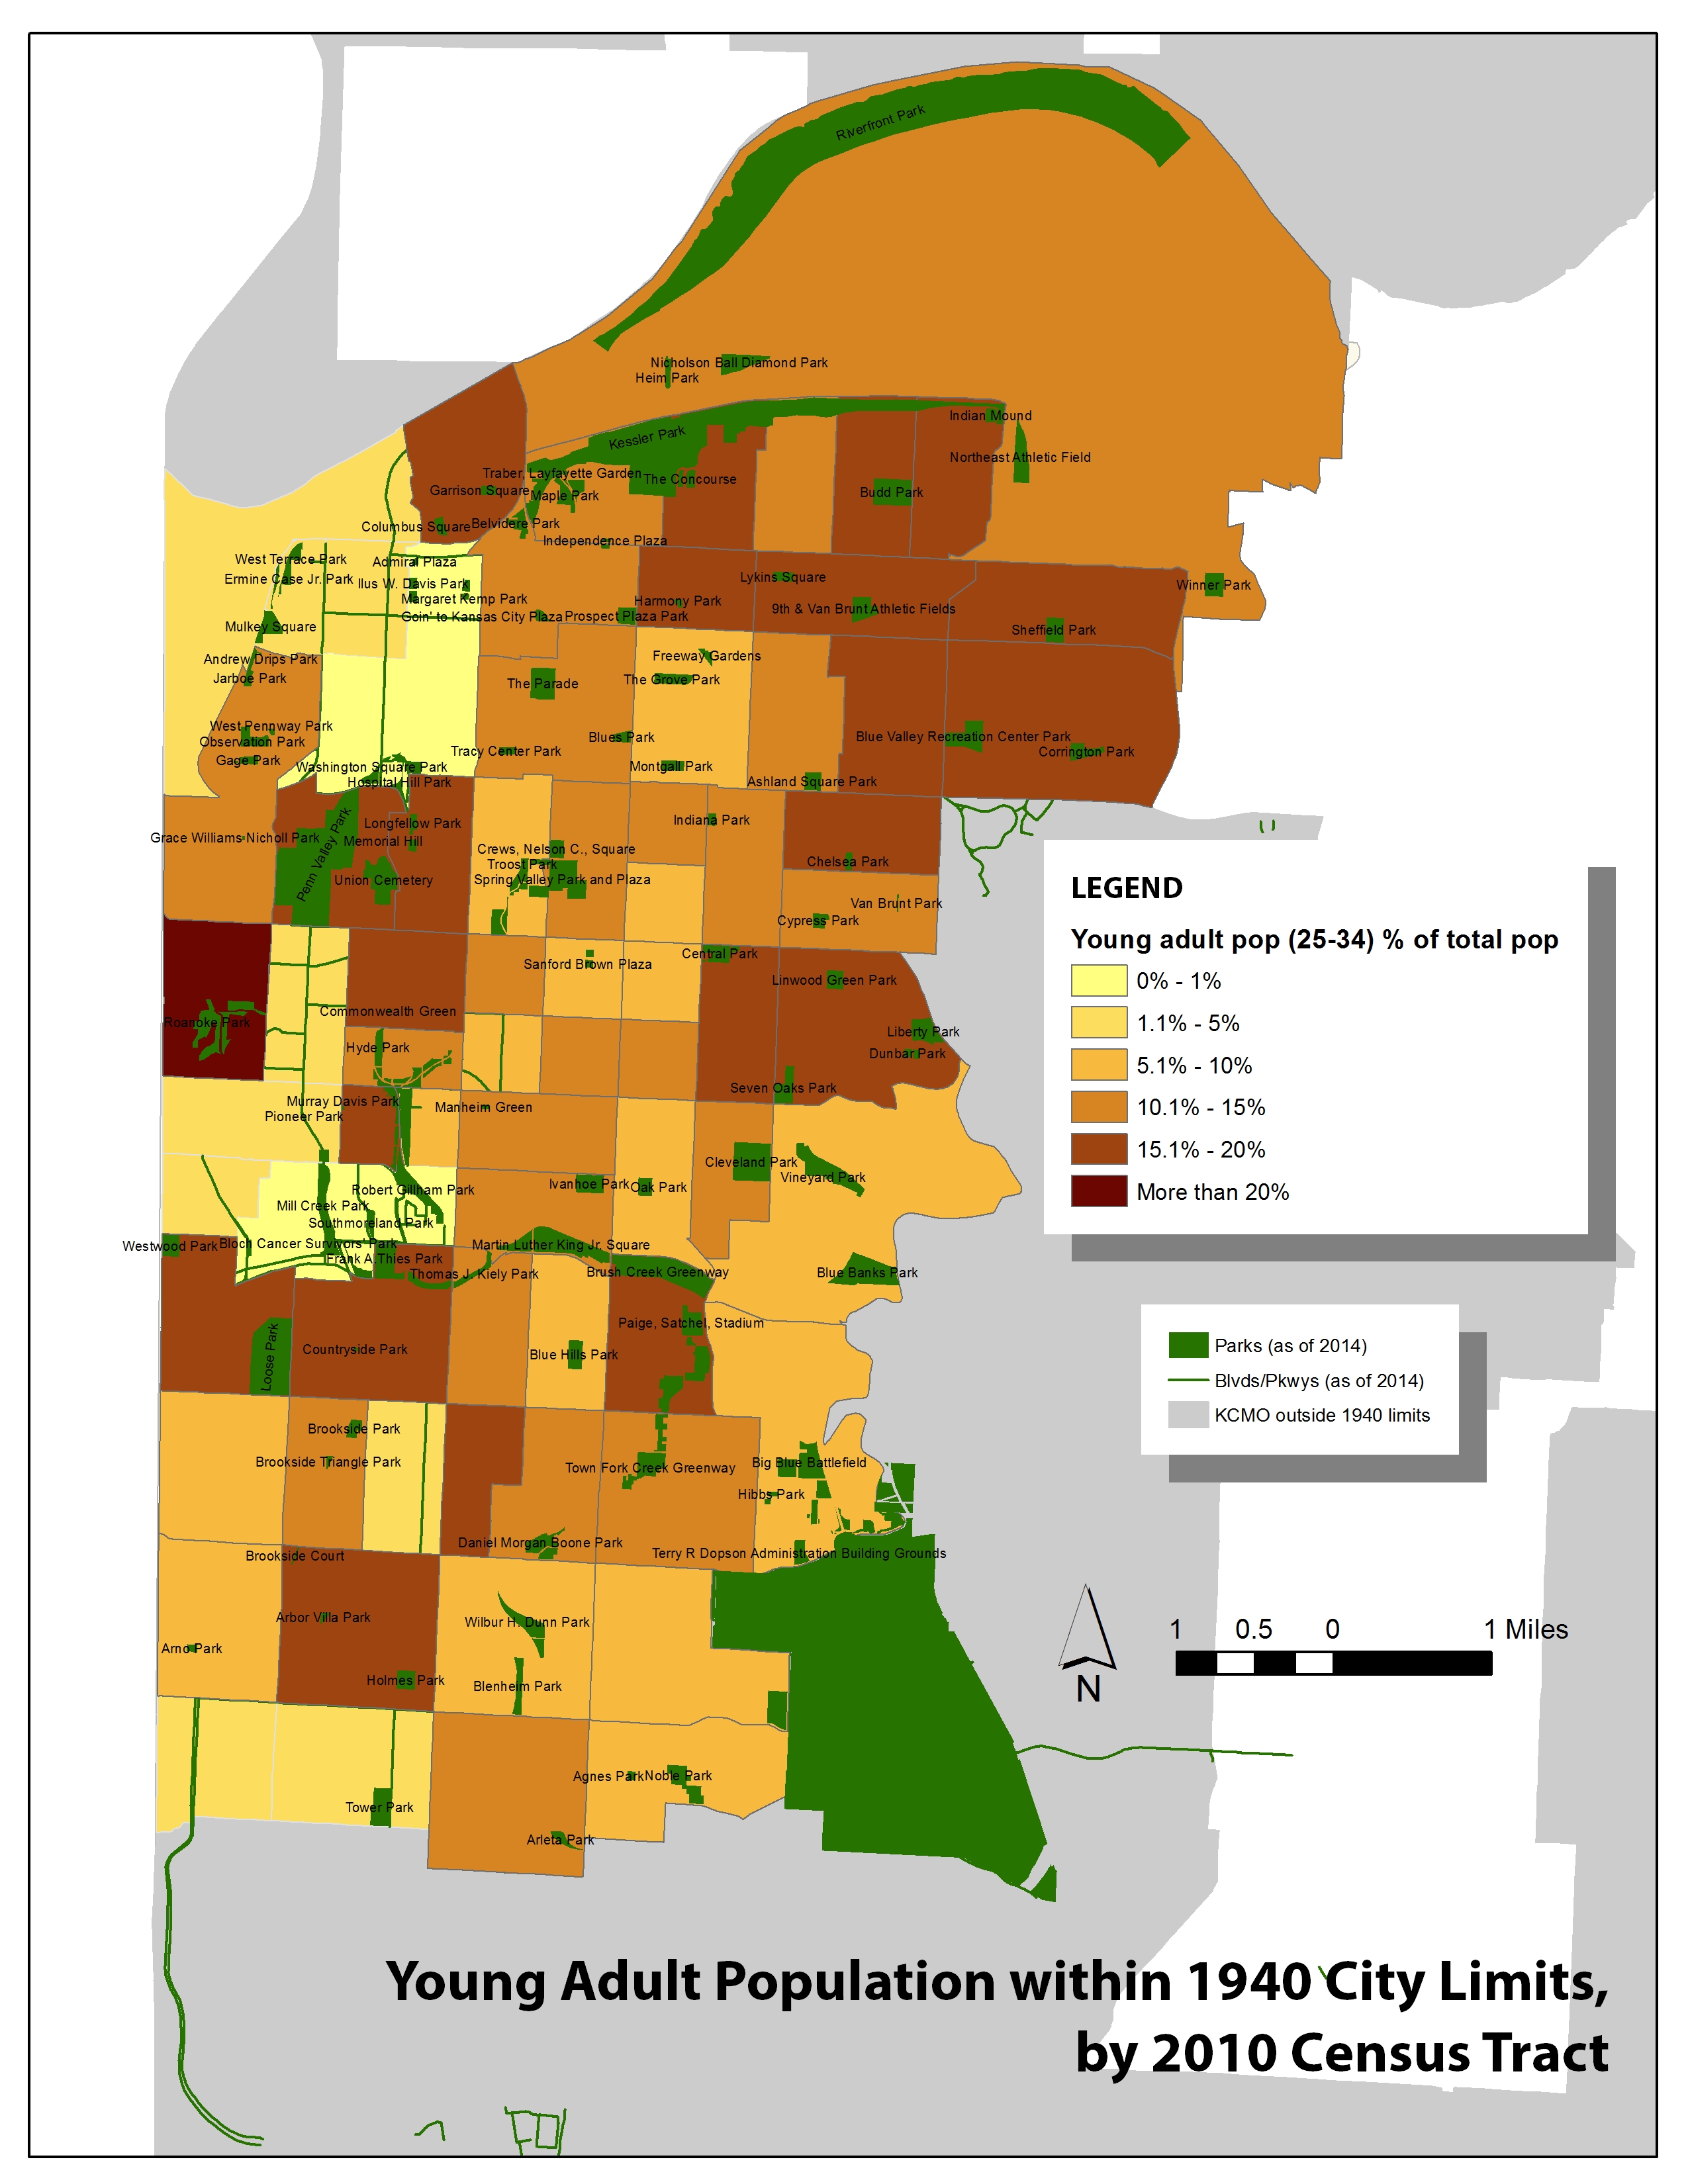
The population aged 35-64 is skewed a little towards the east, not “unserved” by parks, but far from the most iconic ones. age - adult 35-64

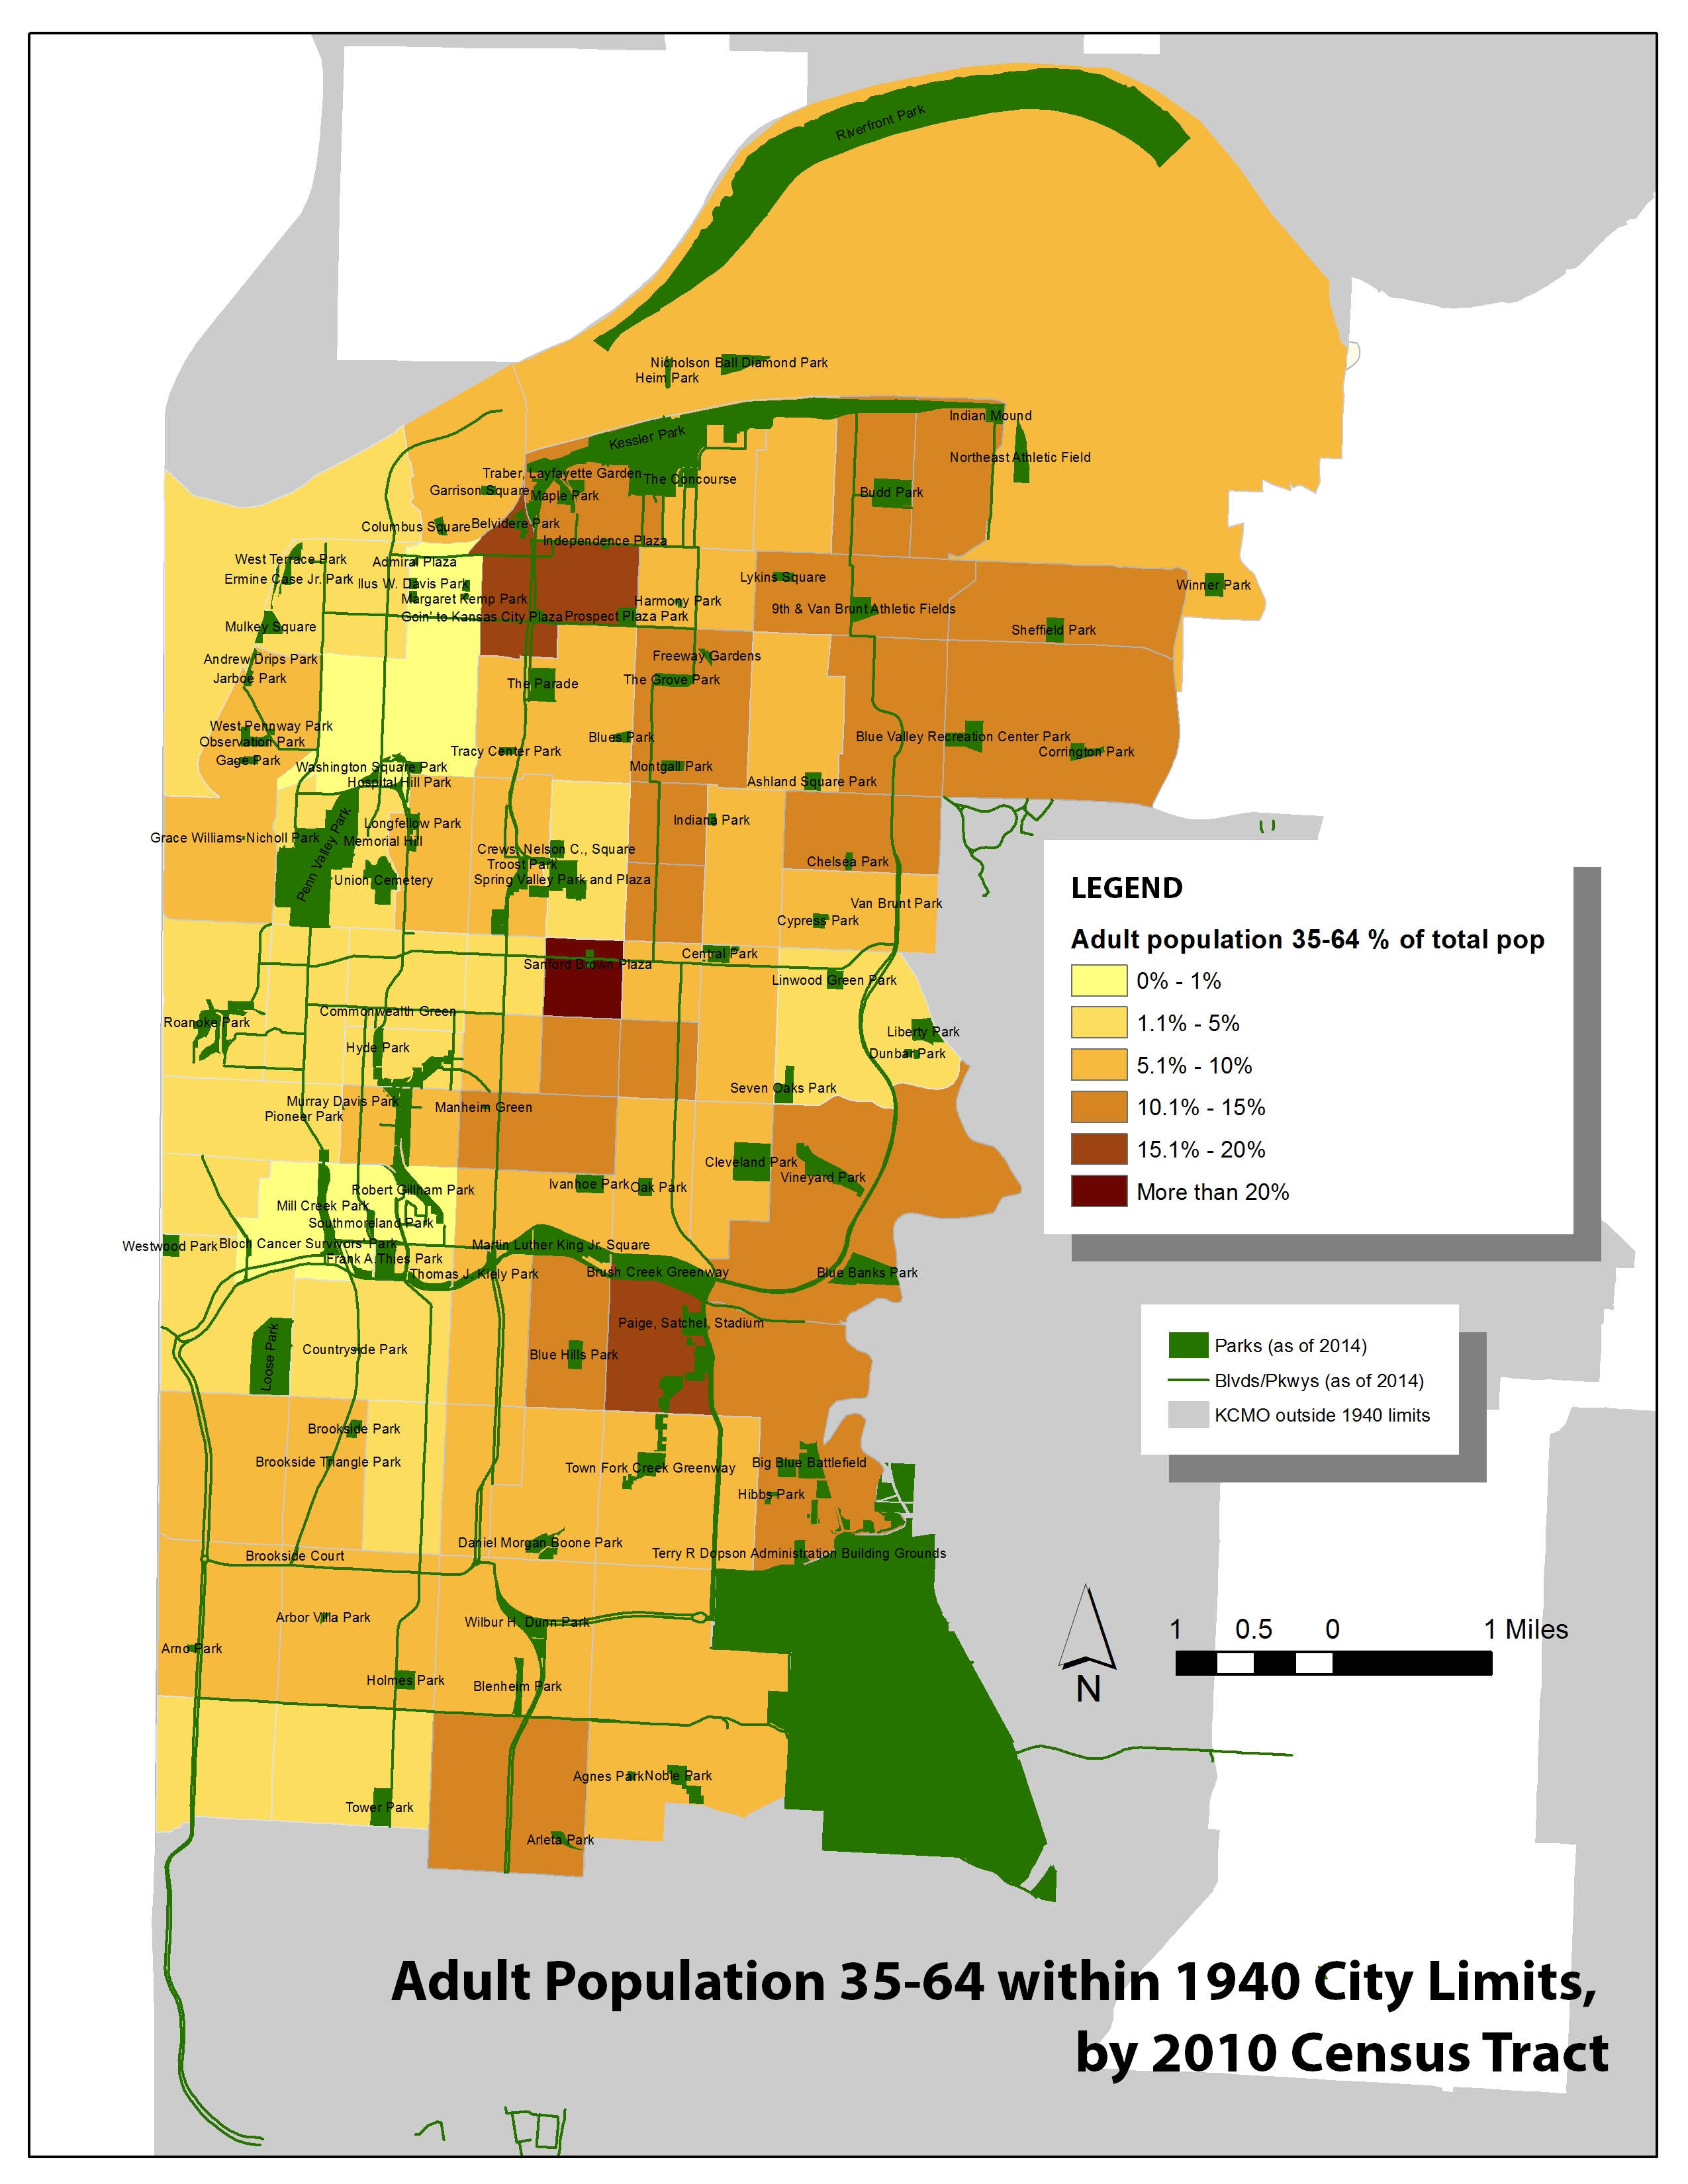
Seniors are spread out, but clustered towards the heart of the city, in areas generally served by a large park. There is also some clustering around Mill Creek and Penn Valley Park again. age-seniors


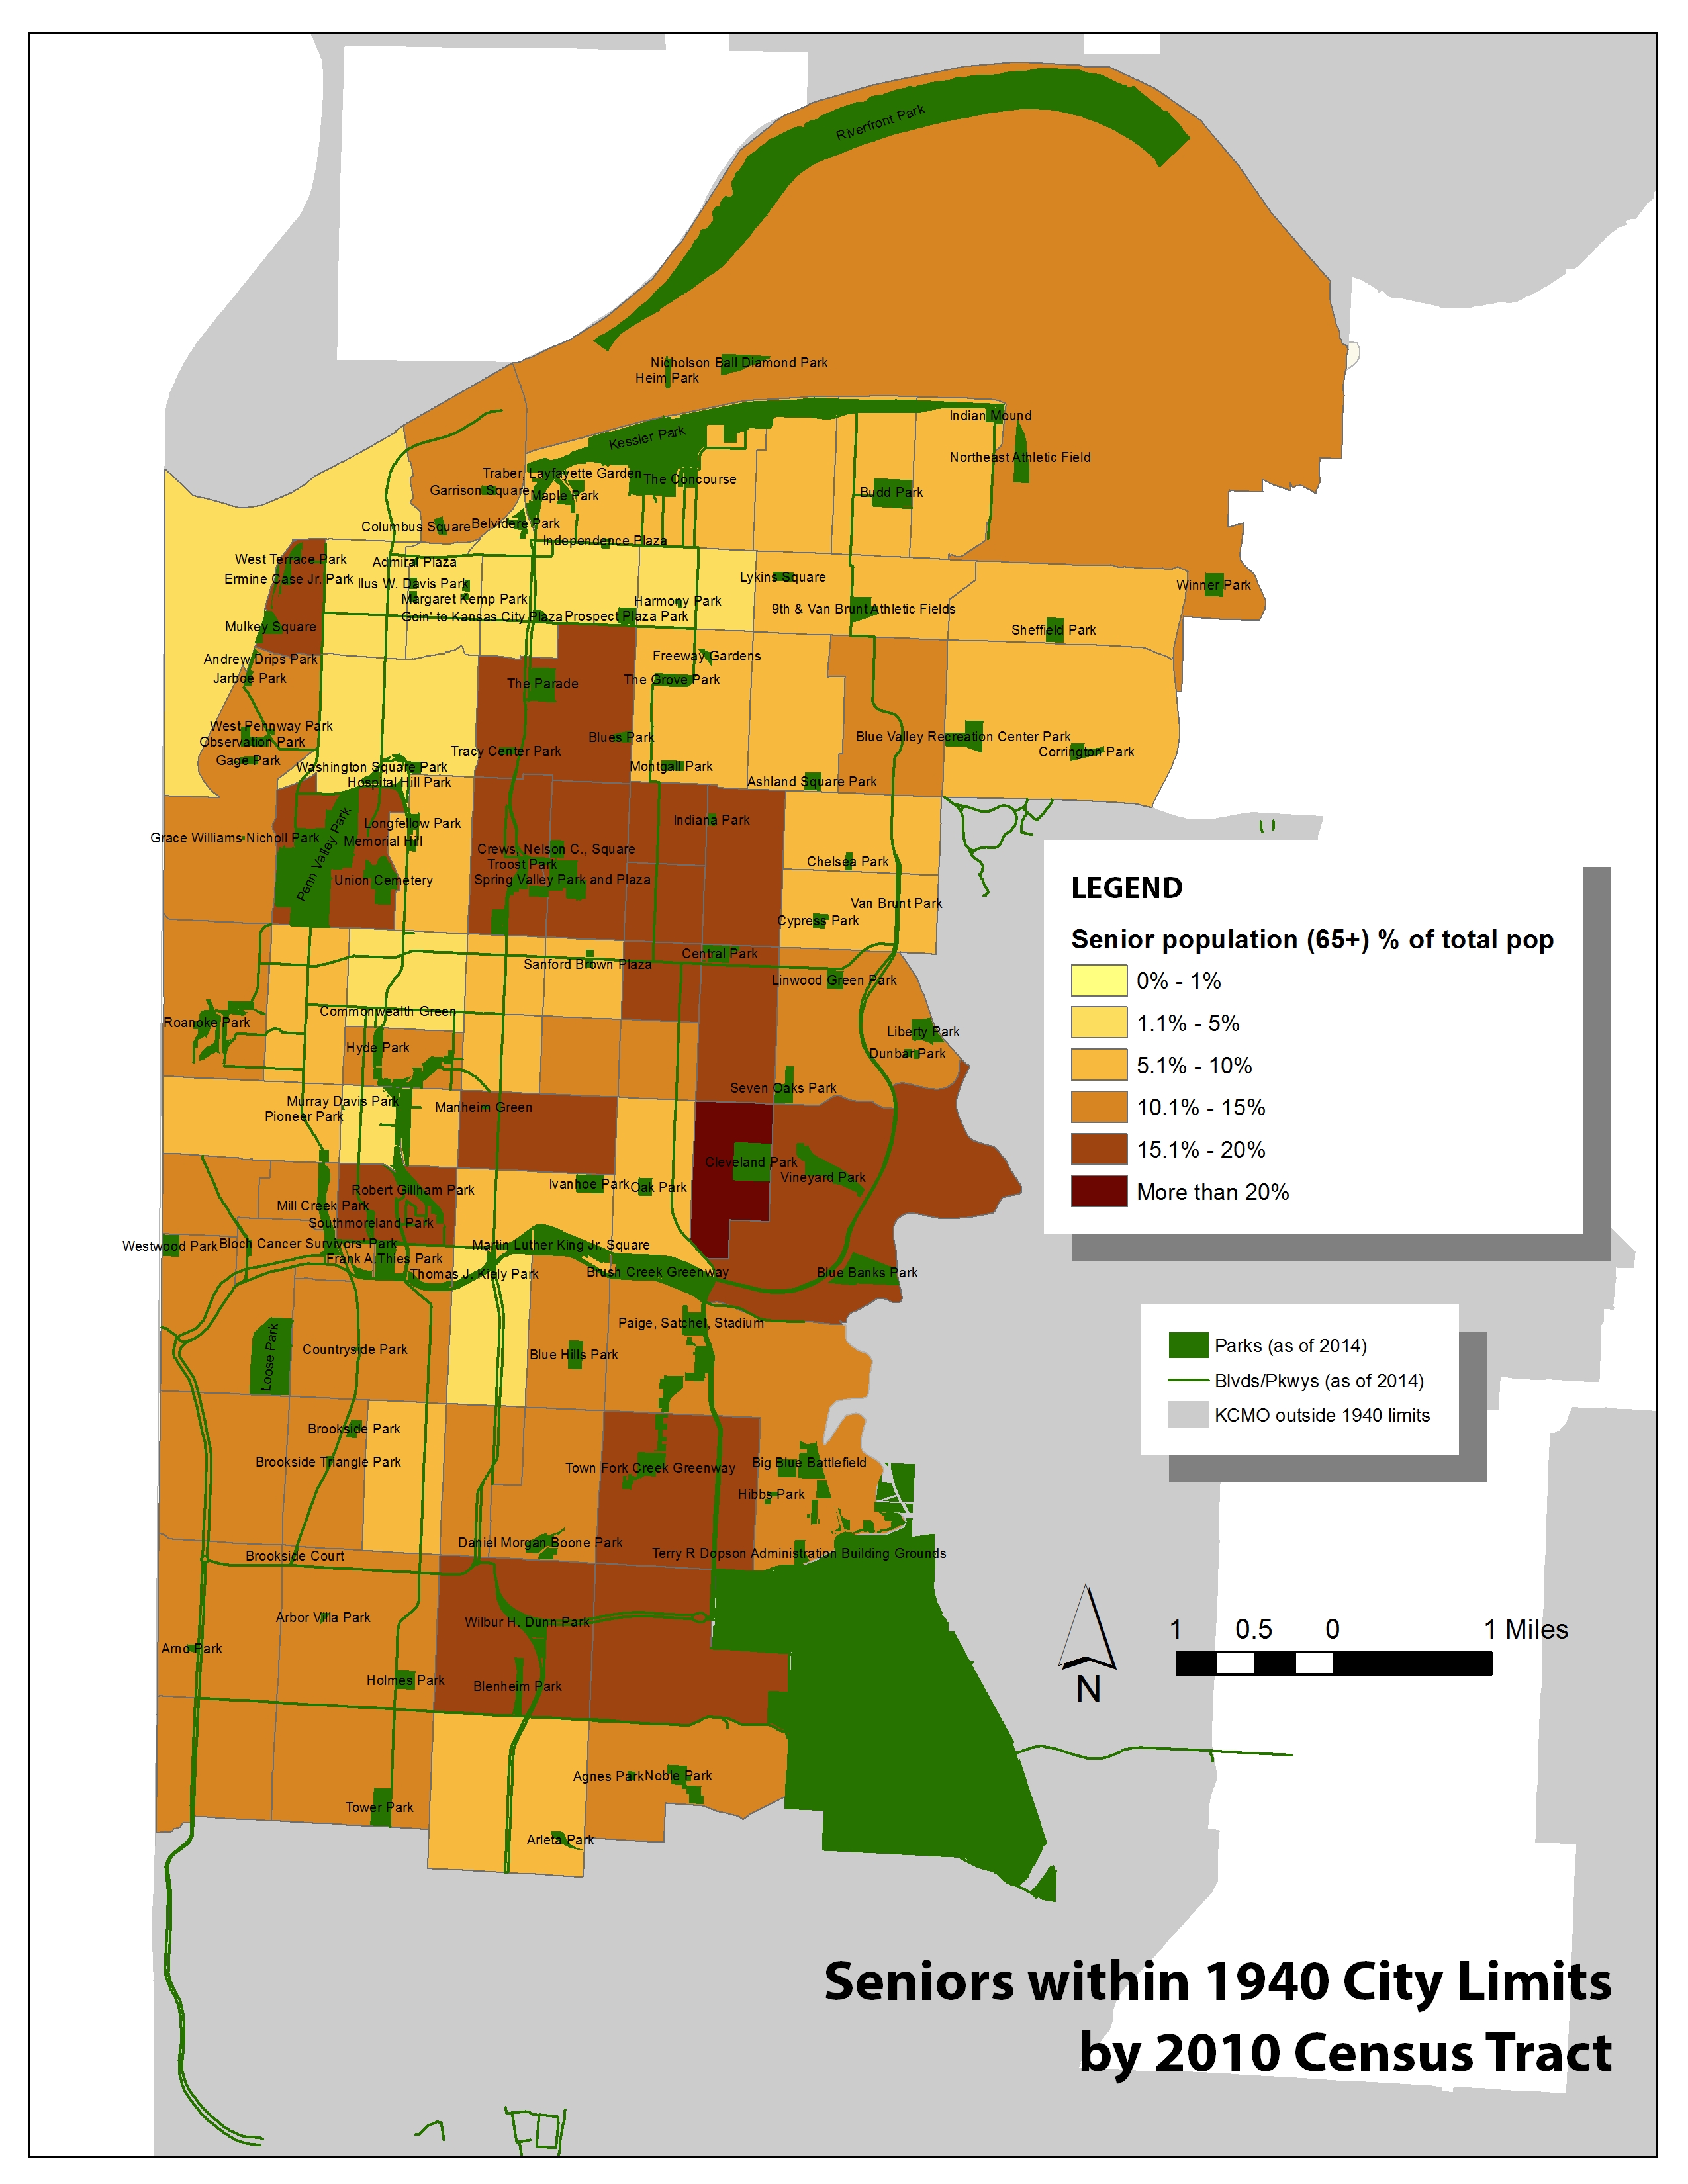
Without more data, it’s impossible to know how these clusters of different age groups feel about the parks around them. But what is clear some age groups are found are certain parks. Meanwhile, many people — many young people — appear to not have any access to a park.  More work is needed, but these patterns are a start.