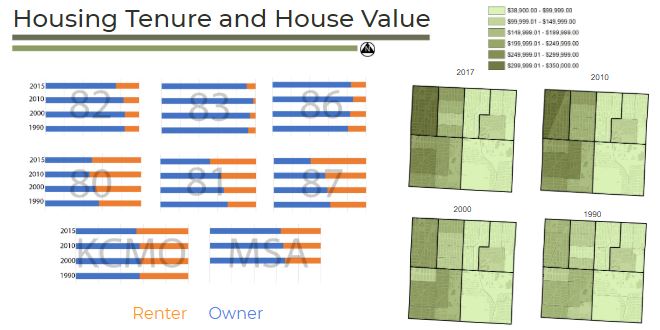
Based upon the demographic information gathered by myself and others, it became difficult to ignore the reality of the Troost divide. Glaring differences between east and west emerged when examining such things as the value and tenure of homes, access to vehicles, and educational attainment. As we began to share our findings with one another and discuss the way in which we would present the information, highlighting these differences became the most sensible way to go.

However, one of the most positive findings from our research came from information obtained from OnTheMap.gov. Figure 2 highlights the significance of the Blenheim Square Research Center. This area has provided the area with high numbers of employment which brings in a number of people from outside of the study area.
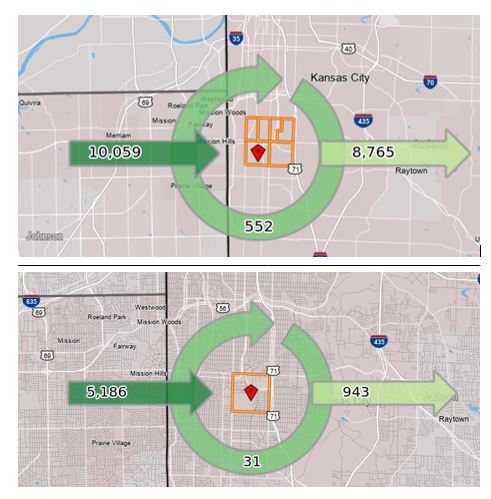
Figure 3 further illustrates this point by showing how tract 87 alone brings in more than half the amount of people who come into the area for work. 44% of these workers are employed in the health care and social assistance industry and 38% work in public administration. Furthermore, 68% of all those employed in the census tract make more than $3,333 per month (https://onthemap.ces.census.gov/). As we look for ways to improve the Landing and the community as a whole, its my opinion that close attention should be paid to how we can connect these two areas. Creating appealing spaces that will draw workers from Census tract 87 and those passing along the corridor while catering to those living in all tracts surrounding the mall is the key to revitalization.