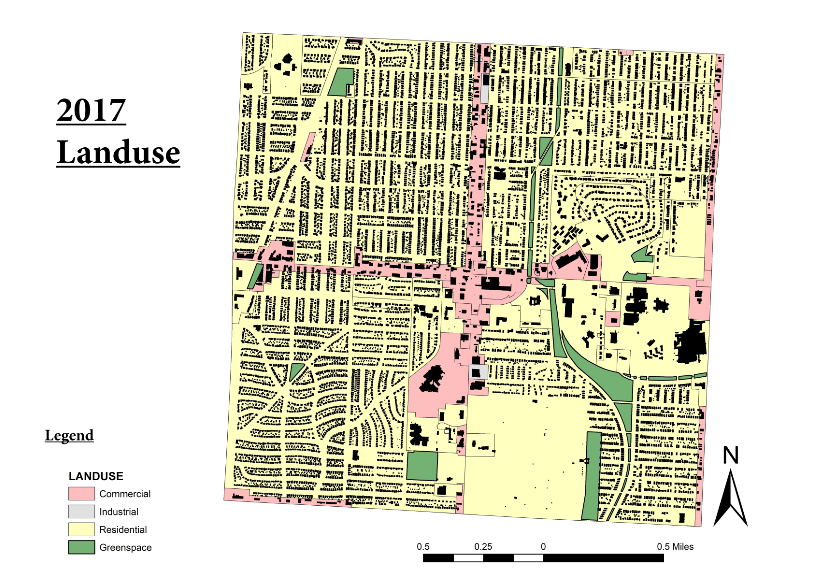
Figure 1 highlights several key land use aspects which creates a better understanding of where homes are located around the Landing Mall. Commercial zoning is located along Troost Ave. and 63rd St with two small industrial areas located at 56th and 66th St. Green spaces are located along the parks and boulevard system as well as throughout residential neighborhoods. Surrounding the commercial areas are those marked for residential. However, it should be noted that in the southeast section, a large portion of the area is occupied by the Forest Hill Cemetery and the Research Medical Center.
Source: Social Explorer
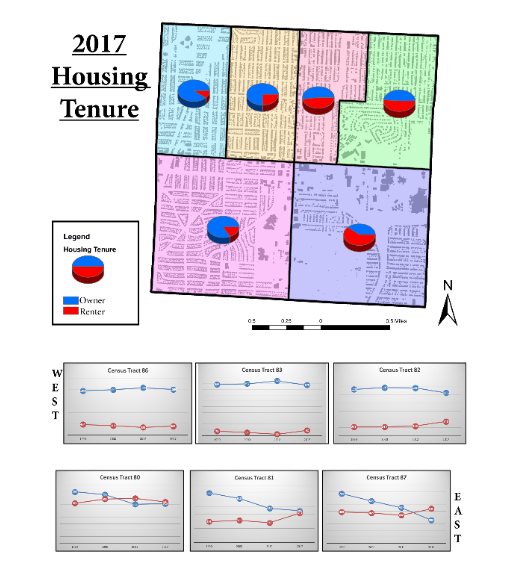
When examining the difference in renter occupied housing units and owner occupied unites within the area some notable patterns take place. As seen in Figure 2, the number of homeowners far exceed that of renters in census the tracts located west of Troost Ave. This trend has consistently stayed the same over time since 1990 as seen in the line graphs shown below the map. The tracts located east of Troost has seen homeownership decline since 1990 with only Tract 81 having less renters than homeowners in occupied units.
Source: Social Explorer
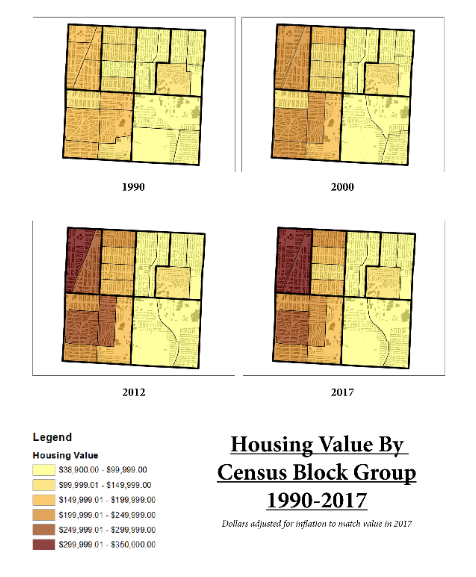
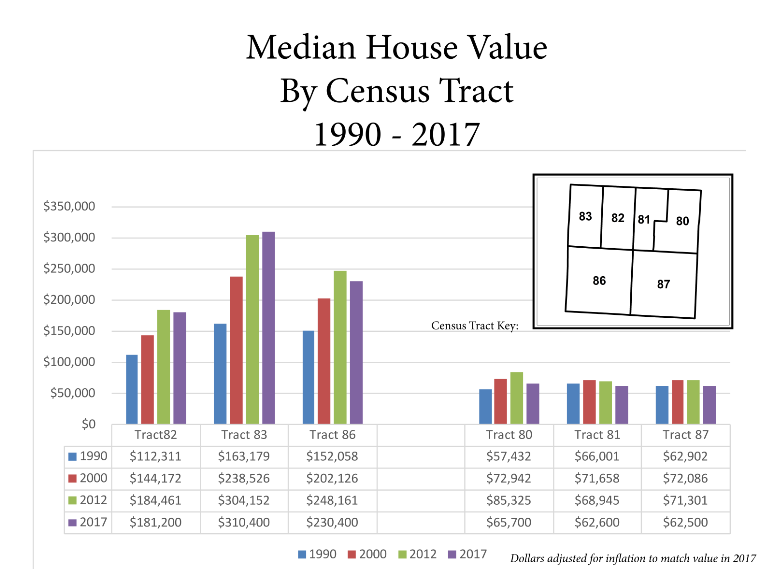
In addition, the value of homes has steadily increased in the tracts located west of Troost. By viewing the values at the block group level, one can view how the prices of homes have changed within each neighborhood. For instance, the Morningside neighborhood located in tract 83 has become one of the most expensive neighborhoods in the area. The value of homes in the Citadel neighborhood Located tract 80 has consistently stayed the same since 1990. Tracts 81 and 82, which make up the 49/63 neighborhood coalition has seen little change east of Troost but has fluctuated over time on the west side. This division in value of homes can also be viewed below.
Source: Social Explorer