Kansas City’s census tract 54, which encompasses 31st to 35th, from Woodland to Prospect, has delineated the same boundaries from 1950 to the present. The demographic transformations of this area, however, have been far from consistent. To illustrate, in 1950, Kansas City’s urban core had experienced considerably higher population density than the present. According to figure 1, the 1950 Census recorded a total population of 5,397 (U.S. Census Bureau, 1950). Within the tract’s area of .25 square miles, this equals a population density of 22095.99 per square mile. Likewise, the racial makeup of the tract bears no resemblance to its present state. Tract 54 saw a 99.6% white population to a .4% black population (U.S. Census Bureau, 1950). Additionally, the 1,880 housing units in 1950 was far higher than ensuing decades.
When cross-referencing the 1950 census with data from 2000, the social, cultural, and political contexts readily offer perspective to the demographic shifts. For example, from 1950 to 2000, tract 54 saw total population fall to 1,230 (U.S. Census Bureau, 2000). In perspective, this reflects a drop in population density by around 23%. Seen in figure 2, the racial breakdown of the tract inverted to 95.4% black to 3.2% white (U.S. Census Bureau, 2000). From the mid-nineteenth century to the change of the millennium, the tract saw a mass exodus of the white population, along with a significant quotient of density.
Data displaying educational attainment further reflects the racial and socioeconomic rifts between those who fled to the suburbs and those who settled in tract 54. As shown in figure 2, over 41% of the overwhelmingly black population has not completed high school or equivalency (U.S. Census Bureau, 2000). Disinvestment in public resources, perhaps a function of the hemorrhaged Jackson County tax base (among many other factors) to surrounding suburban communities, has contributed to the difficulties of the area.
The 2010 census data again shows a decline in the tract’s population and density. As seen in figure 3, the total population has fallen to 903 with a population density of 3,622 per square mile (U.S. Census Bureau, 2010). Additionally, the number of housing vacancies has risen to 230, against the available 588 housing units (U.S. Census Bureau, 2010). Compared with the 2000 census, more whites and individuals self-identified as “other” or “two-or-more-races” occupy the tract.
Conversely, the inner city census tract stands in stark contrast to the Metropolitan Statistical Area. The suburban sprawl of the metro brings the total population density down to 260 per square mile. Thus, the population density of the urban tract is over 14 times denser than the MSA in aggregate. Seen in figure 4, the MSA shows a 78.5% white to 12.5% black ratio (U.S. Census Bureau, 2010). The concentration of the black community in the urban core is shocking when compared to the MSA as a whole. Also, with a median household income of over $50,000 per year, the MSA is over twice the income of the urban tract. Lastly, the MSA shows over 20% of the populating holding bachelor’s degrees, compared with the 0% of tract 54 from the 2010 census. Hence, the data show that the urban tract is denser, poorer, less educated, and more intensely racially segregated when compared to the MSA in aggregate.
2010 Census
All posts by Thomas Kimmel
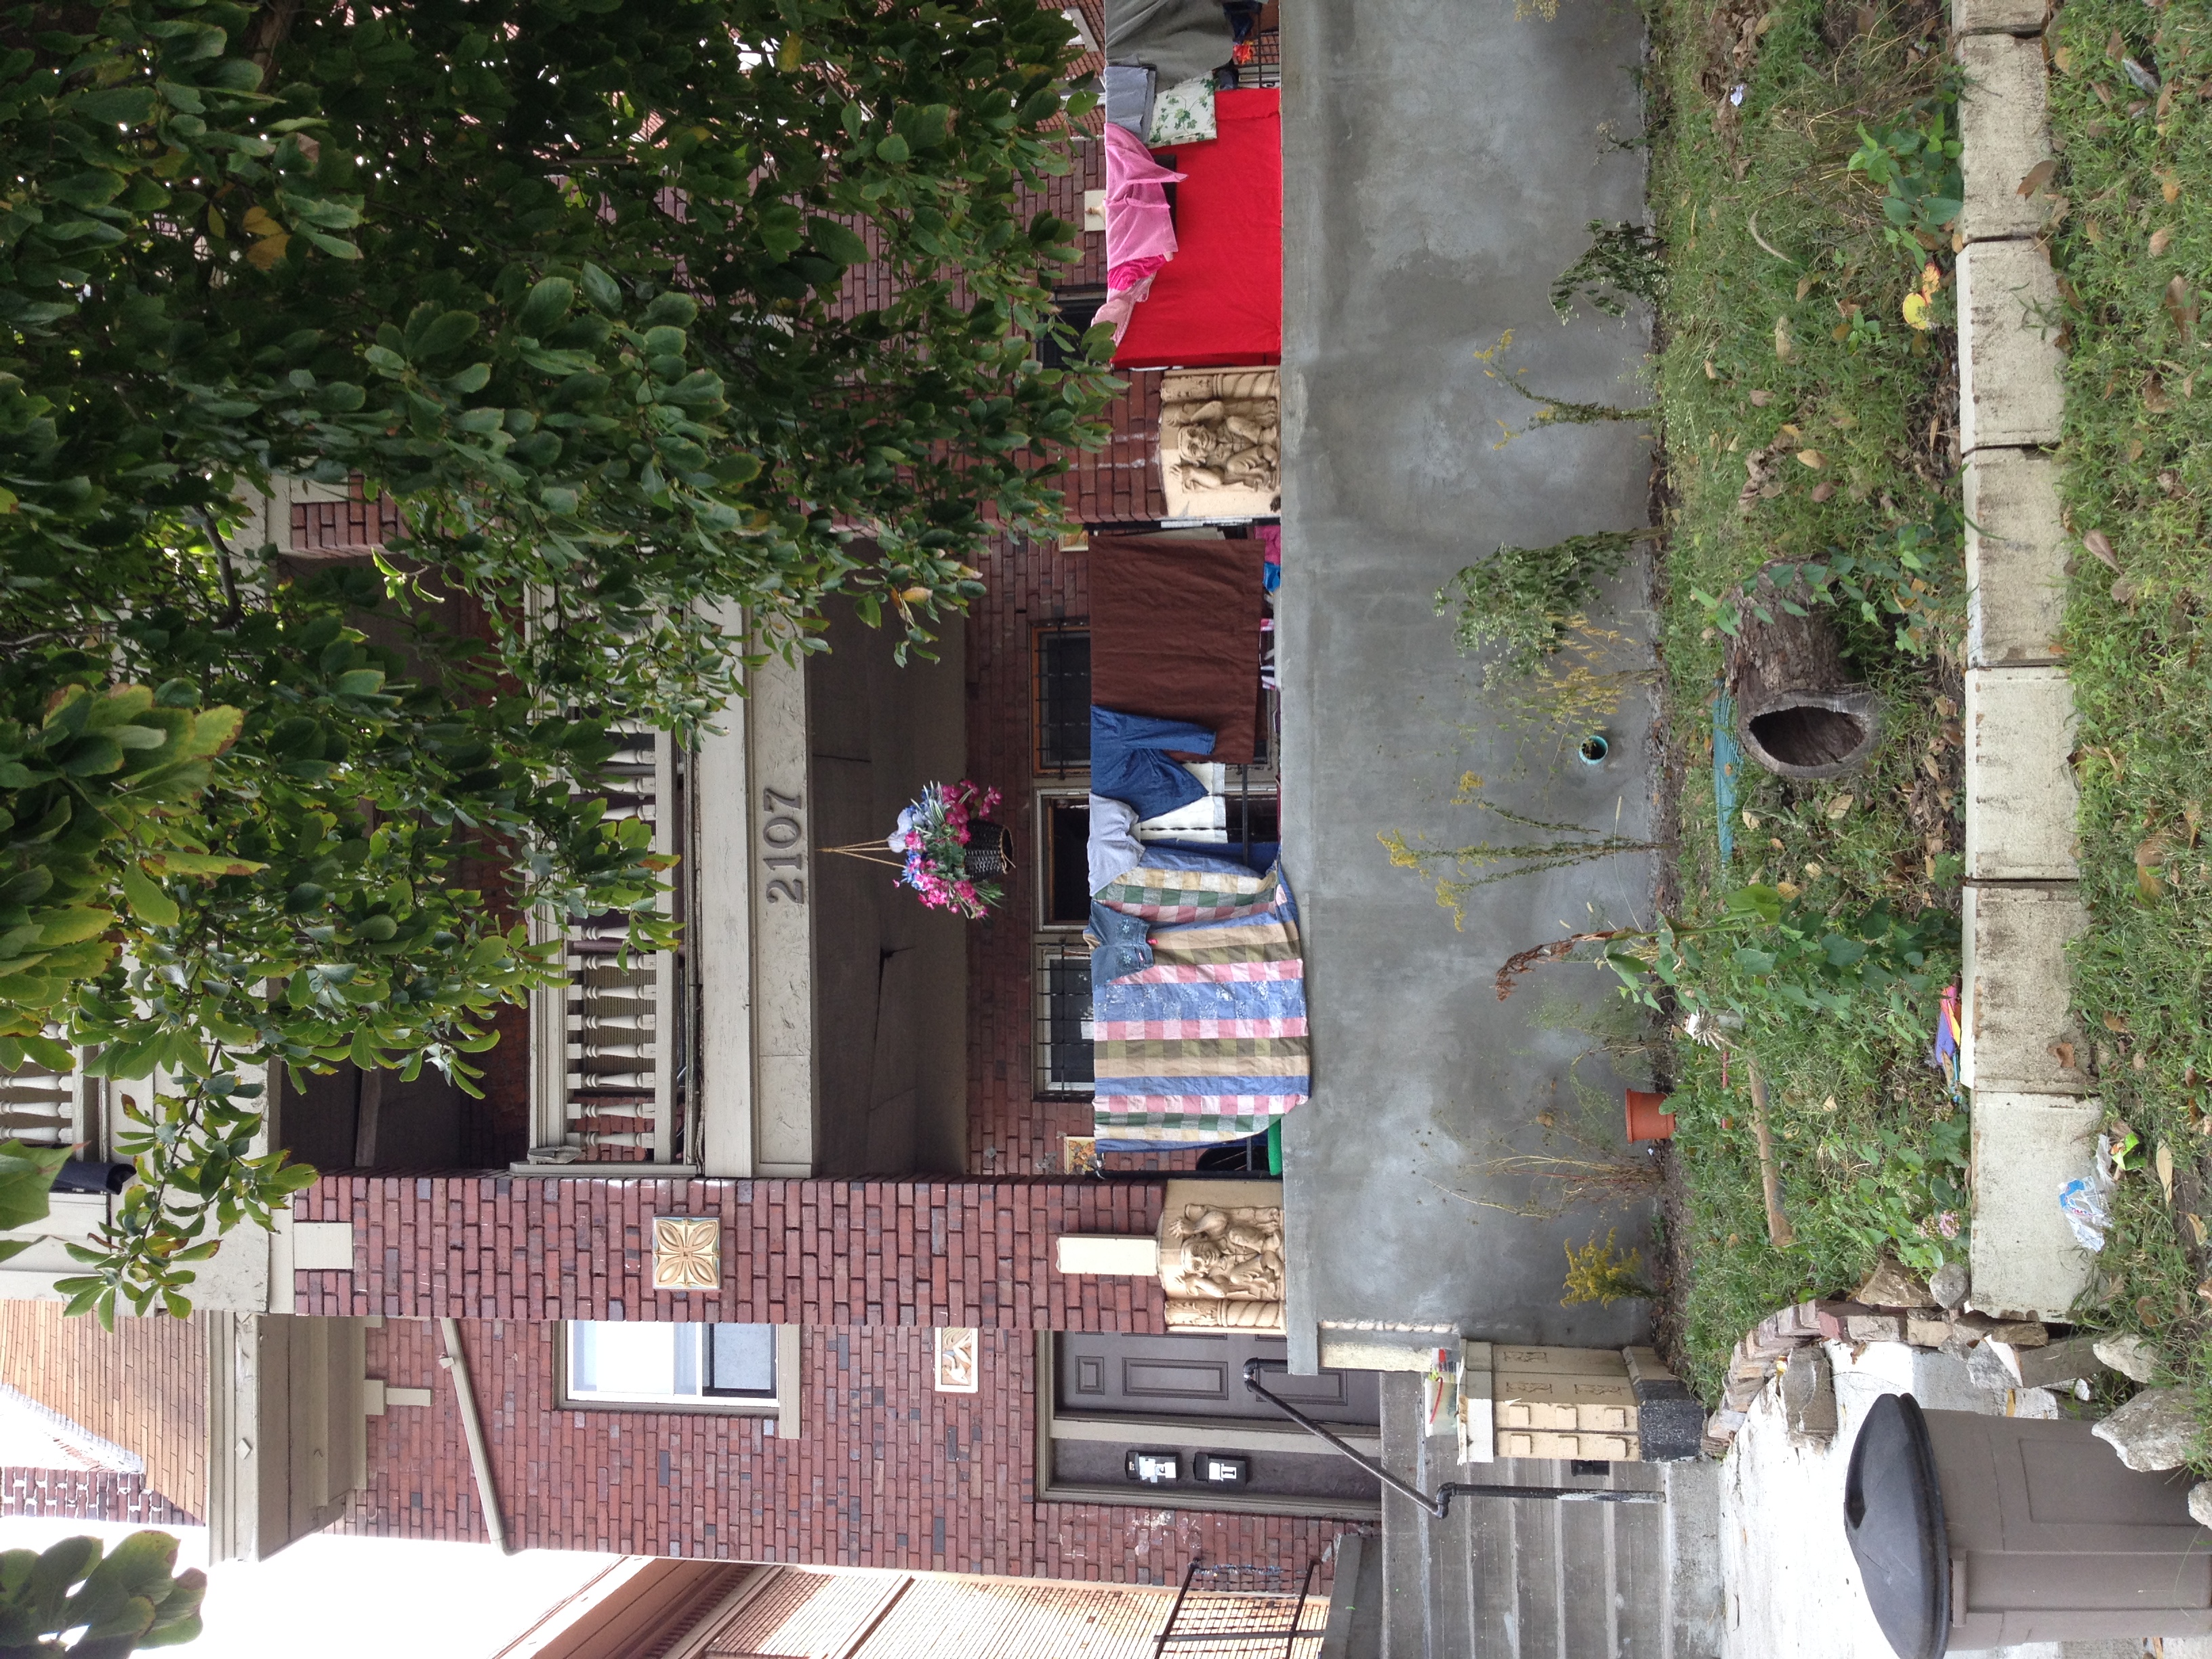
Linwood from Garfield to Park
To begin, Kansas City’s system of planned parks, boulevards, and infrastructure can be traced to the 1893 Plan for Parks and Boulevards. This early plan, championed by visionary urban designer George Kessler, emphasizes the need to design comprehensively, yet pursue goals incrementally. Like any organism, the city needed to be designed intelligently in order to function sensibly throughout time. The 1893 plan accounted for a series of boulevards, then outside of the city limits, to help organize urban growth moving forward. One of these east-west thoroughfares was Linwood Boulevard. There is no data of the intersections of Garfield to Park existing on Linwood Boulevard in 1895. Thus, one can assume that this artery had not yet been developed. Despite being undeveloped, the boulevard was instructed to be “60 feet wide and contain sections lined by 10-to-12-foot-wide grass strips and 5-to-6-foot-wide sidewalks.”
According to the Sanborn map of 1950, all the residential structures between Garfield and Brooklyn retained the same building footprints. Behind the buildings on the southern side of Linwood from Garfield to Brooklyn, underground gasoline tanks were installed. Also, parking lots behind residences begin to emerge on the Sanborn map. In 1963, the monument to Sanford Brown, Jr. was relocated to a masonic cemetery.
From 1950 to the present, Sanford Brown Plaza has experienced moments of deterioration and revitalization. According to the Kansas City Star in 2009, “at Sanford Brown Plaza, Linwood Boulevard and Brooklyn Avenue, both drinking fountains worked; one didn’t in 2003, about twenty new trees have been planted in recent years, with much less glass and graffiti than six years ago.” Presently, the park appears to be in good order. It is well-landscaped, with new playground equipment, functional facilities, and well-kept basketball courts and baseball diamond.
Thus, the spatial history of Garfield to Park Avenues along Linwood Boulevard is an example of idealistic beginnings that produced mixed results. Sanford Brown Plaza has bounced back to become an important anchor for the community, but the surrounding residential structures are depressing remnants of a bygone era.