It was interesting to see how time had changed the face of the block, and the dominant race changed over 50 Years. The population density seemed to be at its height in 1950. The census tract had a population of 6,353, giving a population density of 23,435 per square mile. In the following years the residents of the block definitely started to change, and the density decreased majorly. In 2000, the population had fallen to 1,258. I’m assuming there must have been some sort of White Flight because the block went from being 99.3% white and 0.5% black in 1950, to 47.4% white and 41.2% black in 2010 and finally 46.1% black and 43.2% white.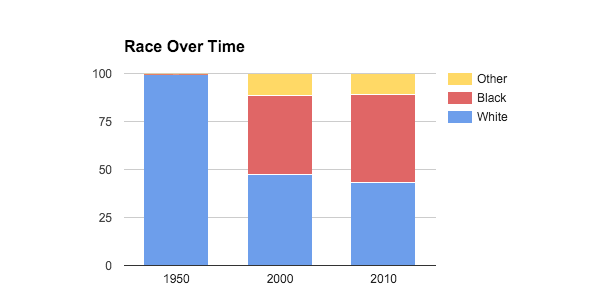
It’s interesting to note that the amount of people who had attained a bachelor’s degree increased from 2000 to 2010, but this didn’t not affect the overall median income, and it actually decreased. The median income in 1950 was $20,653, $35,693 in 2000, and $26,646 in 2010.The value of the houses seemed to change drastically yet the median rent remained more constant. In 1950 the median housing value was $49,121 and rent was $341. Then in 2000 the value increased quite a bit with the house values averaging at $101,416 and rent of $582. Then as the median house value rose to $155,800 in 2010, the average rent actually decreased to $539.