The largest lesson learned in a review of thematic maps on the status of the Parks and Boulevard System in Kansas City, MO is the low level of population within the 1940 boundaries of the city. In 2010, our study area with a population of just over 179,000 had almost the same population of Overland Park, Kansas with 173,000. Overland Park continues to grow and has reached 181,000 as of 2013 — a higher number than the 2010 population in our study area. In the 1940 Census Kansas City Missouri had just over 399,000 people. Our city has lost 220,000 people within our study area boundary. This is a 55% decline over the period and reveals a rate of decline of more than 1% a year. The 1940 boundaries of Kansas City Mo are essentially the same as the 1909 boundaries. Our population today is 79,000 less in this area than our 1910 population of 248,000.
This has large implications on the capacity to maintain and restore the historic parks and boulevard system within this area of the city.
Sources: US Census Bureau 2015 Quick Facts,
US Census Analysis of the 100 Largest Places since 1790 (https://www.census.gov/population/www/documentation/twps0027/tab17.txt).
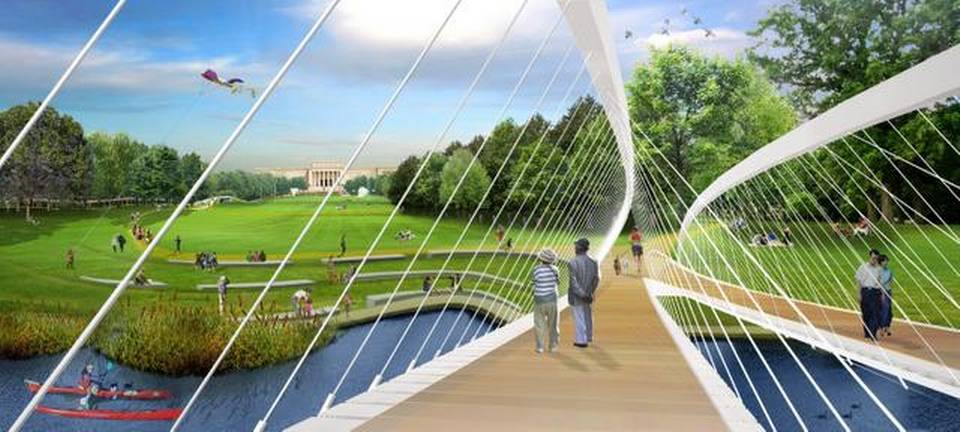
A quick look at an iconic boulevard shows the Parks system can be intensely urban
Last week was like a boot camp for planning students. We have studio three times a week, and it’s usually relatively laid back: we work on projects, get feedback from professors. (Laid back is the wrong term it’s always fast-paced and stressful
But last week, the pressure was raised a notch. In each class period, we were assigned a “quick analysis” assignment to complete in the three hours of class time. On Monday, for instance, we were assigned a demographic variable to study at the scale of Kansas City, MO. In three hours we had to produce at least one GIS map visually representing the spread of the variable, do any background research, write 600 words about what we found.
Not only is that really challenging, it’s almost impossible to do. Still, it’s impressive what you can learn about a place in two hours and fifty minutes.
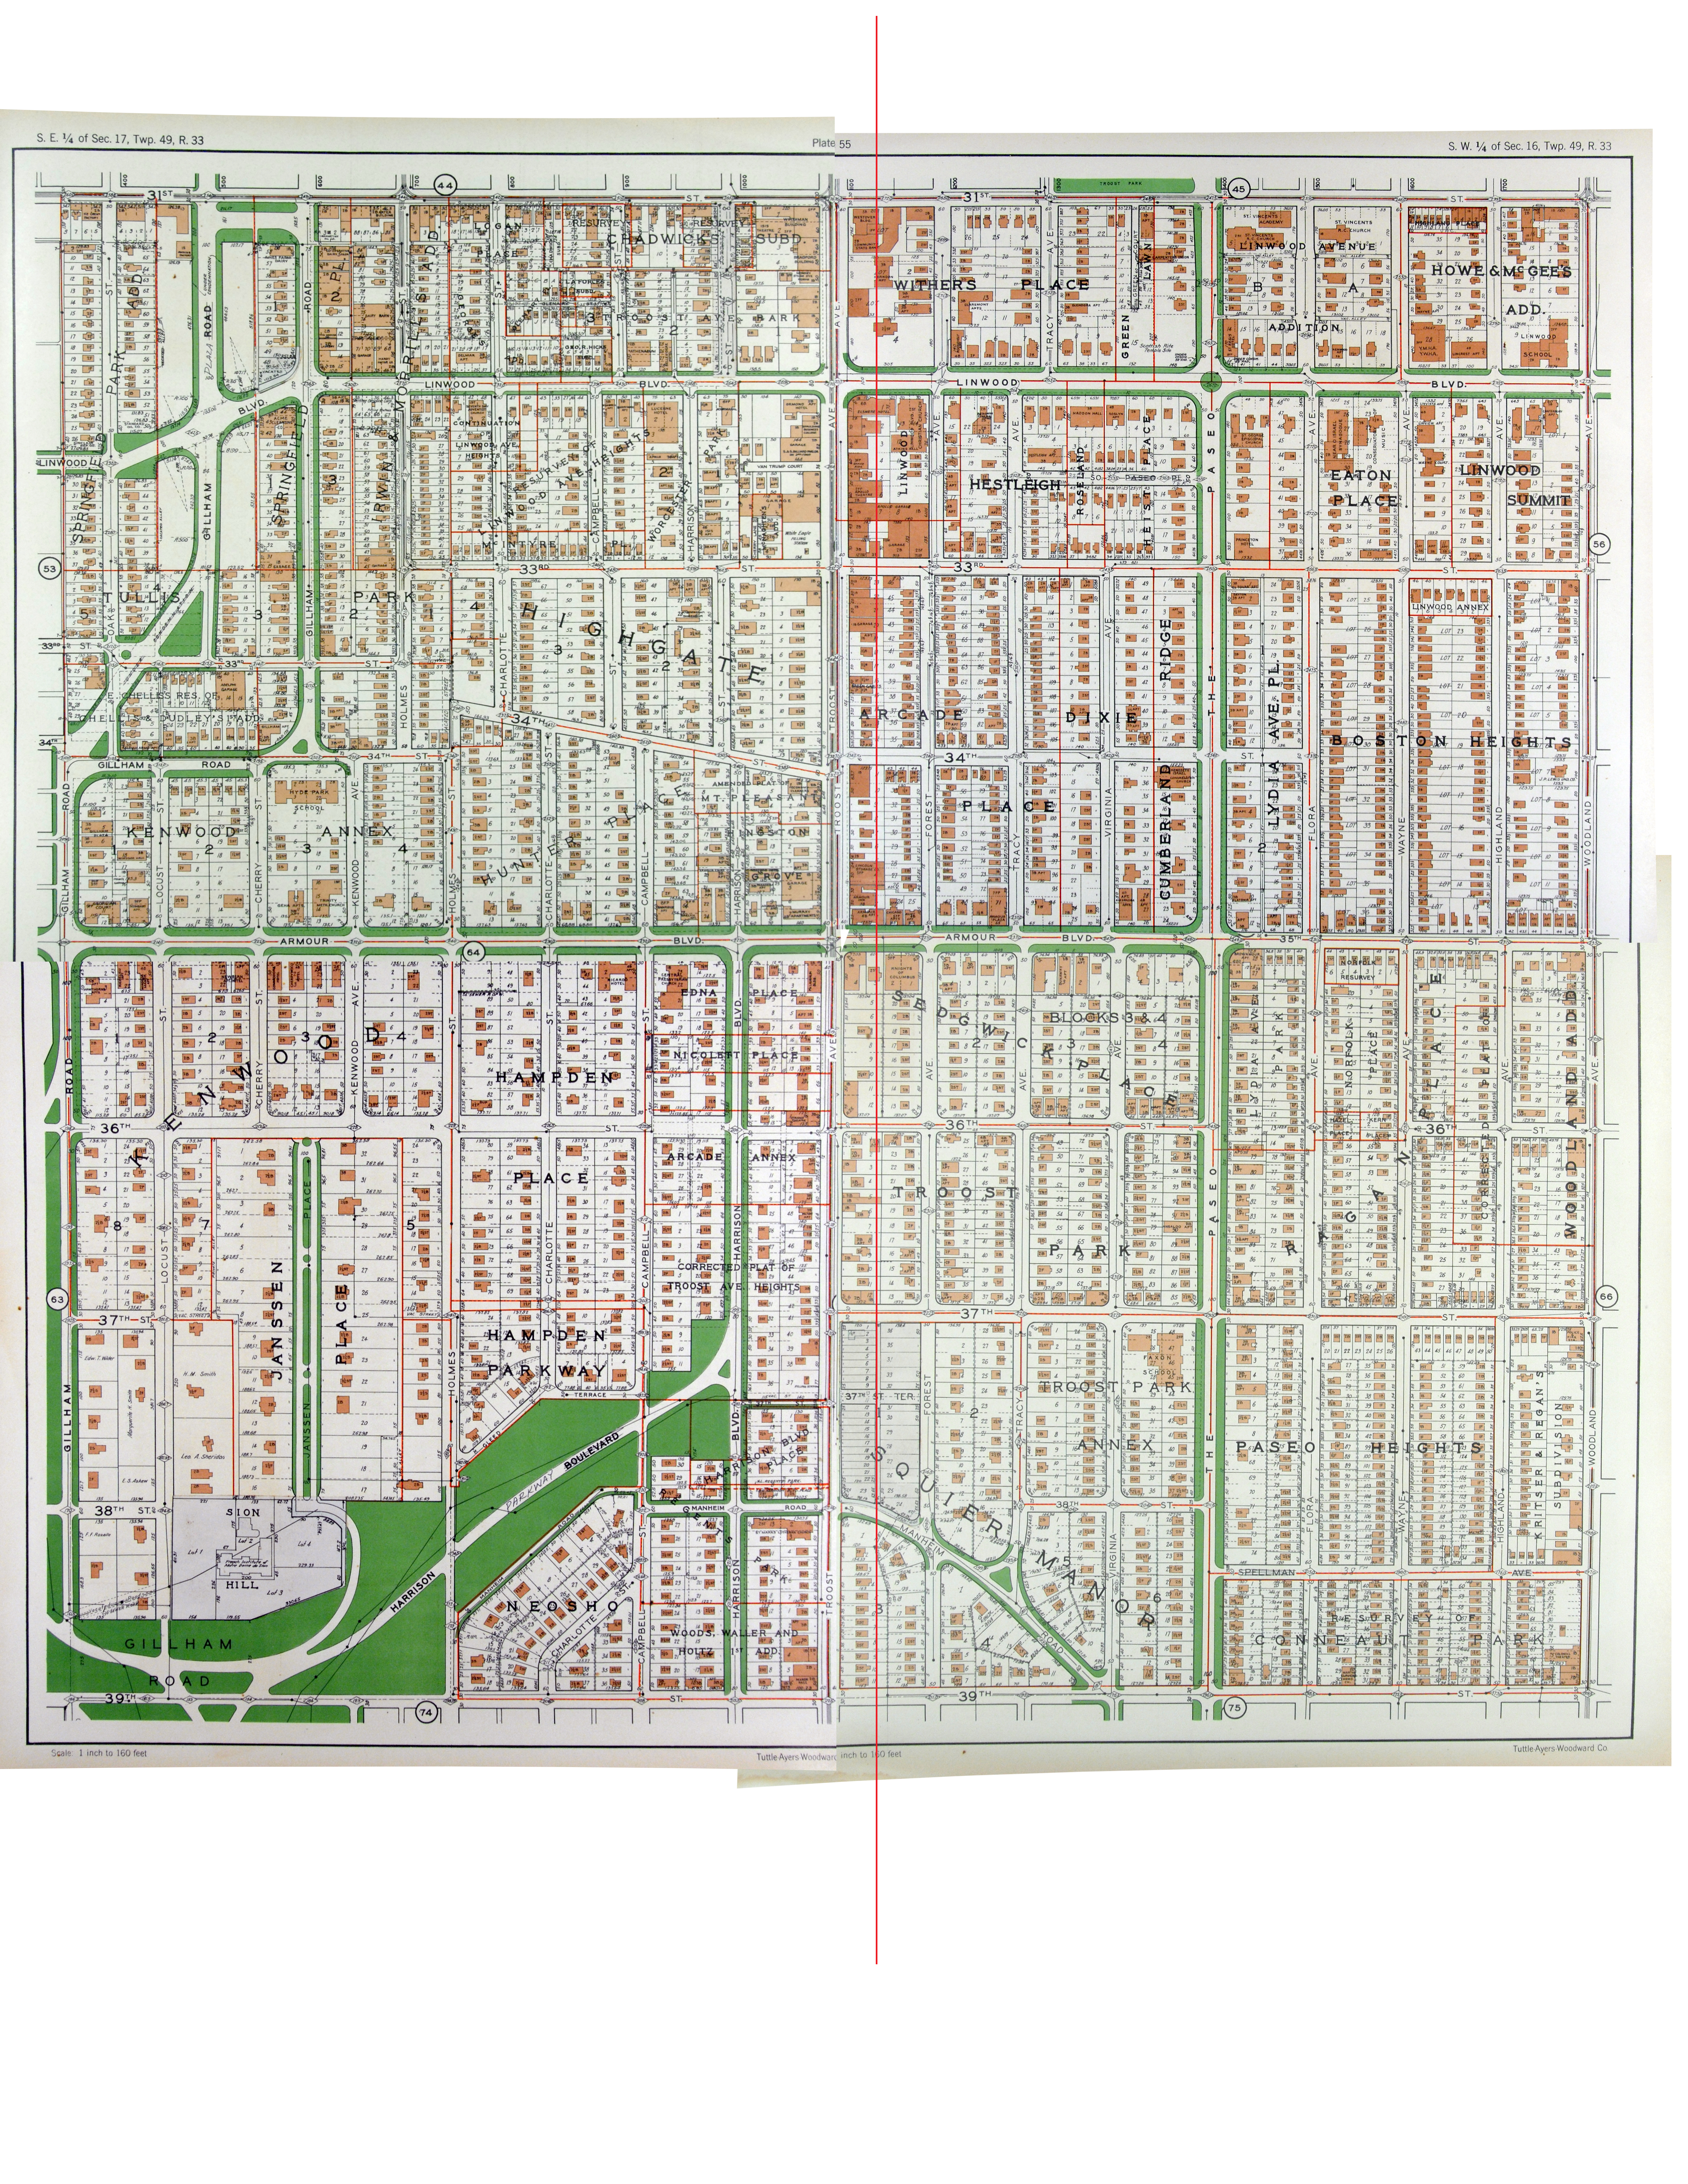
While the first “quick analysis” was at the city scale, the next two — on Wednesday and Friday, respectively — dealt with the same, specific location on the city’s Parks and Boulevards system. I was assigned to look at Armour Boulevard near where it intersects with Troost Avenue — specifically between Kenwood Ave. on the west and Forest Ave. on the east. (See map below.)
On Wednesday, the assignment was to look at the history of the urban “morphology” (how streets are laid out, where buildings are, what kind of buildings they are, etc.).
Although maps do go farther back in time, we started our research in 1925 (we only had three hours, after all). Why 1925, specifically? Because an “atlas” of the city was produced for that year, showing streets, streetcar lines and building footprints.
If you look closely at the map of my assigned area from 1925 (you can expand by clicking on it), you’ll notice a couple patterns. First, the area is largely filled by single-family homes. There are exceptions, though, most notably along Armour itself and Troost, where higher-intensity uses — apartment buildings, churches, and along Troost particularly, commercial spaces — are found. Another important pattern is seen in clusters of empty, undeveloped lots — this suggests the neighborhood was fairly new at the time. (And in fact, the city limits at the time would have been just a mile south near 47th Street.) The concentration of gathering places and commercial uses along Armour and Troost suggests they provided the framework for the development of the neighborhood — Armour as an attractive boulevard thoroughfare and Troost as a throroughfare and streetcar line.
1950
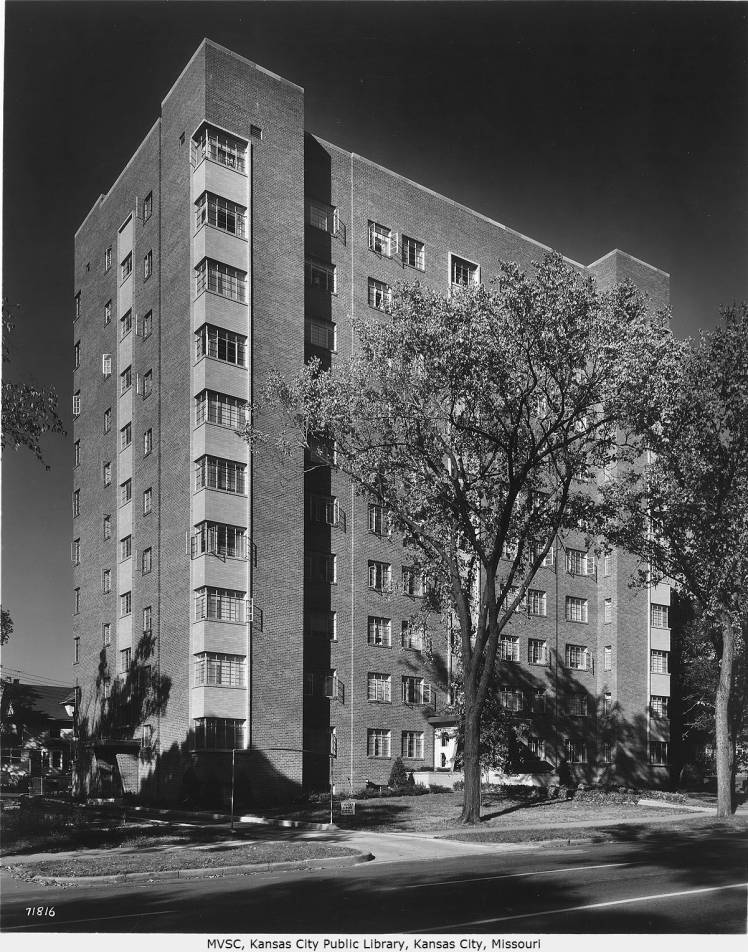
Not much seems to have changed by 1950, the next point on the timeline we were supposed to look. A few more lots have been filled in with structures. Several mid-rise apartment buildings, which were already numerous to west near Gillham Rd., have appeared along this stretch of Armour. The Armour Tower apartments, in a photo from around 1952, are exemplary of that kind of development.
Armour Tower, northwest corner of Armour and Campbell, 1952, Missouri Valley Special Collections
An undated photo (probably from the same period based on the style of cars) is even more telling: It shows the area was bustling and vibrant and had an urban scale.
Today
Contrast the above photo with one from today at the same spot
Quick analysis skills are essential in the planning vocabulary, in the sense that they allow you to break down and analyze various types of research and data, and illustrate findings in an expeditious manner. A series of in class quick analyses looked at multiple characteristics of Kansas City’s Parks and Boulevards, including a thematic comparison, illustrating the relationship of demographic and socio-economic data and the distribution of parks, as well as past and present patterns in land use and zoning.
The boundaries of study for this series of analyses represent the 1947 city limits, with the Missouri River to the north, the Blue River to the east, 79th Street to the south, and State Line to the west.
THEMATIC ANALYSIS
This first analysis was intended to show either the direct or indirect relationship between the amount of available park space and median household income. To begin analyzing the data, an inventory of 117 parks spread out across 86 Census Tracts were mapped using ArcMap GIS Software, in combination with income information from the 2012 American Community Survey.
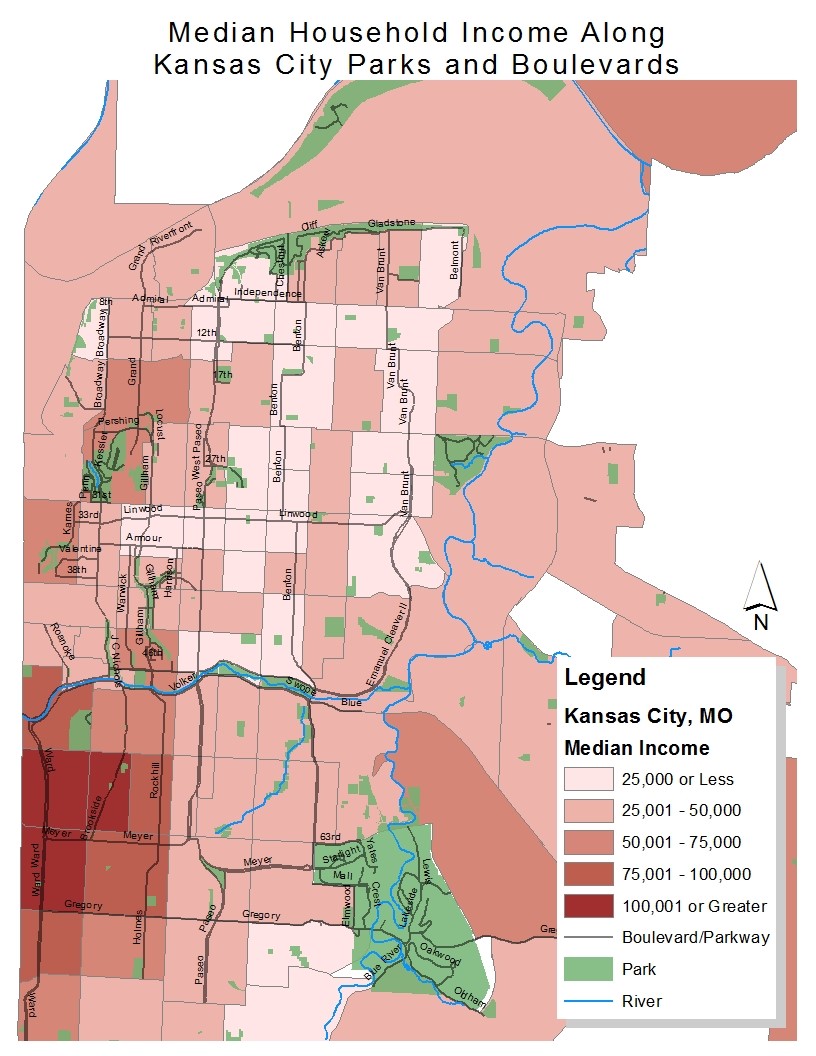
Figure 1: Median Household Income of Kansas City, MO (2012)
Figure 1 shows the locations of parks across multiple census tracts in Kansas City, and illustrates several patterns related to income levels and park access. The map shows that many of the larger sized parks, including Kessler Park, Blue Valley Park, Swope Park, Loose Park, and Penn Valley Park are all located towards the outskirts of the study boundaries. Together, these parks account for nearly 2,600 acres of park space, more than half of the total park acreage for the entire study area, which is roughly 5,055 acres.
A second pattern, pertaining to income levels, is that the majority of high median income residences ($75,001 or greater) are located in census tracts to the western boundary of the analysis area. These tracts include a large number of residences in the Brookside neighborhood, as well as several from the South Plaza area. Coincidentally, these are also the location of some of the higher quality parks listed on Kansas City’s Parks and Boulevard System. Loose Park, arguably one of the systems gems, is located to the north of the Brookside Neighborhood, and is surrounded by tracts with median household incomes of $75,001 or greater.
Similarly, areas of Kansas City with a lower quality or parks, or a lower concentration of park space in general were often associated with lower income levels ($25,000 or less). Looking at the Eastern part of Kansas City, along Van Brunt Boulevard, from 12th Street to 31st Street, Figure 1 shows a very low concentration of parks. This 2 mile stretch of Van Brunt hosts only 6 parks, totaling 60 acres
The conclusion of this analysis determined a relationship between park accessibility and median household income, in the sense that areas with lesser park space were often associated with areas of lower income. Areas with a higher number of parks, and in most cases, a larger concentration, showed higher levels on income.
ZONING AND LAND USE ANALYSIS
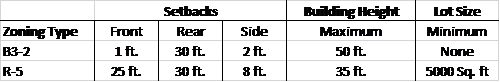
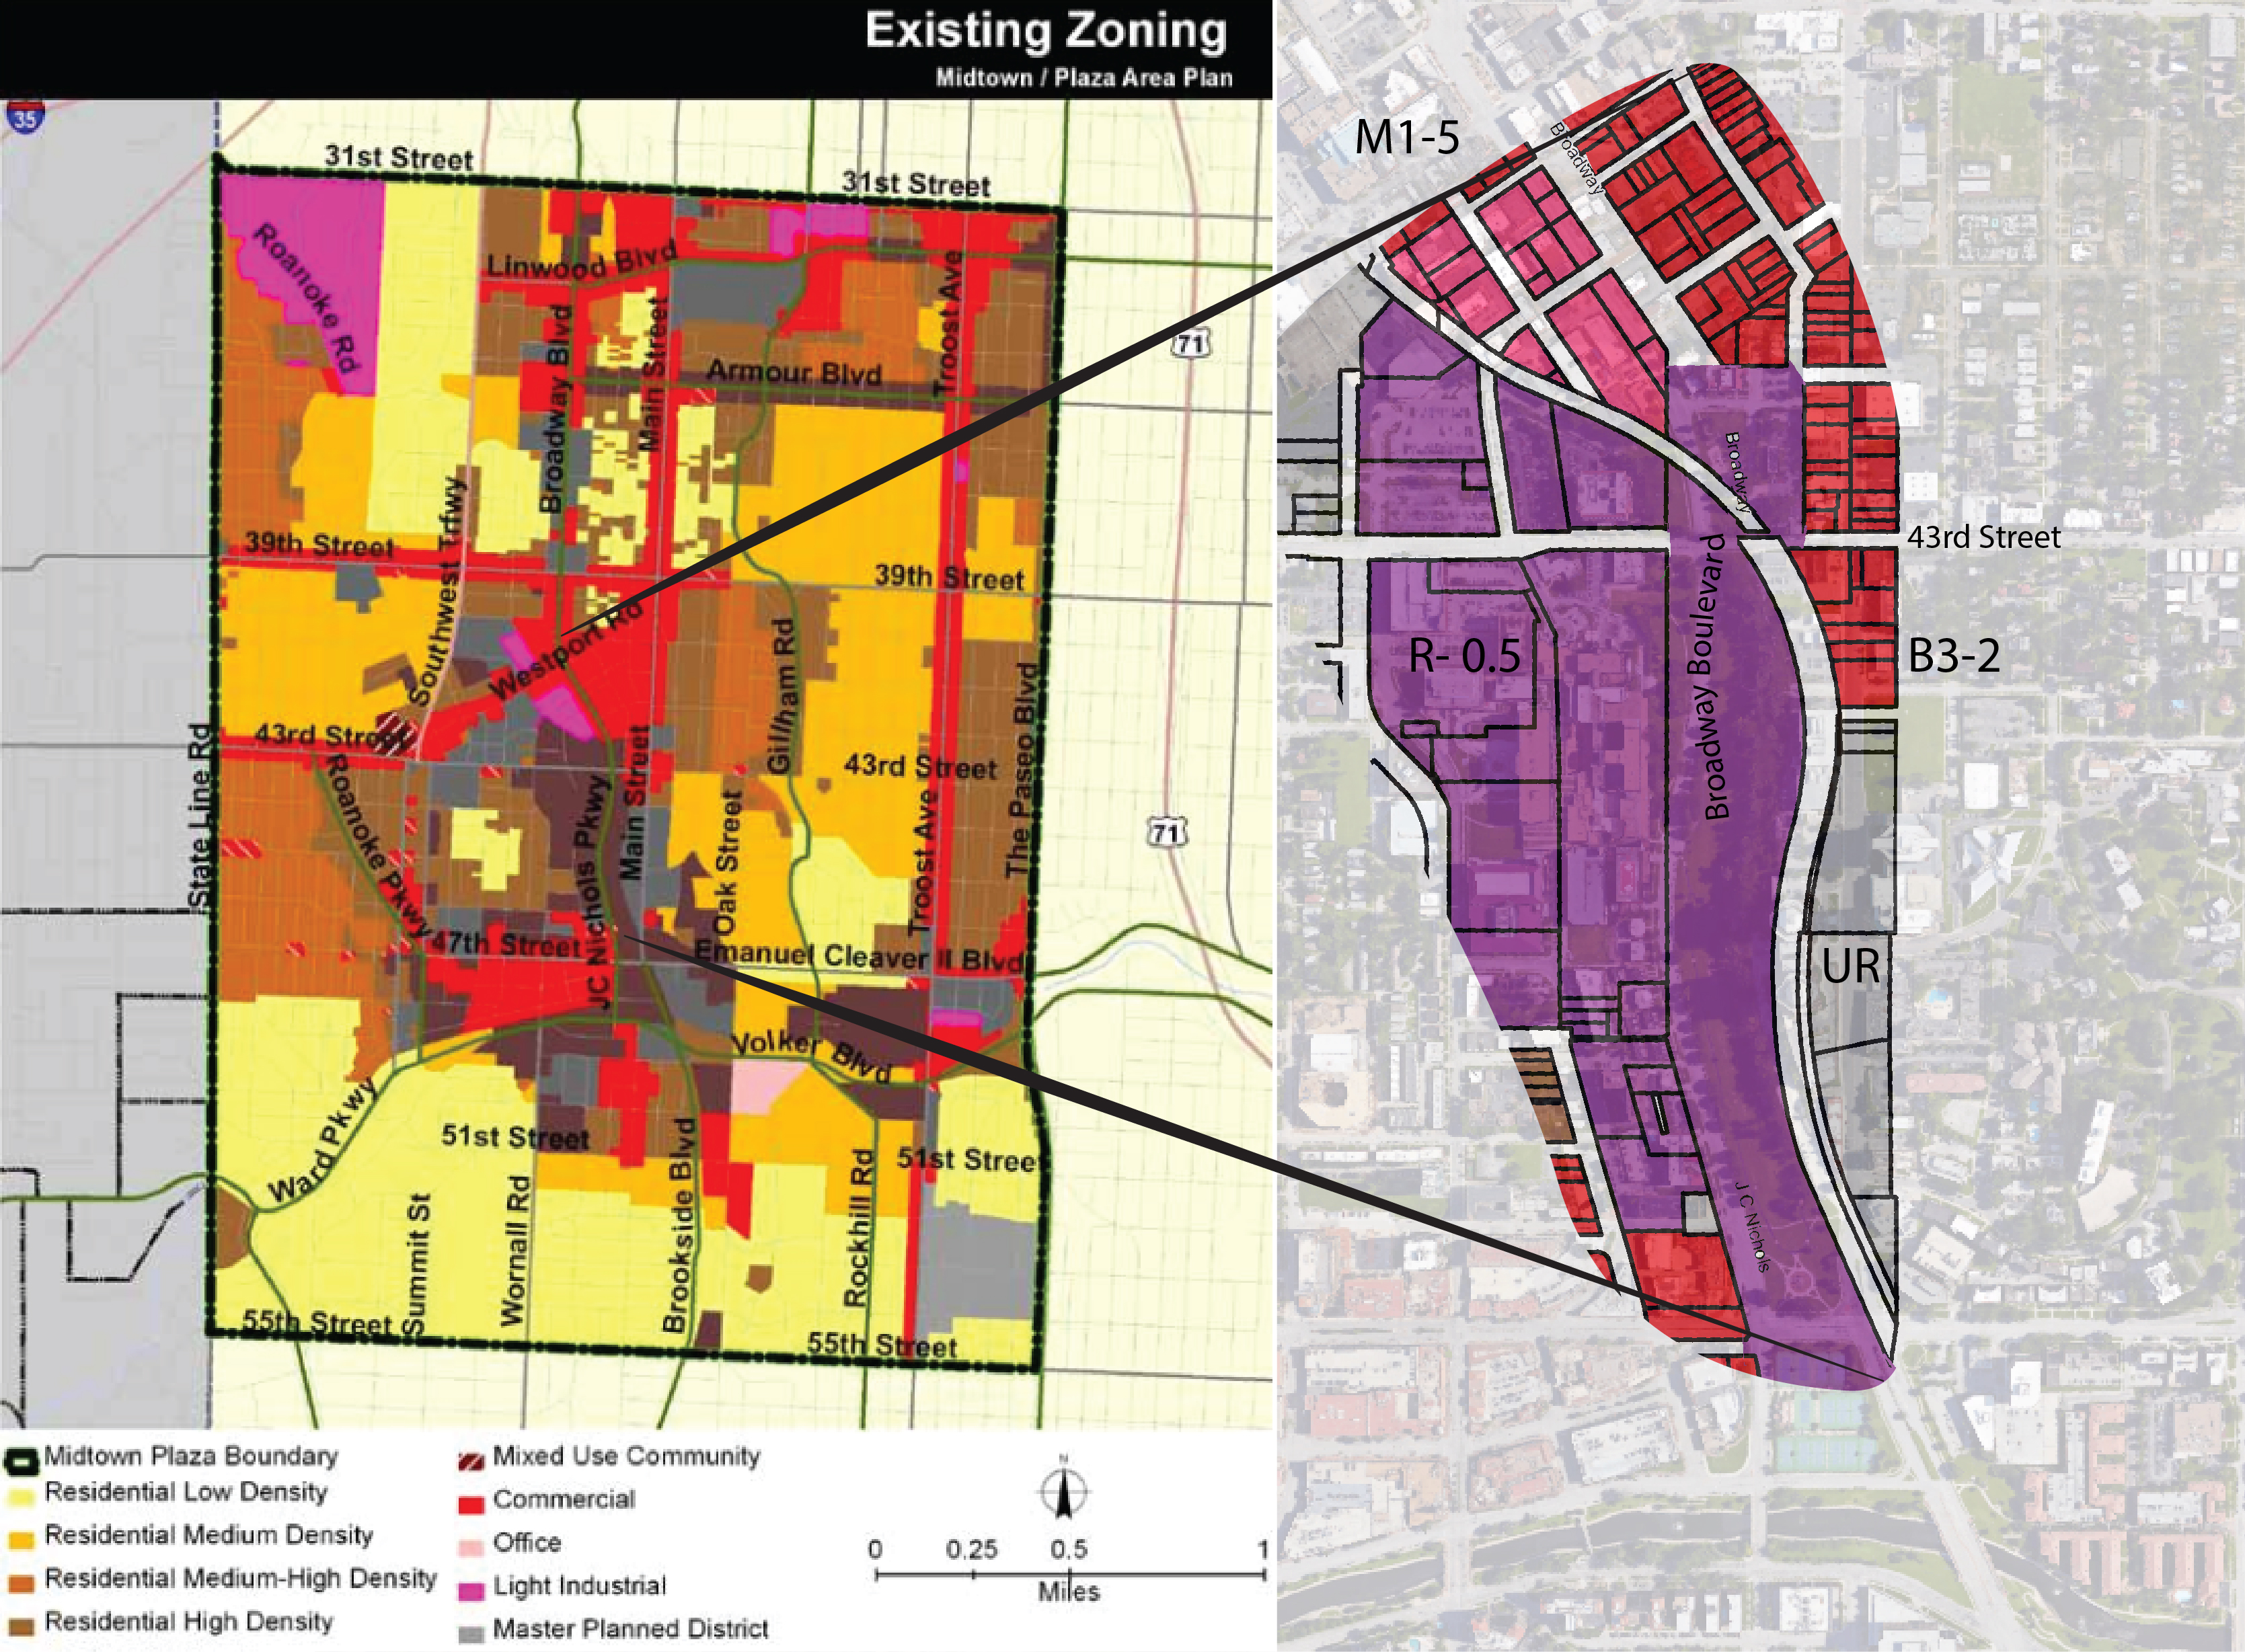
The second analysis focused on land use patterns and zoning requirements, and how they differ based on location. The scope for this assessment focused on Roanoke Road, from 39th Street to Valentine Road, which is currently zoned for B3-2 commercial uses, and R-5 residential use.
Table 1: Bulk Zoning Requirements – Kansas City, MO
Regulations for residential development in this area are comparable to surrounding neighborhoods. Regulations for development in the B3-2 zone are slightly stricter however. Since commercial developments in this area are abutted against a residential zone, additional regulations are imposed.
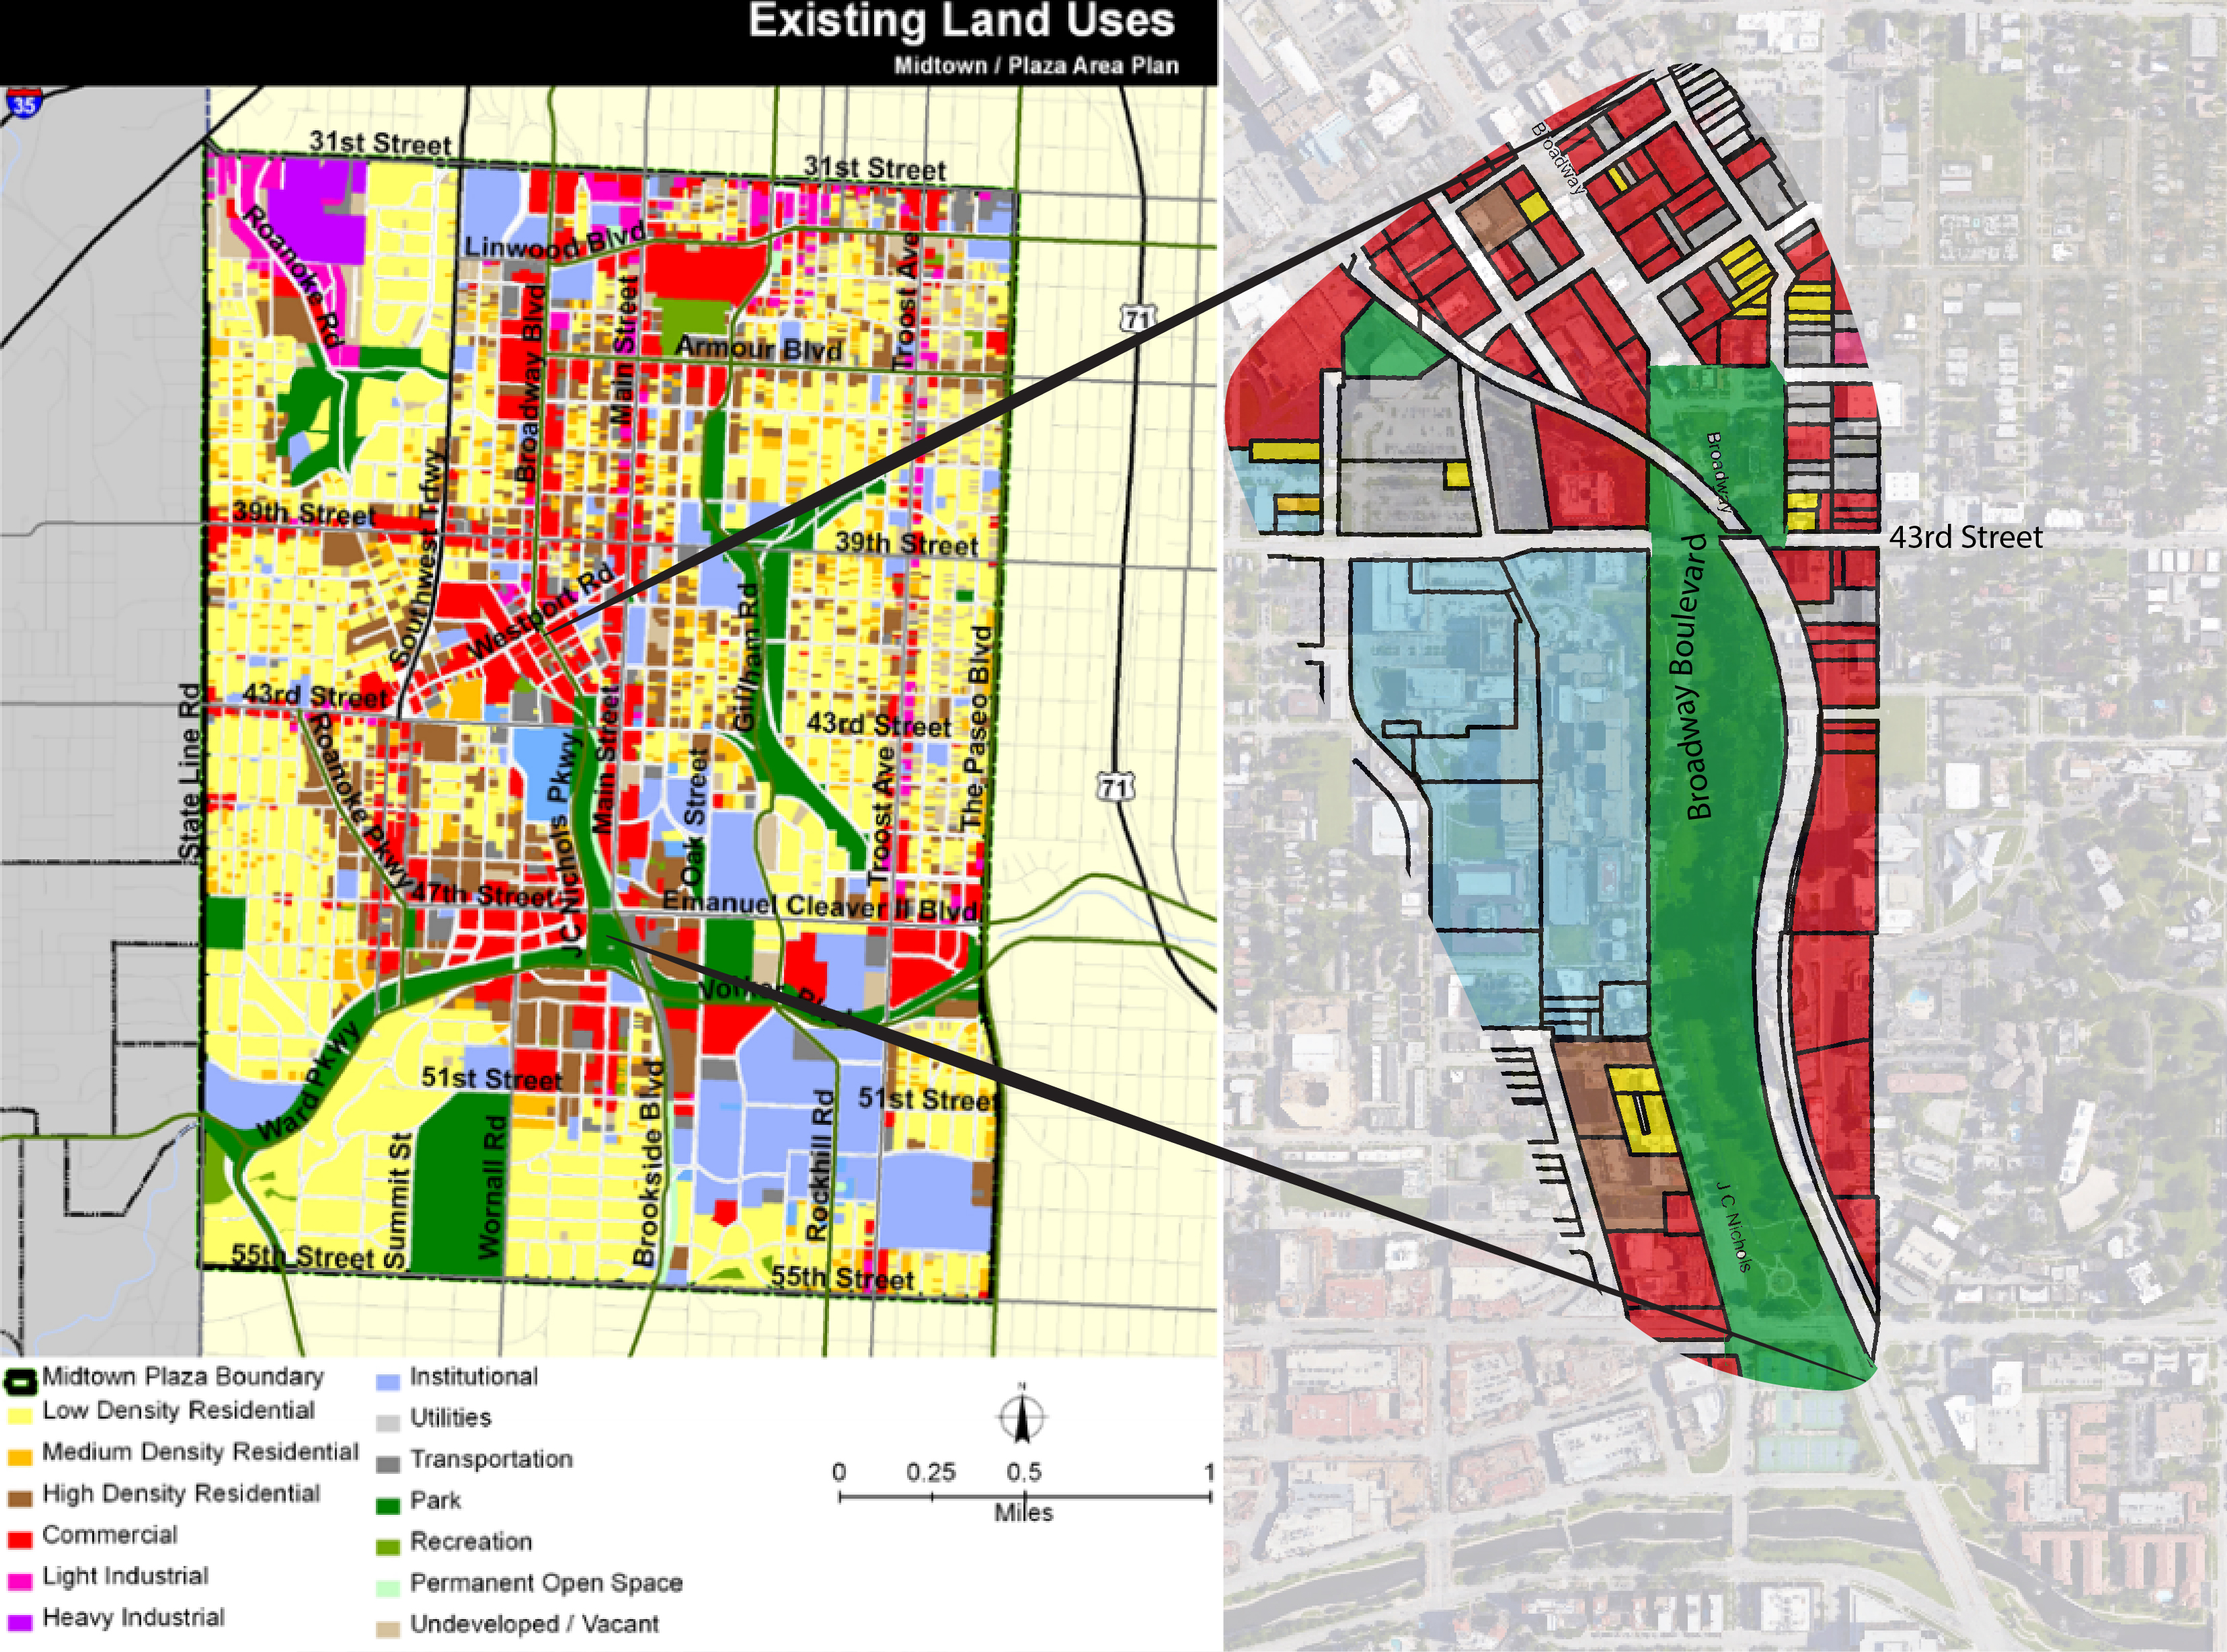
Figure 2: Land Use in Midtown Kansas City
In this area, land use regulations determine where different types of development can take place. As I found in the last analysis, many houses along 39th Street were removed several years ago, and the area was rezoned for commercial use. Looking at Figure 2, you can see the development patterns of commercial use. Notice that although this corridor is zoned for B3-2 commercial use, there is a nonconformity of more than ten lots that are currently used for residential purposes along 39th. It is likely that this was enabled by the use of a variance, but the reason is unclear. Beyond 39th Street to the north, the remainder of lots are currently used for residential purposes, including single family and multifamily dwellings.
Doing rapid analysis can yield some pretty great results. When a time constraint is given to you, not only do you work faster, but you are forced to edit down to whats important.
Our studio did 3 separate 3 hour studies of the parks and boulevards system. We looked at the system as a whole, history of many of the “knuckles”, and the planning, zoning and land use in said areas.
PUBLIC TRANSPORTATION WITHIN PARKS & BOULEVARDS
Data Gathering
In order to study the relationship of public transportation and the parks and boulevards system in Kansas City, reliable data must be gathered and properly joined. The shape boundaries were taken from the 2010 Census Tract Boundary. The data fields that were used came from Social Explorer and included information from the 2008-2012 American Census Survey. Using commands in ArcGIS, the ACS data was joined to the Tract Boundary shape file and a data dictionary was used to rename specific fields.
The study boundaries for this analysis are from the Missouri River in the north, to the Blue River to the east, to 79th Street in the south, and State Line to the west. The New Park shape file and the ROW shape file were taken from the Parks and Recreation department from Kansas City, Missouri.
Process and Mapping
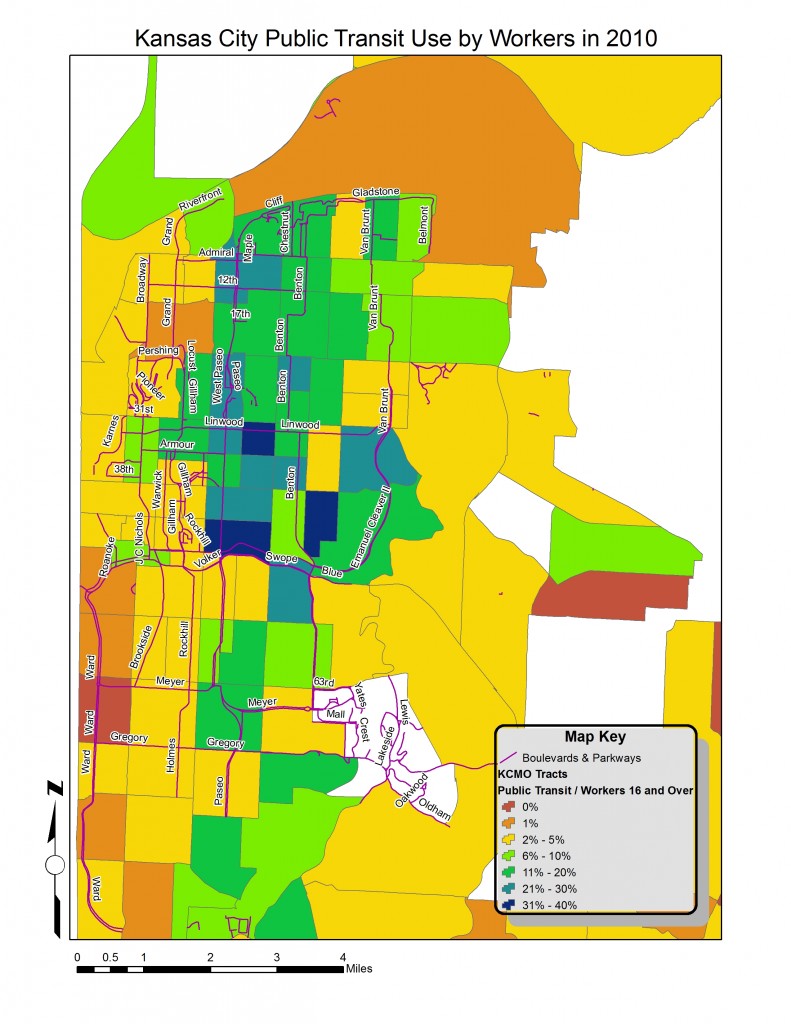
By using symbology, several things were able to be visually represented within the boundaries. The first thing that was vital to the map was a visual description of where people that use public transportation are. This was done by normalizing the (amount of workers who use) public transport data by the overall amount of workers. Another tool that was used were the shapefiles that show were the ROW parks and new parks are located.
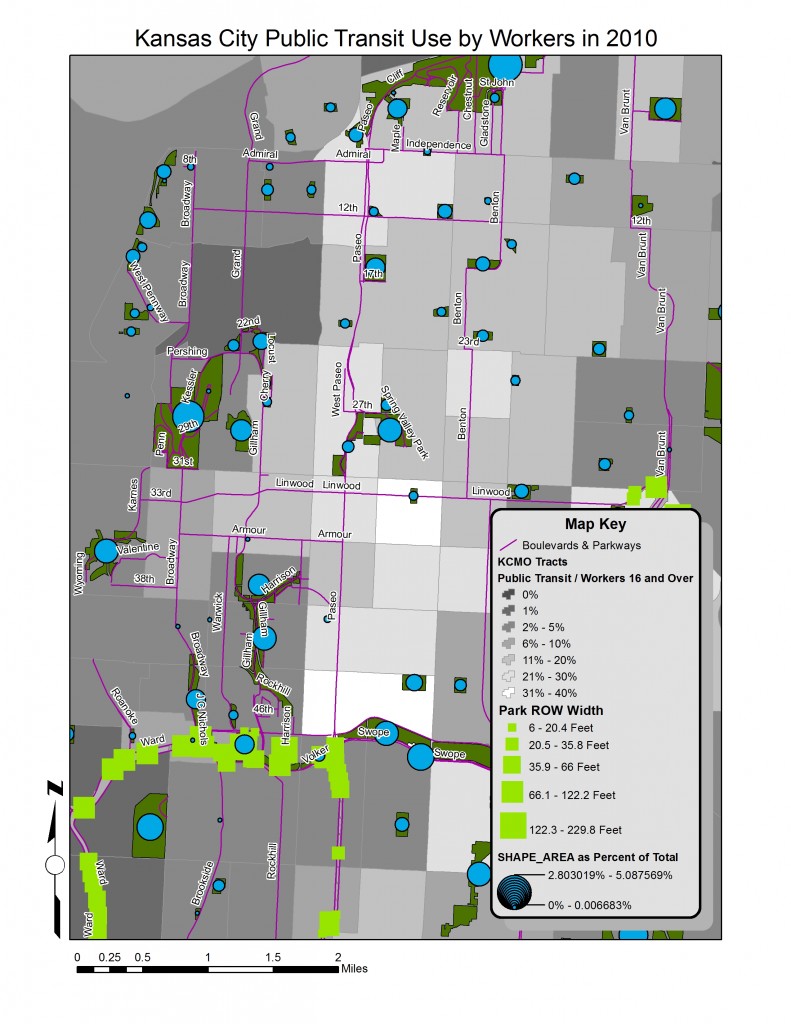
By using symbology techniques, the ROW width was calculated by using a calculation of the area divided by the length of the polygon, the result was the width of the actual ROW. I then presented these sizes in an exaggerated rectangular green shape. The New park data was illustrated by showing the area of each park normalized by the total size of all the new parks. These were shown with blue circles whose size reflects the park size compared to the overall parks.
Analysis
There are several patterns that emerge when studying the maps that were created for this analysis. The first is that the majority of public transportation activity is located east of Troost and north of Emanuel Cleaver II/ Volker Parkway. There are census tracts that have 30% – 40% of its workers using public transportation to get to work. For all of Kansas City, MO there is a MEAN AVERAGE OF 6% that use public transportation, A MEDIAN OF 3%, and a STANDARD DEVIATION OF 8%. The AVERAGE WIDTH FOR THE PARK RIGHT OF WAY WIDTH WAS 42 FEET.
ROW’s tend to be in areas where there is low public transportation. When looking at the relationship between the amount of park space and ROW to the use of public transit, it can be seen that the areas using public transit the most, lack the most availability to the parks and boulevards system.
Design Strategies
History
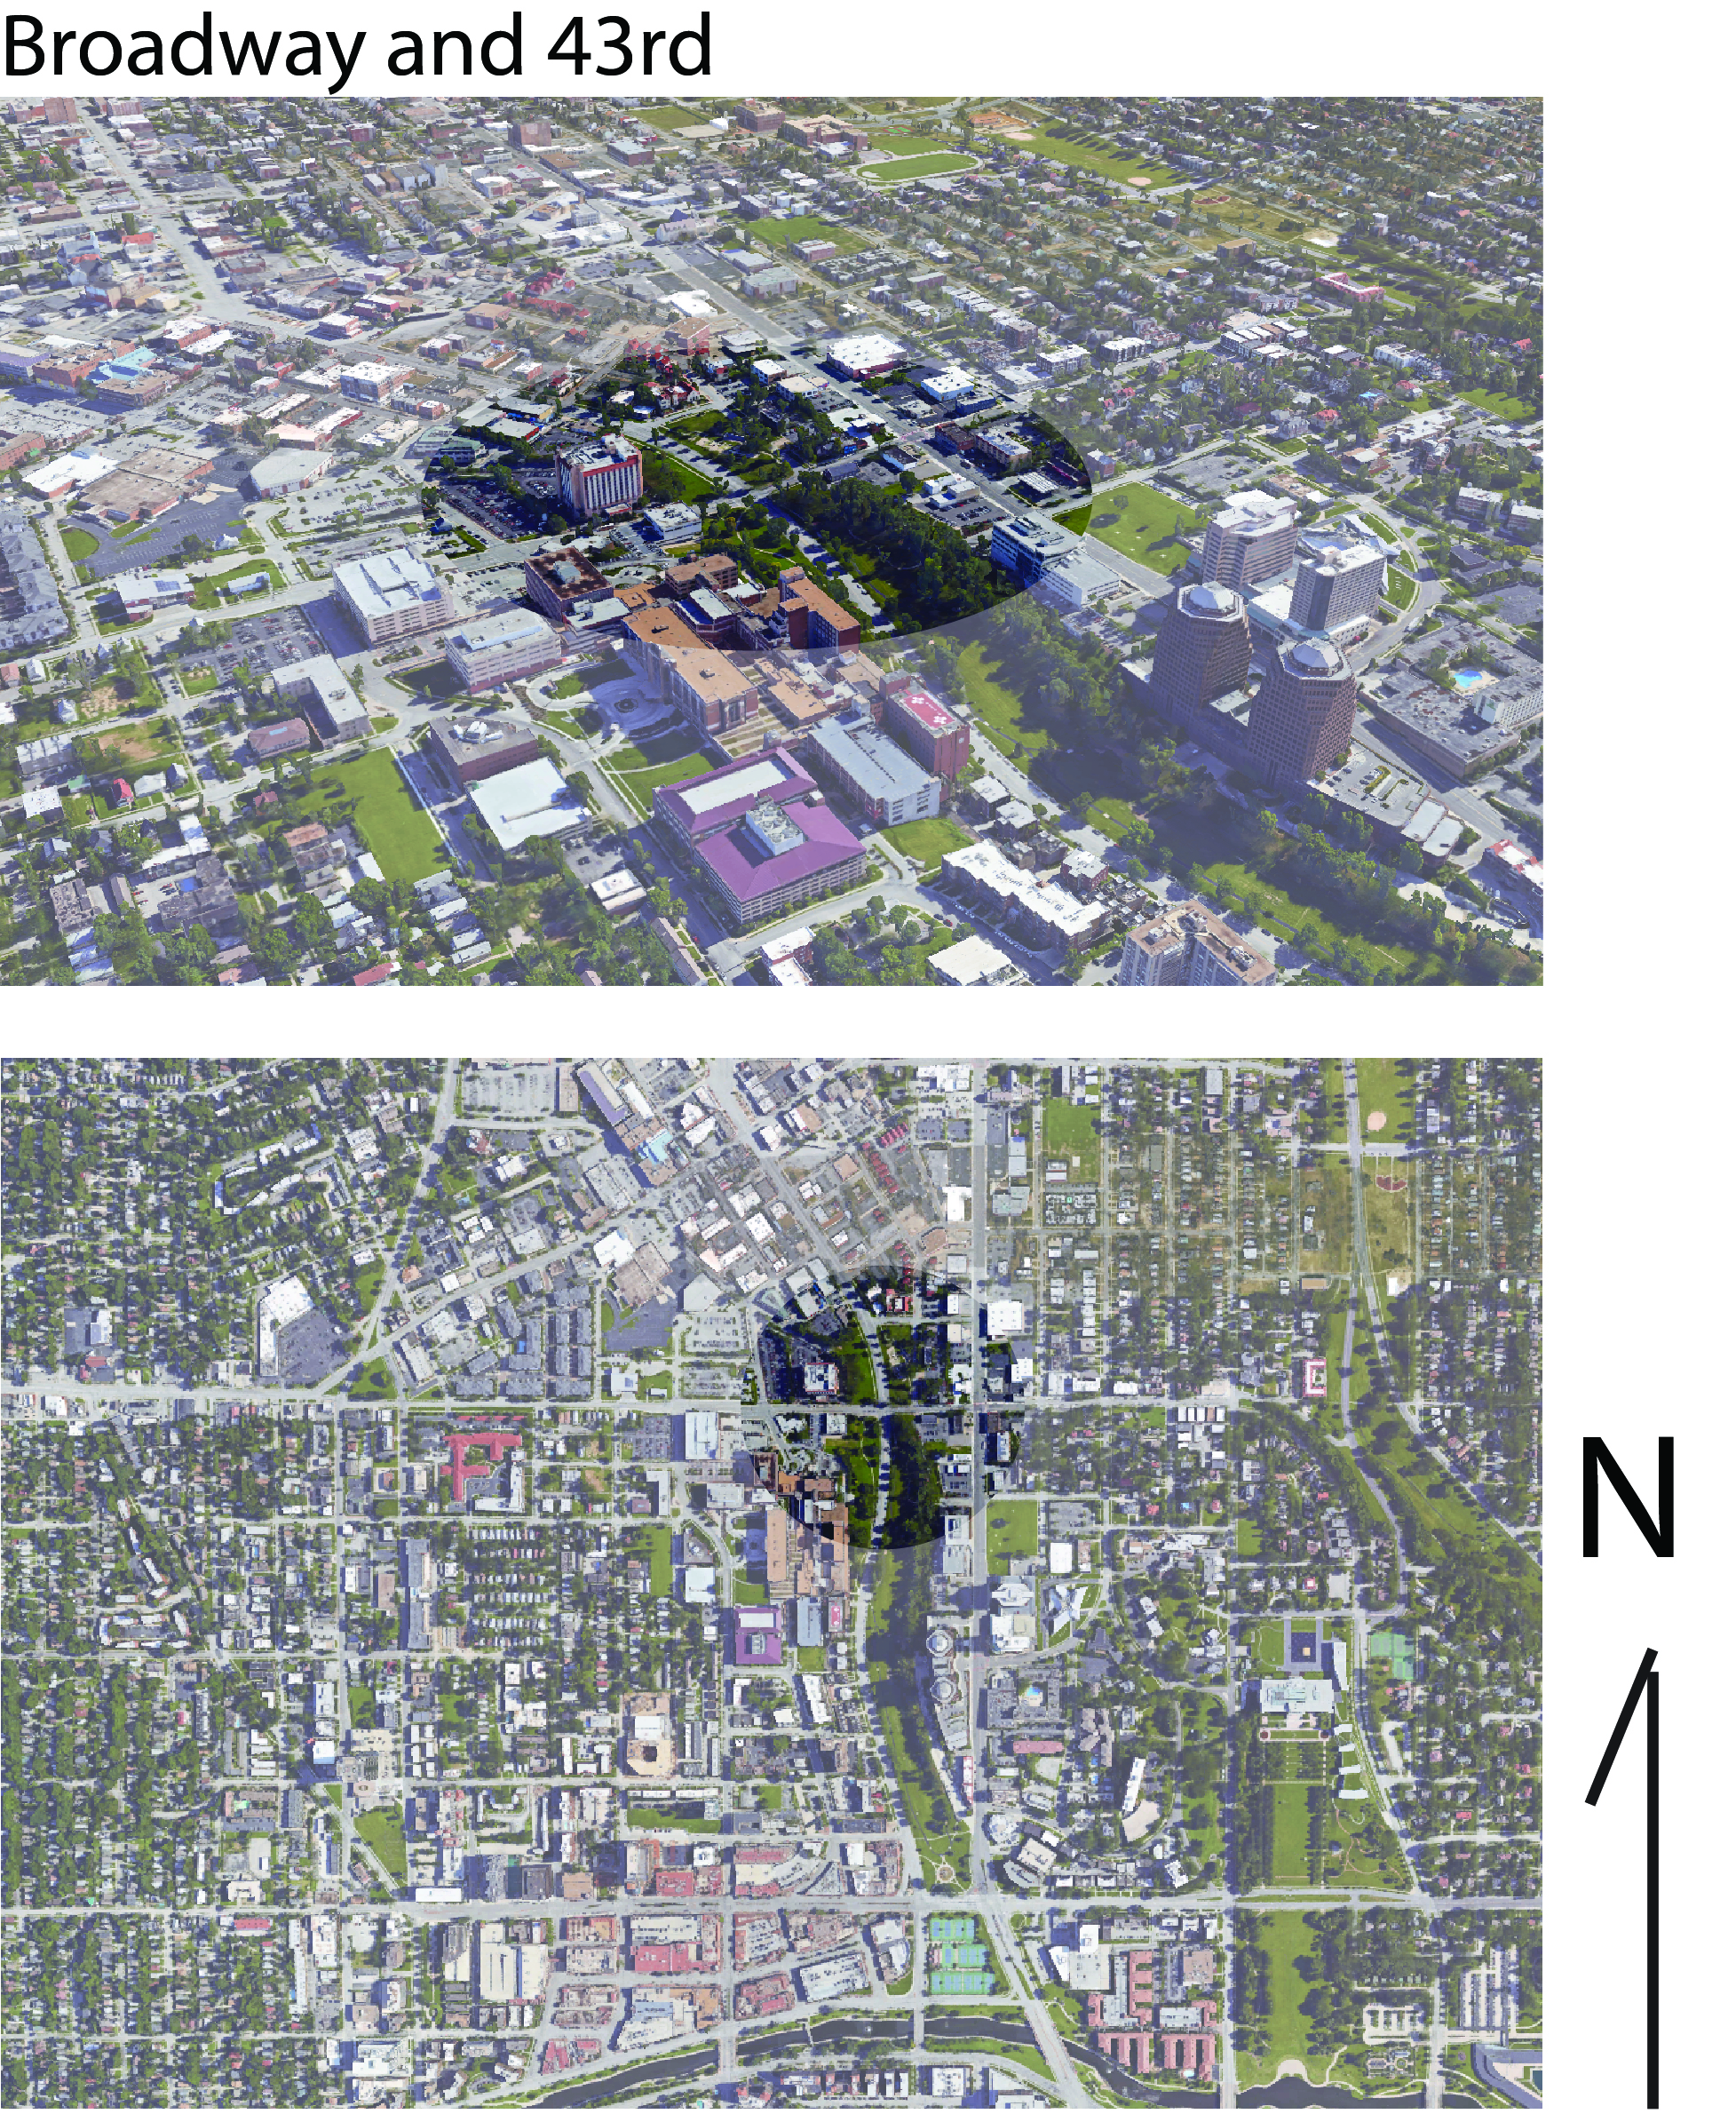
There are several noticeable changes that have happened at the intersection of Mill Creek/Broadway/ JC Nichols and 43rd street. The area in the parks and boulevard system is near the plaza and Westport. Up until the 1990s there was a railway bridge Westport area.
Changes
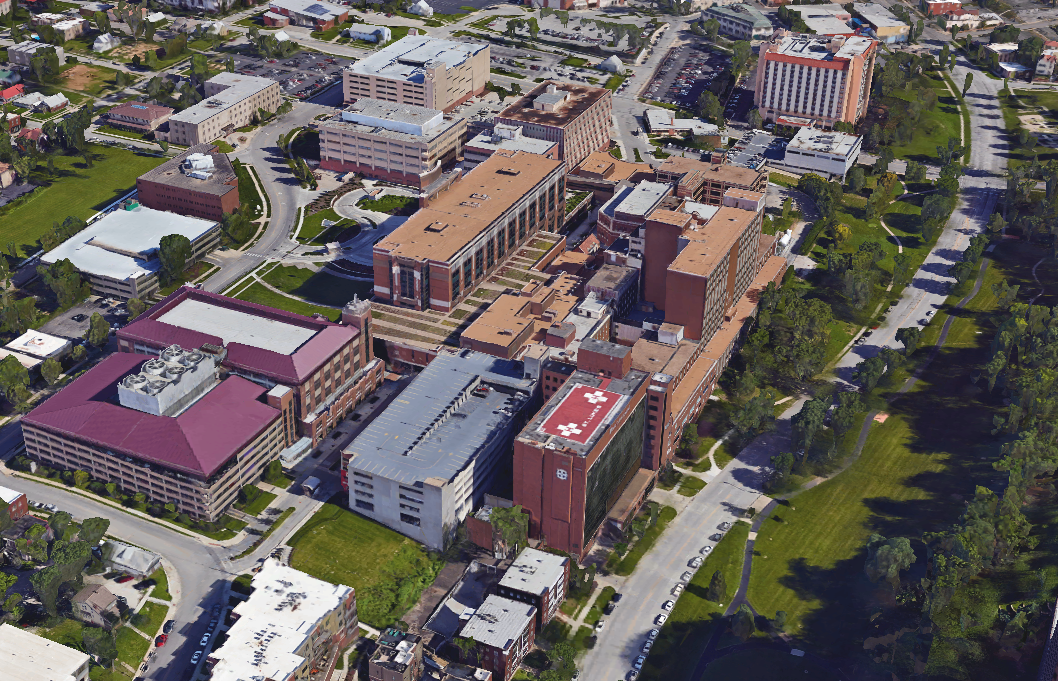
There is a vast change in several things besides the lack of a railroad. The street grid is completely altered. St. Luke’s hospital has changed the transit ways around the intersection and there is an almost completely different building foot print as well.
Land Use
The Midtown and Plaza Area have a very complex mix of land use. There are large areas of residential neighborhoods surrounding a mix of commercial businesses and institutional areas. The “knuckle” of Broadway Blvd/ JC Nichols and 43rd street represents this mix of land use that is characteristic of the general area. St. Luke’s represents a large institution and the location is also where the two commercial sectors of the Plaza and Westport collide. Running through all of this is Mill Creek park — the large green space that serves the many neighborhoods in the surrounding.
Zoning
The area has several zoning uses that are representative of the mix of zoning that is in the overall area. To the west of Broadway there is a large span of Urban Residential zoned land. To the east there is a Urban Redevelopment zoned area that spans along Main Street. To the north east of the intersection there is a commercially zoned area. As Broadway curves to the North West the zoning along the west side of the street is light industrial.
Other Plans and Land Use Conflicts
St. Luke’s Hospital is a large institutional land use that has expanded its size greatly in recent years. The zoning in the area is R-0.5 which is residential urban.There are other conflicting plans that institutions and neighborhoods have created. Southmoreland has developed an area plan and the Nelson has been working to develop a cultural district in the area.
Resources
Data was gathered from several sources including Google Maps, Google Earth, Midtown/ Plaza Area Plan by the planning department of Kansas City MO The Nelson Atkins Museum of Art Cultural District Plan, and The Southmoreland Area Plan
A quick analysis can be a vital tool to have in the planning profession. Last week my studio had the chance practice this type of study on different sections on the Kansas City Parks and Boulevard system. We had three sessions of quick analysis over different topics each time. I am going to talk a bit about one or maybe two.
Now it is pretty well documented that Kansas City, Missouri has lost over half of it’s total population since the early nineteen hundreds. There are many different reasons why that is depending on who you ask, but after analyzing the intersection of Armour and Broadway Boulevard, it became clear that new commercial development was also a leading cause in the population loss.
Along a few block stretch of Broadway, to the north and south of Amour, all of the intersections are offset. (Also referred to as a “knuckle” in our studio). The intersection of Armour and Broadway is a great example of a “knuckle” intersection, which can be found throughout the Parks and Boulevard system. Broadway is the west end-point for Armour, though W 35th street, which is slightly north of Amour does continue further west.
Image 1. 1925 Tuttle-Ayers Atlas of Amour and Broadway Boulevard
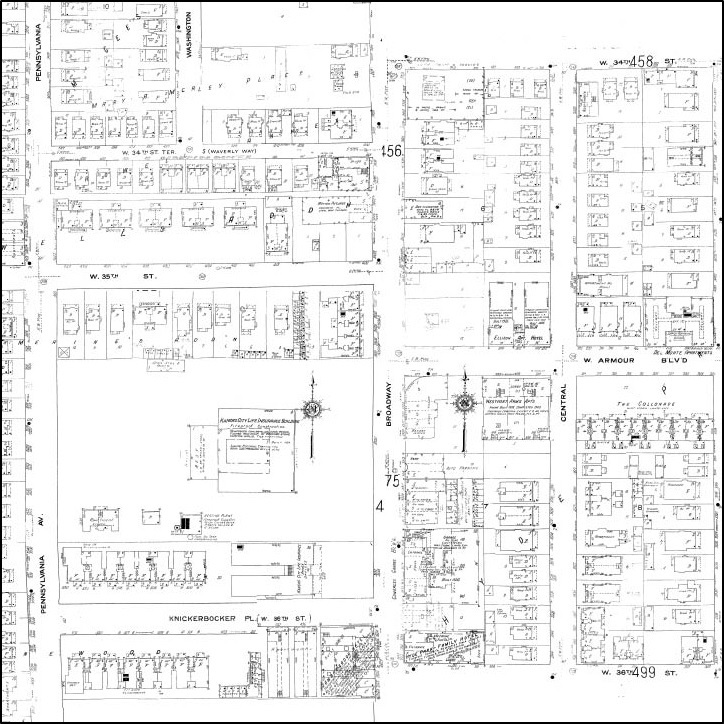
When looking at Figure 1, if you were going west along Armour Blvd toward Broadway, The Kansas City Life Insurance Company building uses the tree lined boulevard to create a terminated view, which is still beautiful today. The real takeaway from the 1925 Atlas maps is the vast amount of single and multifamily housing units surrounding the intersection. Fast forward 25 years to the 1950 Sanborns maps in Image 2 and the housing stock is almost unchanged.
Image 2. 1950 Sanborn Maps of Amour and Broadway Boulevard
Referring back to my statement about new commercial development being a leading cause to the fall in population, all you have to do is look at the 2015 aerial in Image 3. Intire blocks of housing along Broadway have been replaced with commercial buildings and vast amounts of parking lots. Just within the few block radious, there had to of been over a hundred housing units removed. It is without question that the Commercial development along Broadway has considerably weakened the community aspect of the neighborhoods along the corridor, which can have a negative effect on the housing stock.
2015 Aerial of Amour and Broadway Boulevard
Even though Broadway Boulevard is considered a commercial district, the surprising fact is that parking lots were allowed to abut the parcel lines along Broadway Boulevard, even on the most recent development today. Now, I know not every road can be a boulevard, and they do not have to be. Some boulevards are better positioned to support a strong economical commercial district, but shouldn’t the passion to preserve a piece of history such as Broadway take priority over a cheap little shopping center? Hopefully the new Parks and Boulevard development regulations that are to be voted on soon solve these issues. Because the city sure needs them.
Sources
Google Earth. 2015
Tuttle-Ayers 1925 Atlas of Kansas City, Missouri. [map] 1925. Plate 52,53,62,63
Sanborn Map Co. Insurance Maps of Kansas City, Missouri. [map] 1950. Sheet 456,475,476