I was responsible for gathering data on Public and Private school enrollment by age. I thought the best form for representing this data effectively were through graphs. The graphs show the number of students enrolled in public vs private schools. Demonstrating how many enrolled students are in each census tract of our study area by school type preliminary school, Kindergarten up to 8th grade, 9th through 12th, and college.


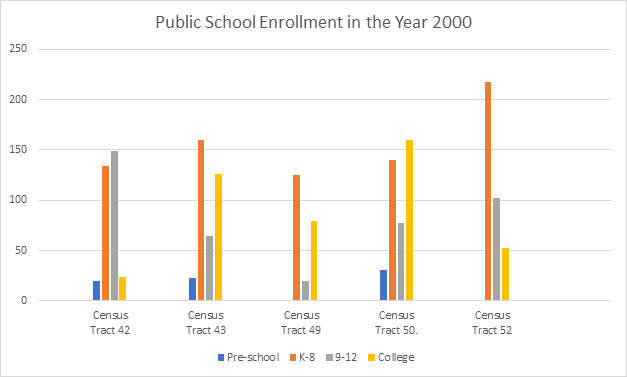
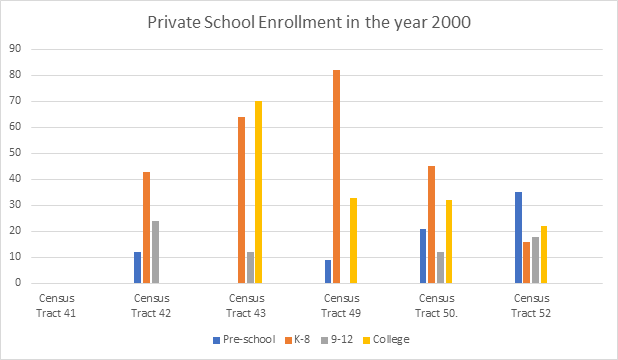
For 1990 School Enrollment Social Explorer joined the grades elementary through high school. Private enrollment for preliminary and college students have a larger significantly larger number. Comparing them to the year 2000 the enrollment for college starts to be more apparent throughout each tract for both public and private schools.


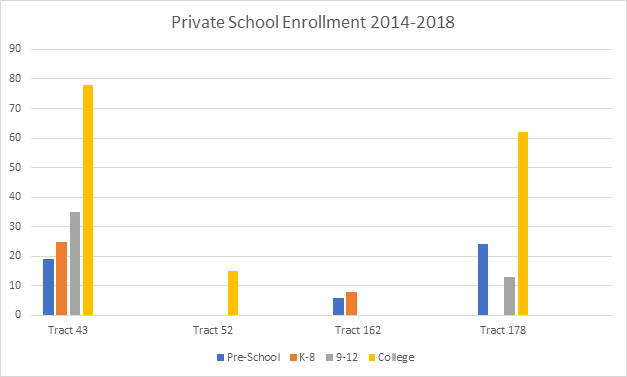
A commonality we see in 2008 through 2018 is that there are more enrolled students for tracts 43 and 178. There’s very few students in tracts 52 and 162. The biggest contrast throughout the years is a significantly larger enrollment for private schools in the years 1990 and 2000. Whereas the years 2008-2018 apart from tract 43 and tract 178 there is a decline of private school enrollment.

Resources:
https://www.socialexplorer.com/explore-maps
https://factfinder.census.gov/faces/nav/jsf/pages/index.xhtml