
1890s 
1920s 
1950s 
1990s 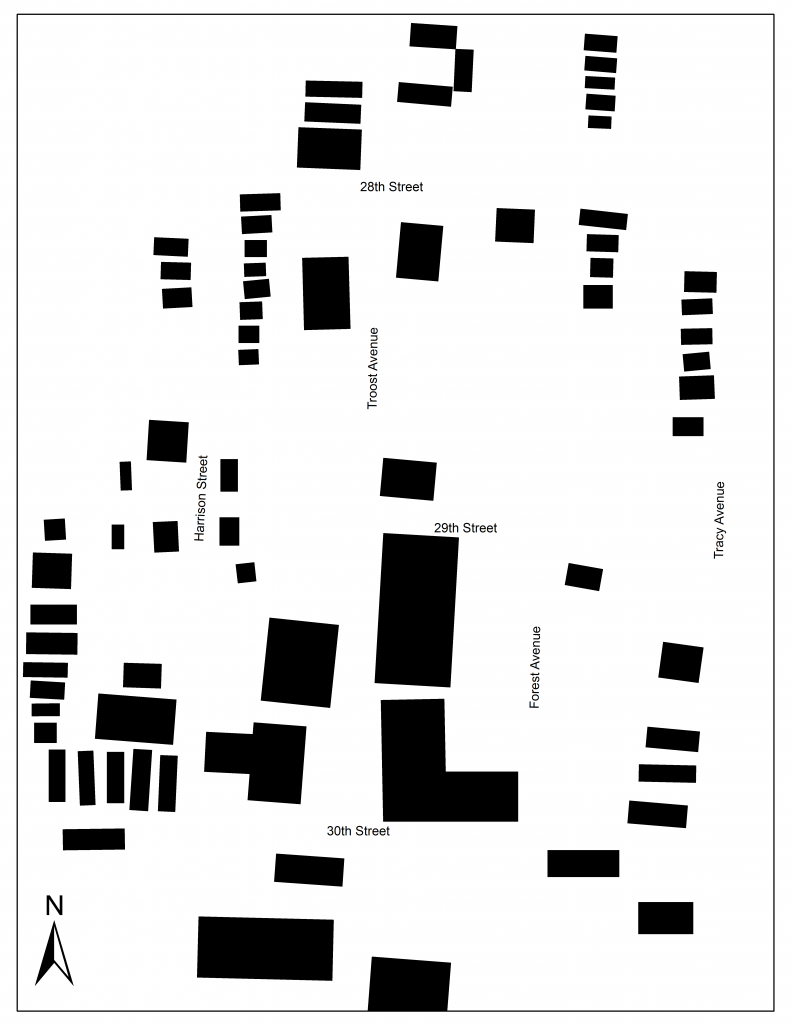
Today
For the area that I had a historical analysis, I had the blocks between Tracy Ave. and Harrison Street and 30th street to 28th street. The years of study for the figure-ground range from the 1890s, 1950s, up to today. Creating a figure-ground from data sources such as Sanborn maps through the Umkc library, map data gathered from Kansas city parcel viewer, Historical ariels and from google earth images.
As one can see from the 1890s figure-ground there wasn’t much development going on in this area. In the 1920s figure-ground, you can see a lot of development that has occurred since the 1890s. But then in the 1950s figure-ground many of the bigger buildings from the previous decades are gone and in this area a lot more residential buildings such as single-family homes and I few smaller industrial-sized buildings. In the 1990s figure-ground, we then start to see a decline in buildings as we start to notice an increase in vacant lots which seems to follow this even up to the figure-ground showing the area of today.