The detailed analysis of the Main Street Corridor reveals many interesting facets regarding present land use and prospects for Transit-Oriented Development in midtown Kansas City, Missouri. The LBCS analysis of “Activity,” “Function,” “Structure,” and “Site” gives insights into the raw spatial use, economic potential, architectural quality, and developed status of the corridor. Lastly, “Ownership” reveals the breakdown of local versus non-local ownership, along with any useful limits that constrain use of said property.
Further, an examination of “intensity” analyzes the “quantity of a particular use allowed at a particular location” (Kelly, 2010). Residential intensity is commonly measured in the number of dwelling units per acre. Commercial and industrial intensity is measured in floor area ratio (FAR), or the “ratio of the floor area of the proposed building to the land area of the lot on which it will be built” (Kelly, 2010). For a structure with an FAR of 3, for example, the building’s square footage would be 3 times the square footage of the parcel.
As such, these measures give insight into the volume of use and resulting impact of development on its surroundings. This volume of intensity corresponds to the bulk, height, massing, and orientation of the structures. Also, with increased intensity often comes intensified auto use. Thus, the impacts of increased intensity should be carefully analyzed as to not disrupt areas of lower intensity. Zoning regulations demarcate space and limits for particular types of uses and intensities, ideally to minimize conflicts between incompatible land uses. To illustrate, a primarily low-intensity, single-family residential district may express concerns over the nearby development of a more intense commercial structure.
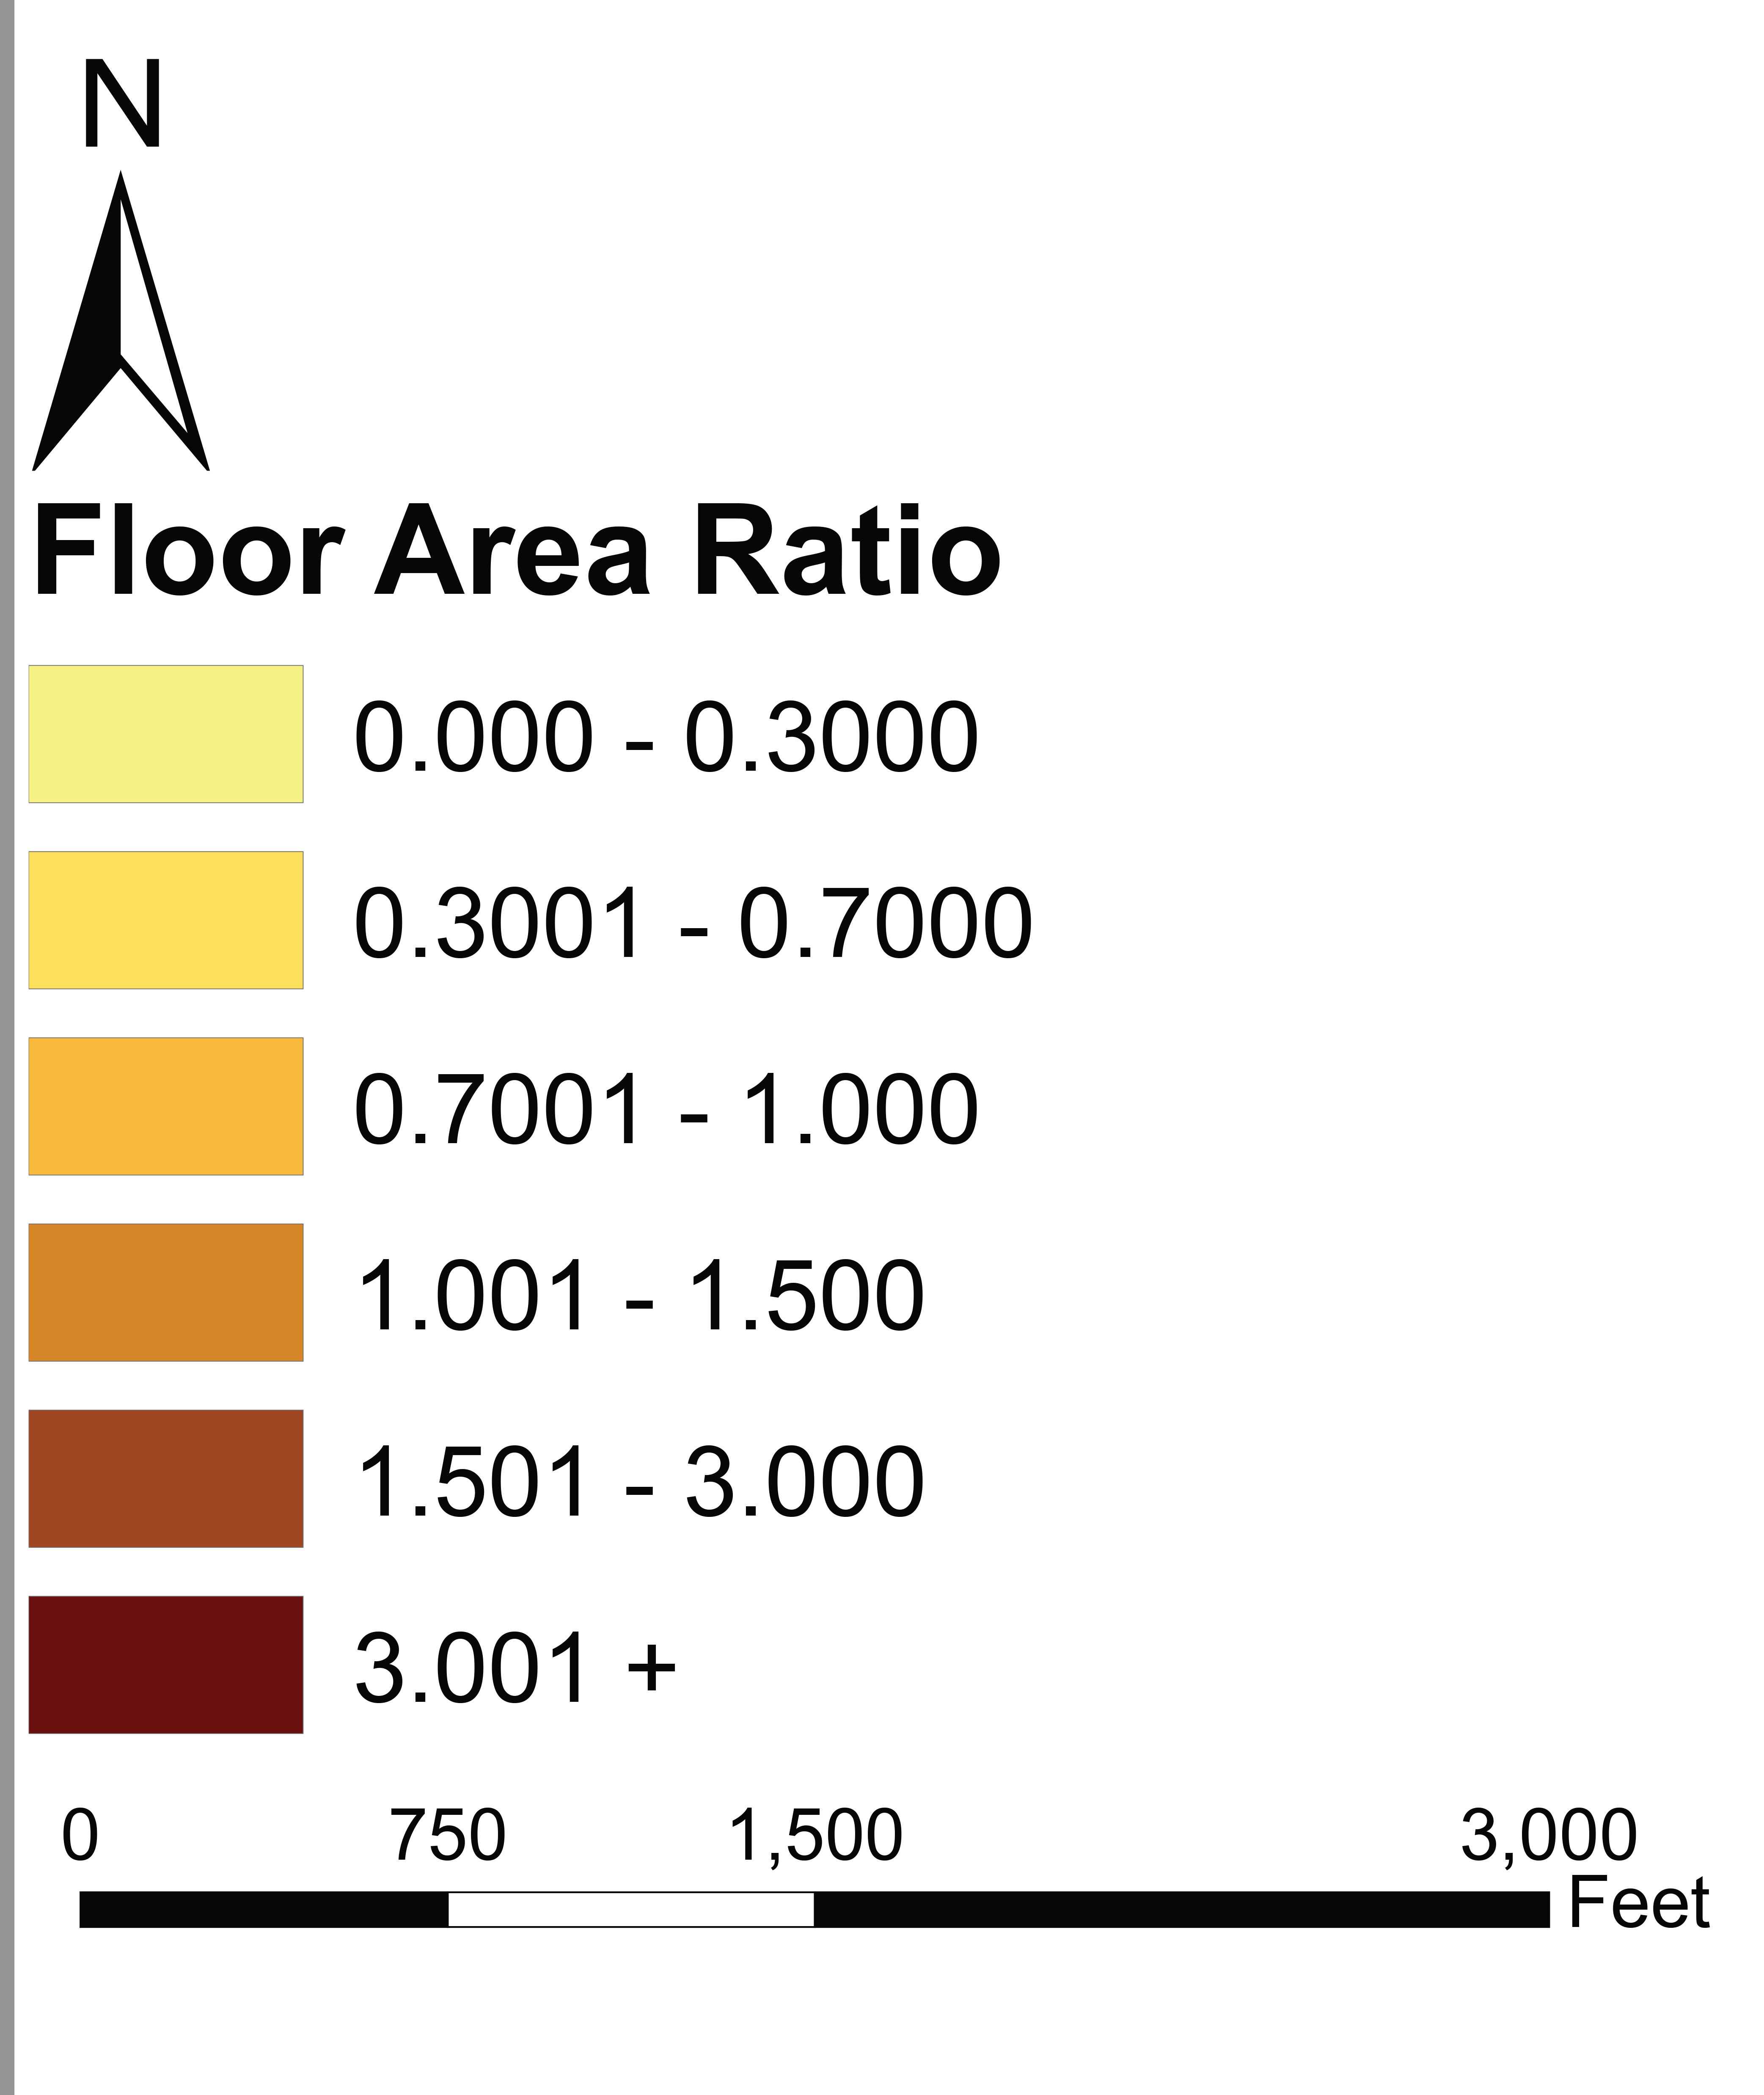
Along the Main Street Corridor, one sees a variety of trends regarding intensity. The FAR graphic below displays intensity on a gradient from light yellow to dark red (lowest to highest intensity, respectively).
Floor Area Ratio along Main


Overall, the Main Street Corridor is characterized by relatively low intensity. The node surrounding Westport Road and Main reflects a higher level of intensity, as do the parcels containing the American Century Investments buildings. However, there is rampant opportunity to increase density along the corridor, while still preserving the single-family character of the neighborhoods that flank Main.
the graphic below illustrates the type and number of units in the residential structures along the corridor. Single-family homes are well-represented along the corridor (illustrated in yellow). The number of units in multifamily structures increases in intensity from light red to deep red (fewer units in structure to higher units in structure, respectively).
Residential Type and Units in Structure


Overall, while there are a multiplicity of housing types with varying intensities, the corridor could still readily increase its density. The analysis of intensity (in terms of FAR and units in structure) uncovers the relatively low-intensity of the corridor. In order to facilitate TOD, the corridor must increase residential intensity (in terms of density) to increase transit ridership. Further, allowing the potential for higher FAR commercial structures impacts developers’ returns on investment along the corridor. Through TOD zoning overlays, the city can tailor intensities around certain nodes to become attractive for private investment. These conceptions of intensity are critical to realizing the transit and development potential of the corridor.
Source: Kelly, E. D. (2010). Community planning: An introduction to the Comprehensive Plan (Second ed.). Washington, D.C.: Island Press.
