Census Report / UPD 260
Abigail Newsham
*Please excuse the poor graphics… WordPress is not playing nice.
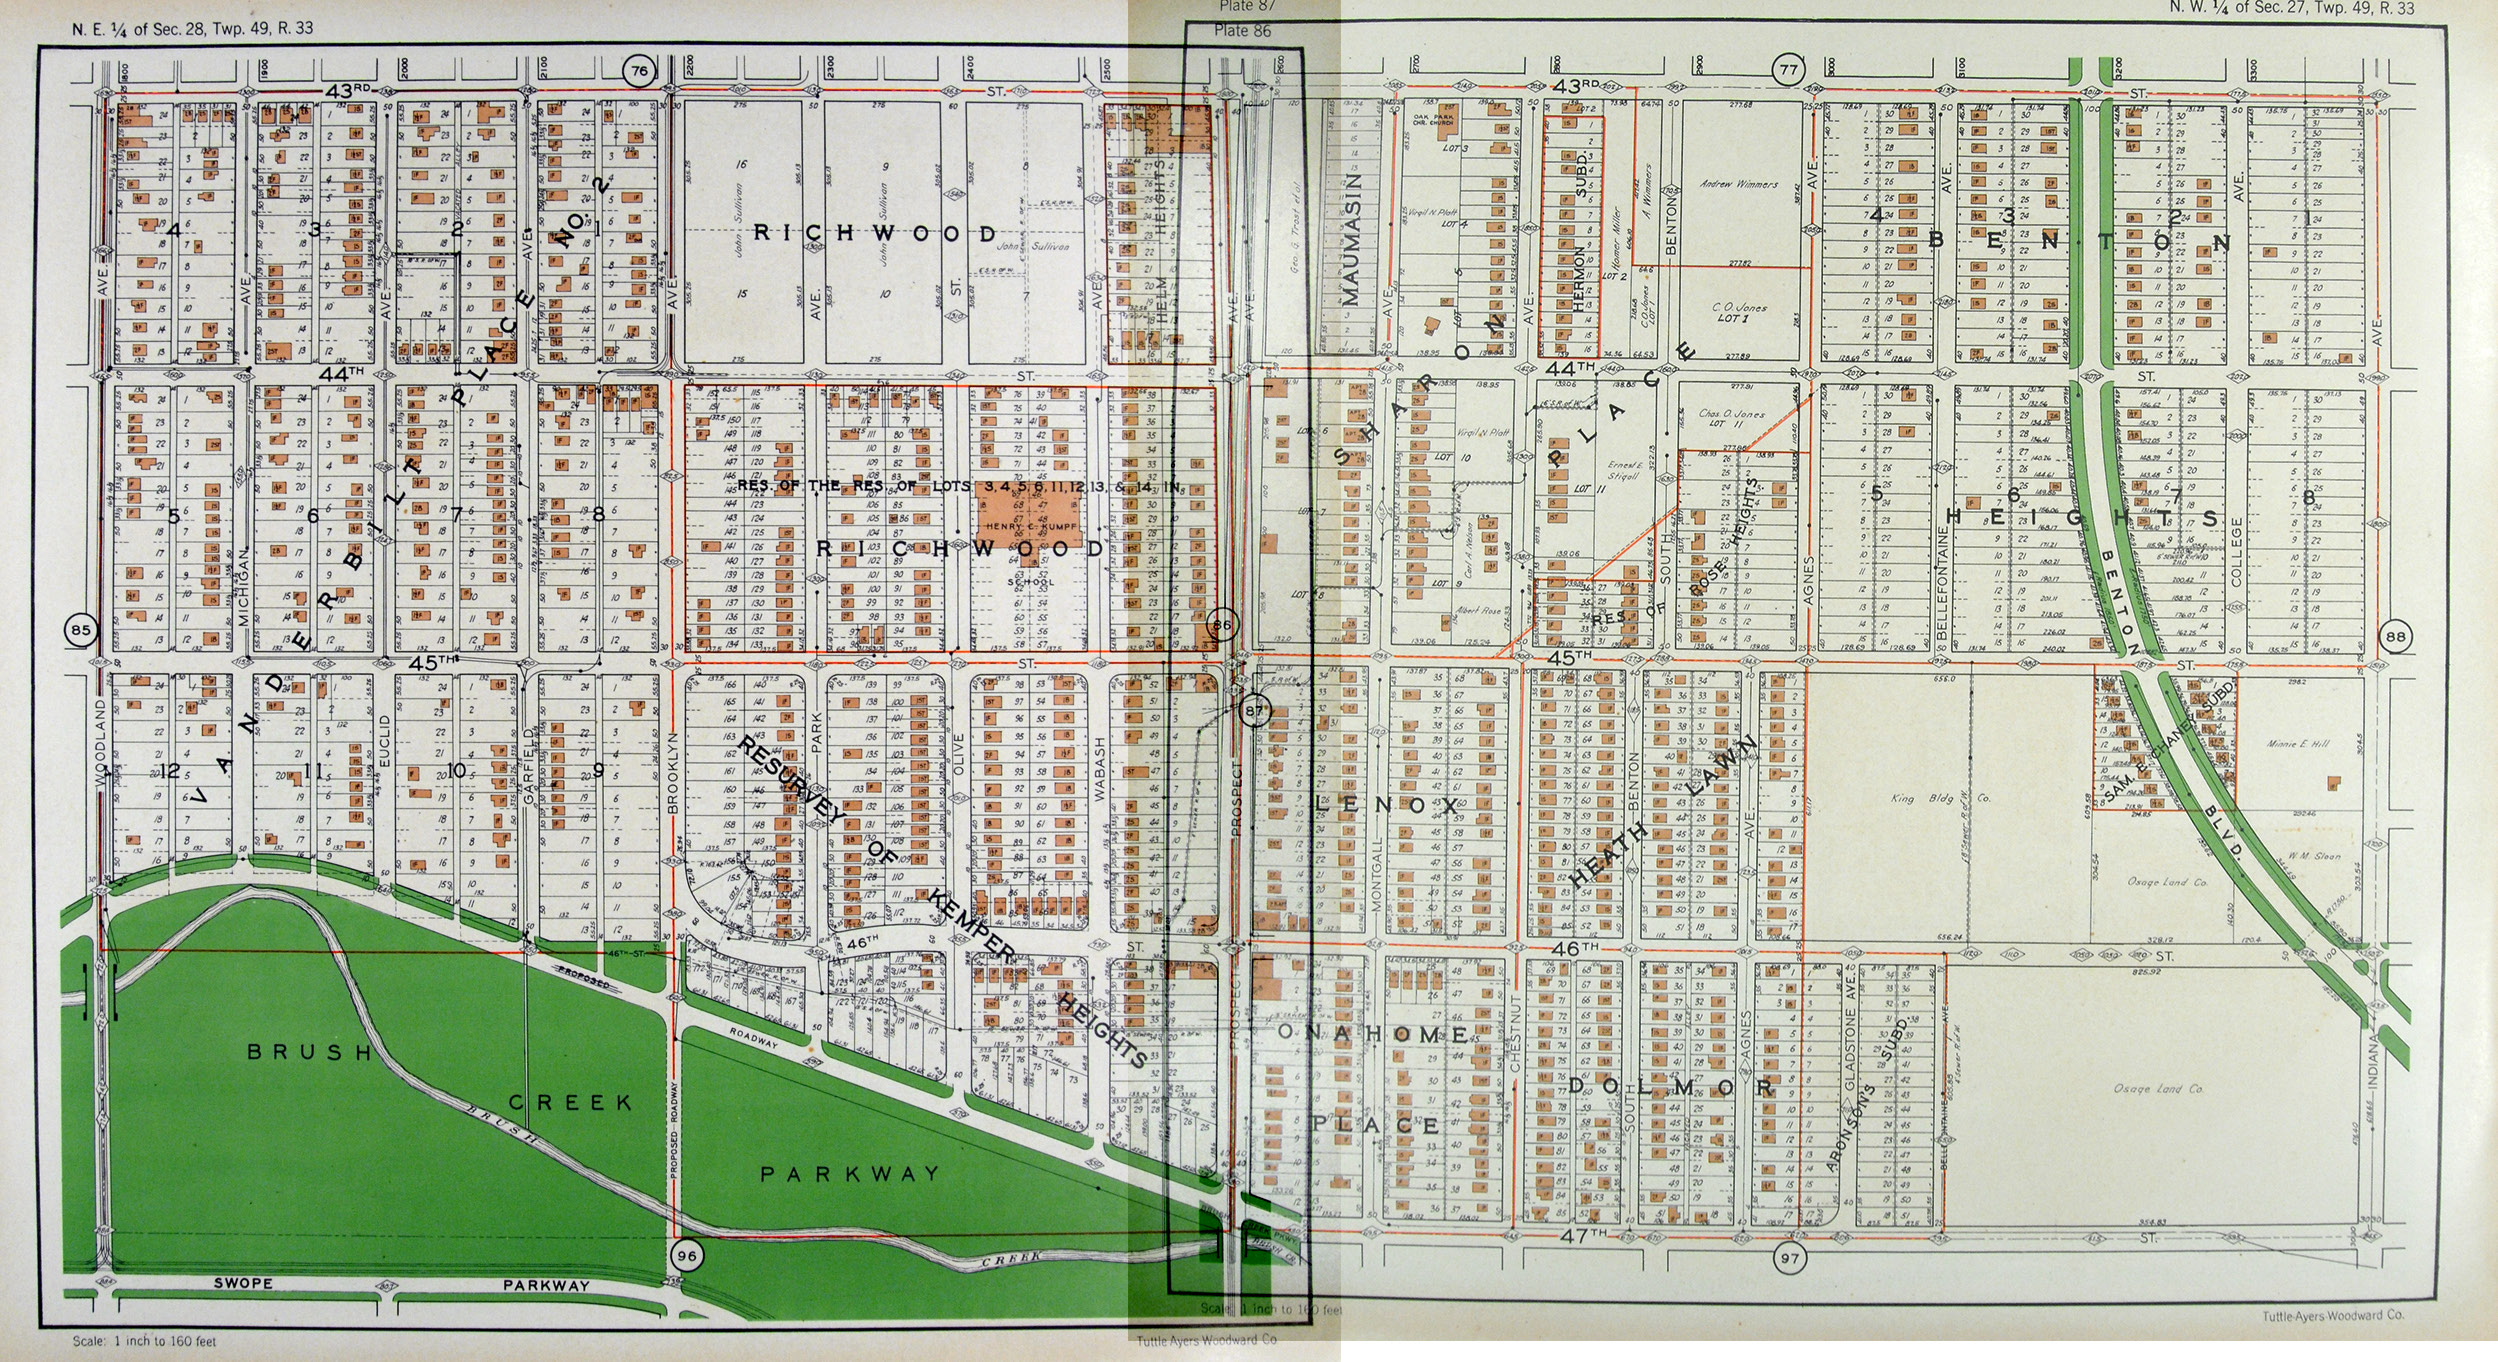
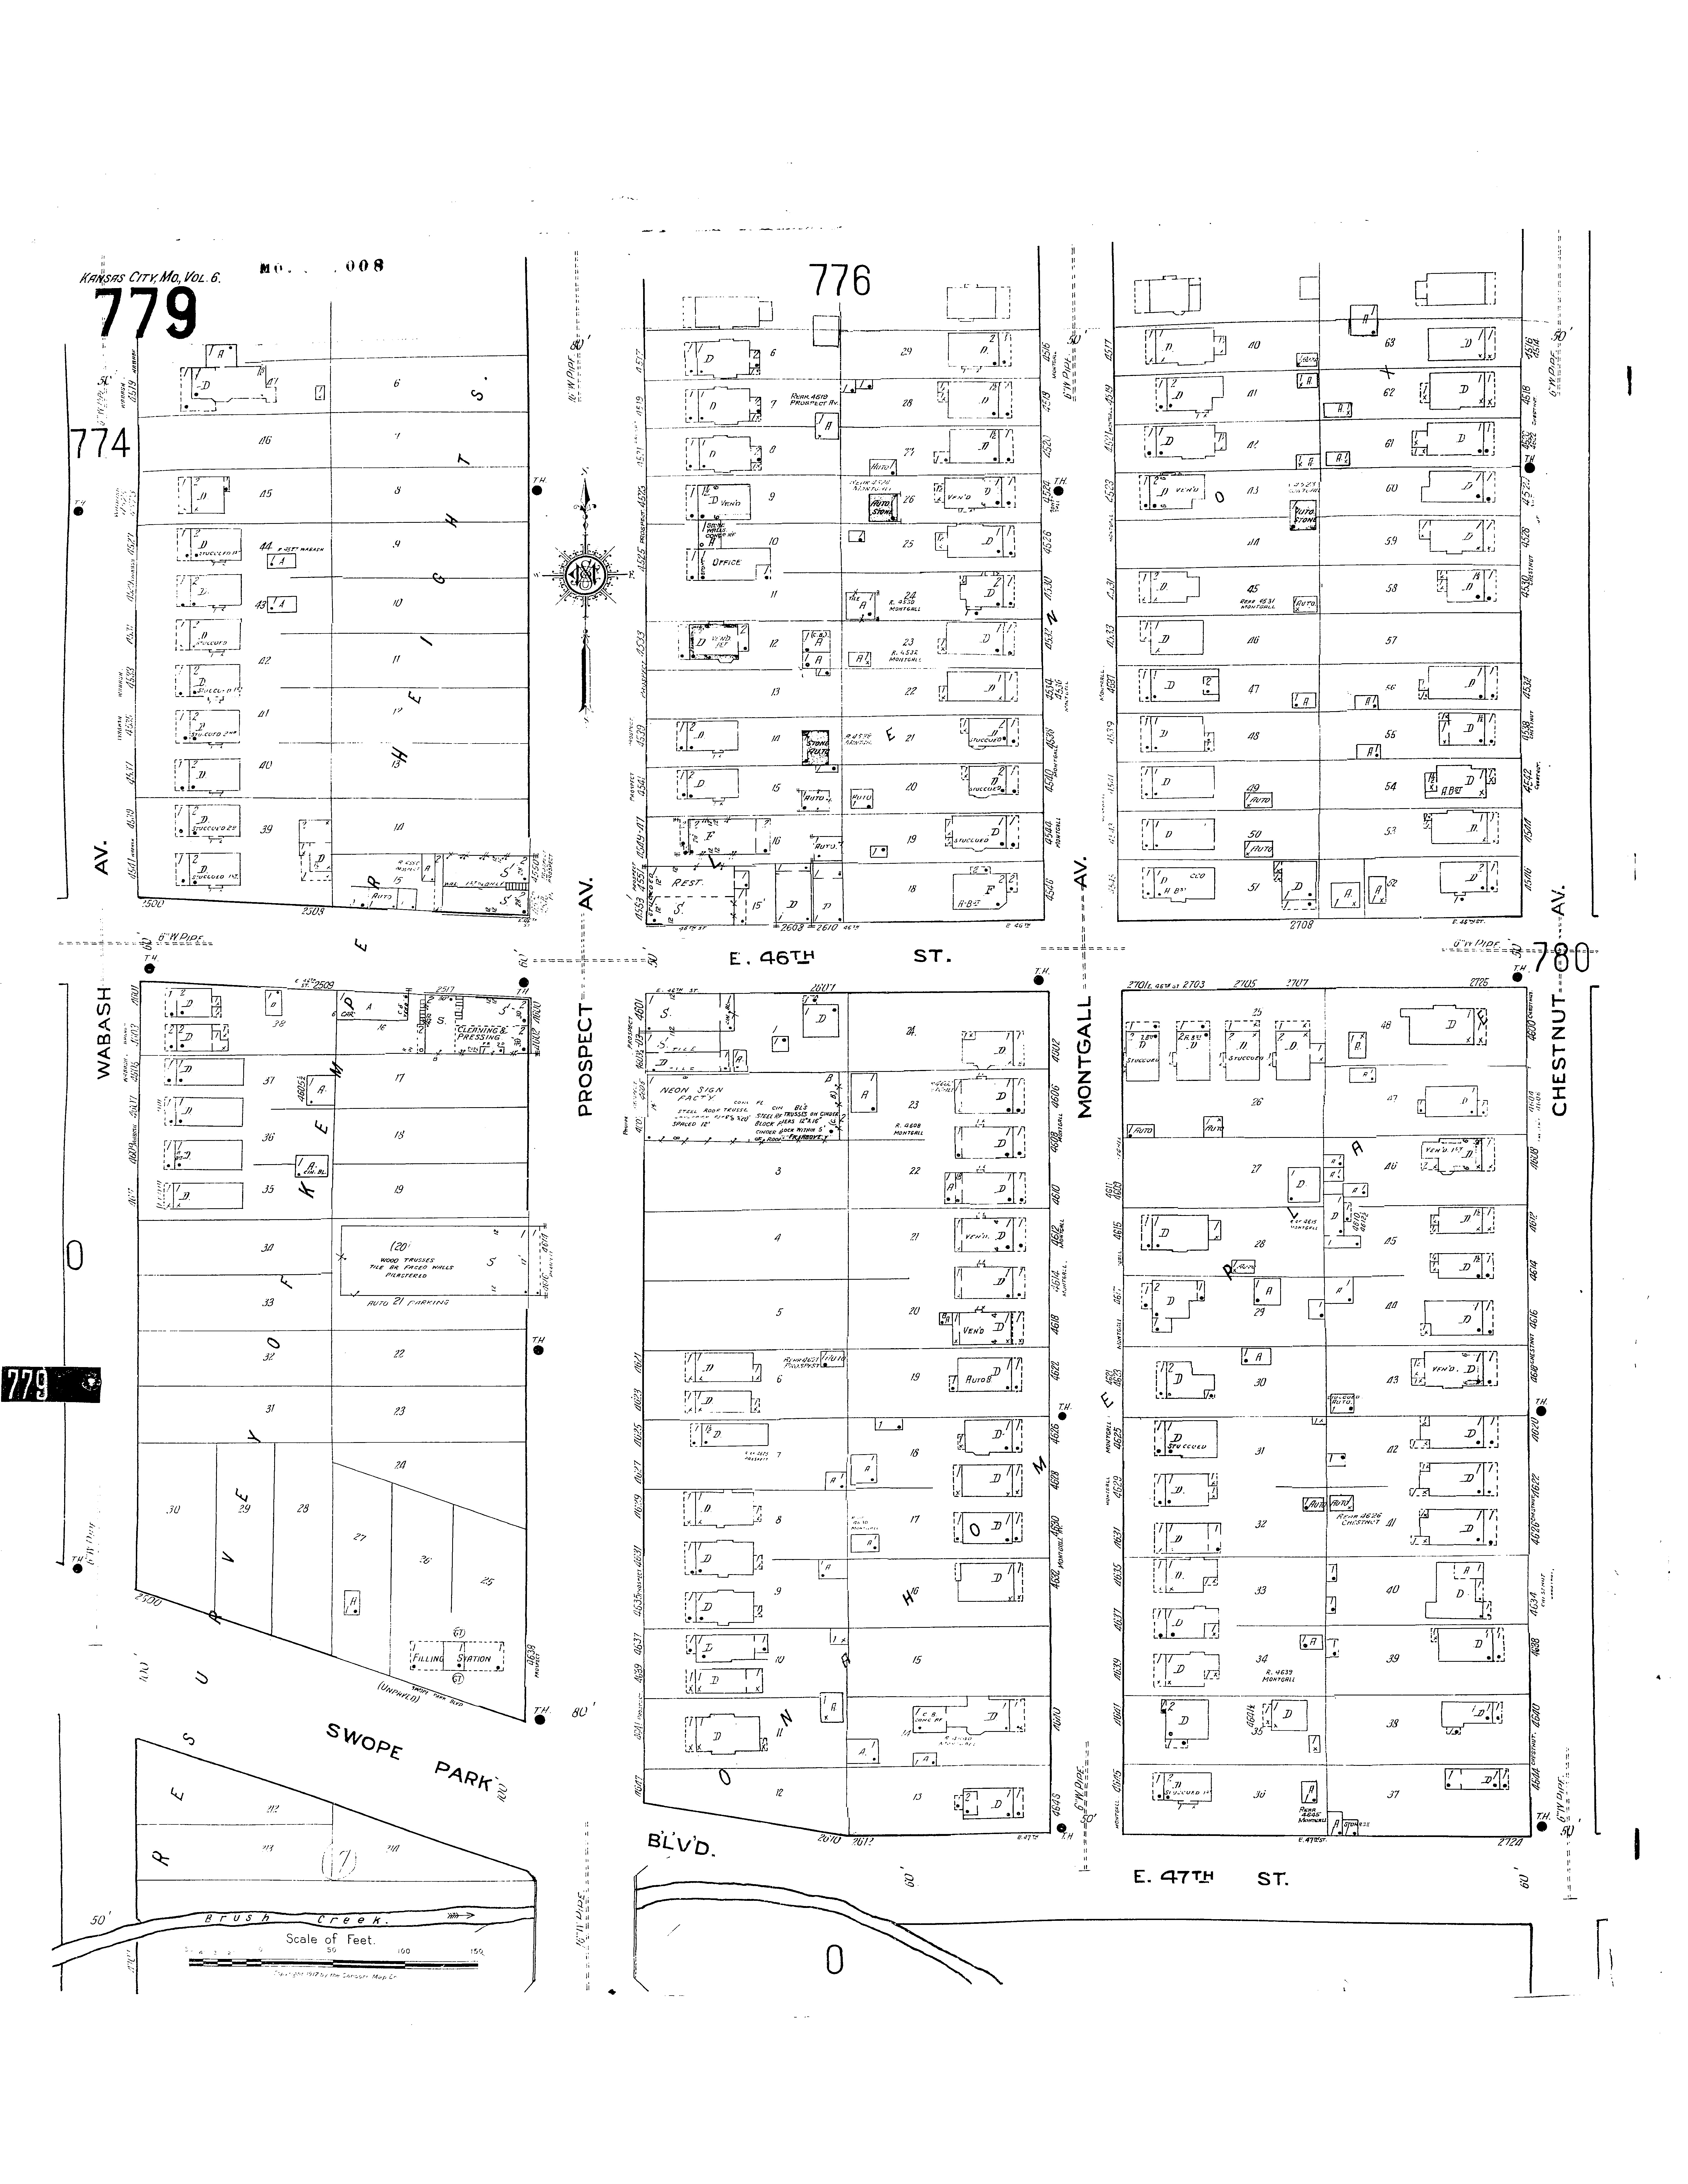
Kansas City’s Prospect corridor has had significant changes in demographics since the 1950s. Since the 1950s, the United States has undergone a series of housing policies and initiatives, aiding in the displacement of city residents (primarily lower-class and minorities), increased incentives for sprawled development, and the changing make-up of residents in the inner-city neighborhoods. This report will cover population, gender, race, age, income, and housing data changes for the years 1950, 2000, and 2010 for census tracts 61, 62, and 63. These tracts are located along Prospect Avenue between 46th Street and Swope Parkway. It is important to note that census tract 62 does not apply to the years 2000 and 2010, as census boundaries have changes since 1950. Tract 62 is, however, included in the report for 1950 data. To analyze the data concisely, totals have been provided for all years.
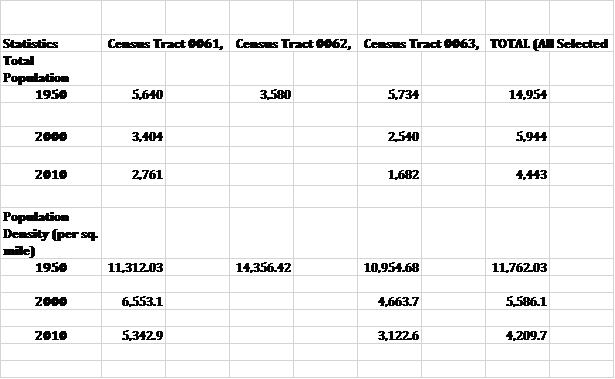
Table 1. Population Data over Time
Unsurprisingly, population counts and densities for the areas along Prospect between 46th Street and Swope Parkway was highest in 1950. In 2000, 50 years later, total population counts dropped by more than sixty percent. Population densities have also dropped significantly since the 1950s. These changes may be partially attributed to post-1950s FHA-backed mortgages which aided in new, sprawling housing development in the United States. From 2000 to 2010, population counts and densities appear to be continuously decreasing in this area.
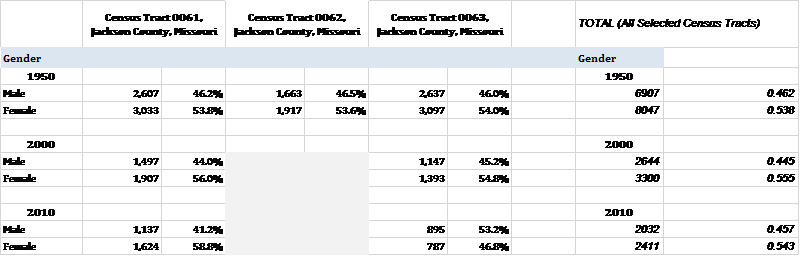
Table 2. Gender changes over time
The composition of male and female residents has remained somewhat steady since the 1950s, with historically higher proportion of females. The proportion of females has risen slightly since the 1950s.
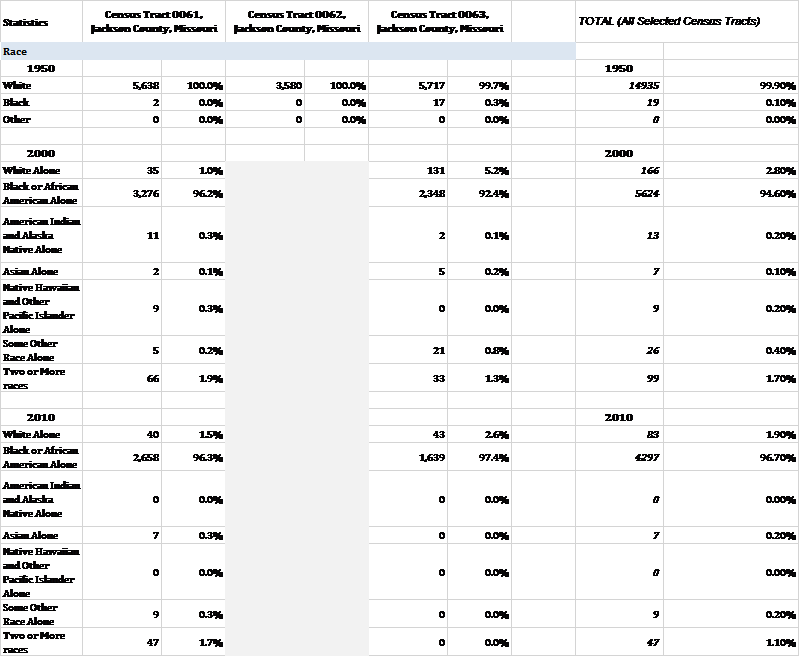
Table 3. Race/Ethnicity changes over time
The data showing changes in ethnic populations is not as transparent. Practices for collecting racial data for residents has changed since the 1950s, as the 1950s census only collected data for populations identified as “Black”, “White”, and “other”, whereas “other” can be American Indian, Asian, Hispanic, etc. Despite these incongruences, there are not very high proportions of populations identified as any other race but White and Black for the years 2000 and 2010. In the 1950s, this area was almost one-hundred percent white. By the year 2000, less than three percent of the population in this area was White, and almost ninety-five percent was Black. In 2000, there was almost two percent of the population identified as “more than one race”. Census tract 63 has a pattern of being more diverse than the other tracts (“diverse”, being used as loosely as possible), as it held the highest proportion of Black residents in the 1950s, and the highest proportion of White residents in 2000 and 2010. By 2010, the residents in these census tracts are almost completely Black, and there are low proportions of those identifying as two-or-more-races, White, Asian, or “some other race alone”.
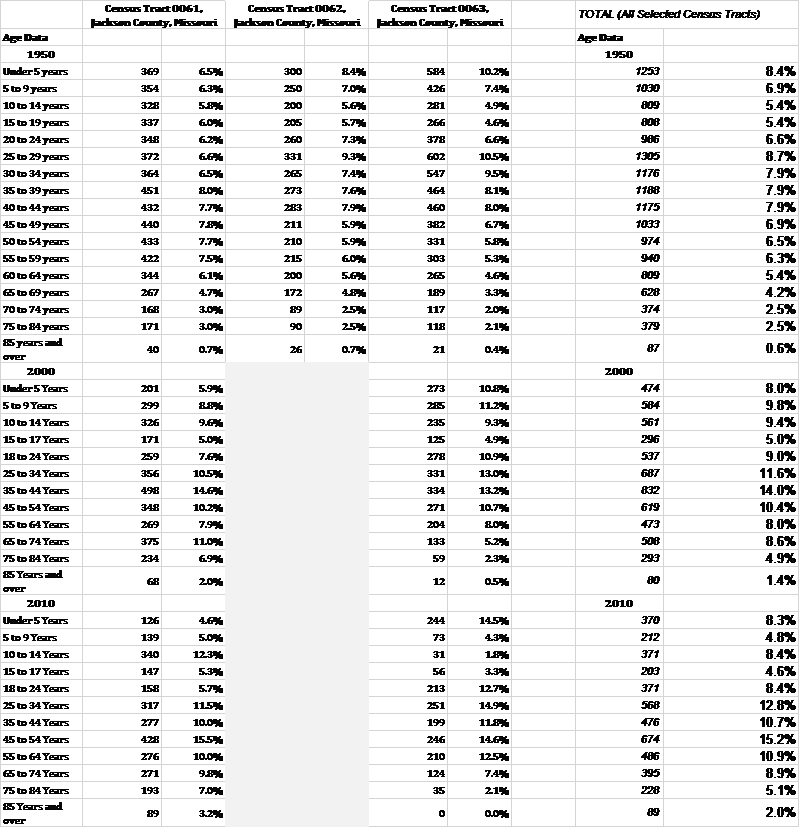
Table 4. Age Proportions
In the 1950s, the proportion of age cohorts were relatively higher for people under 64 years of age. The proportions are relatively stable, ranging from around five to eight percent. No cohorts make up more than nine percent of the population. In 2000, there is a shift in age proportionality. There is a lower proportion of populations over 55 years of age, and populations 25-55 years of age make up more than thirty percent of the population. Since the 1950s, population ages tend to be concentrated within cohorts between 18 to 55 years.

Table 5. Income over time
The dollar amounts for income data has been adjusted to the 2010 value. When adjusted to inflation, the data shows that median household income has decreased in the study area since 1950. Census tract 61 has contained historically higher median household incomes since the 1950s. The most significant change in income is shown in tract 63 between the 1950s and 2000s. This dramatic change may be caused by the changing geographic boundaries for which census data is collected. Tract 62 had very low relative incomes in the 1950s, and the change in census boundaries may have lowered the median income values for the year 2000 and 2010.
In 1950, it was less common for the residents in the study area to have educational attainment greater than high school. Most people had “at least some high school”, according to the census data. Only six percent of the population had 4 years of college.
In 2000, less than thirty percent had an educational attainment that did not include the completion of high school. While the proportion of (assumed) high school graduates remains consistently in the mid-thirty percentile, the proportions of residents having at least some college has risen by five percent.
Educational attainment data has not changed much since the 1950s. In 2010, the percentage of high school graduates (only) were in the high thirties, while proportions for people having completed some college remain mostly consistent.
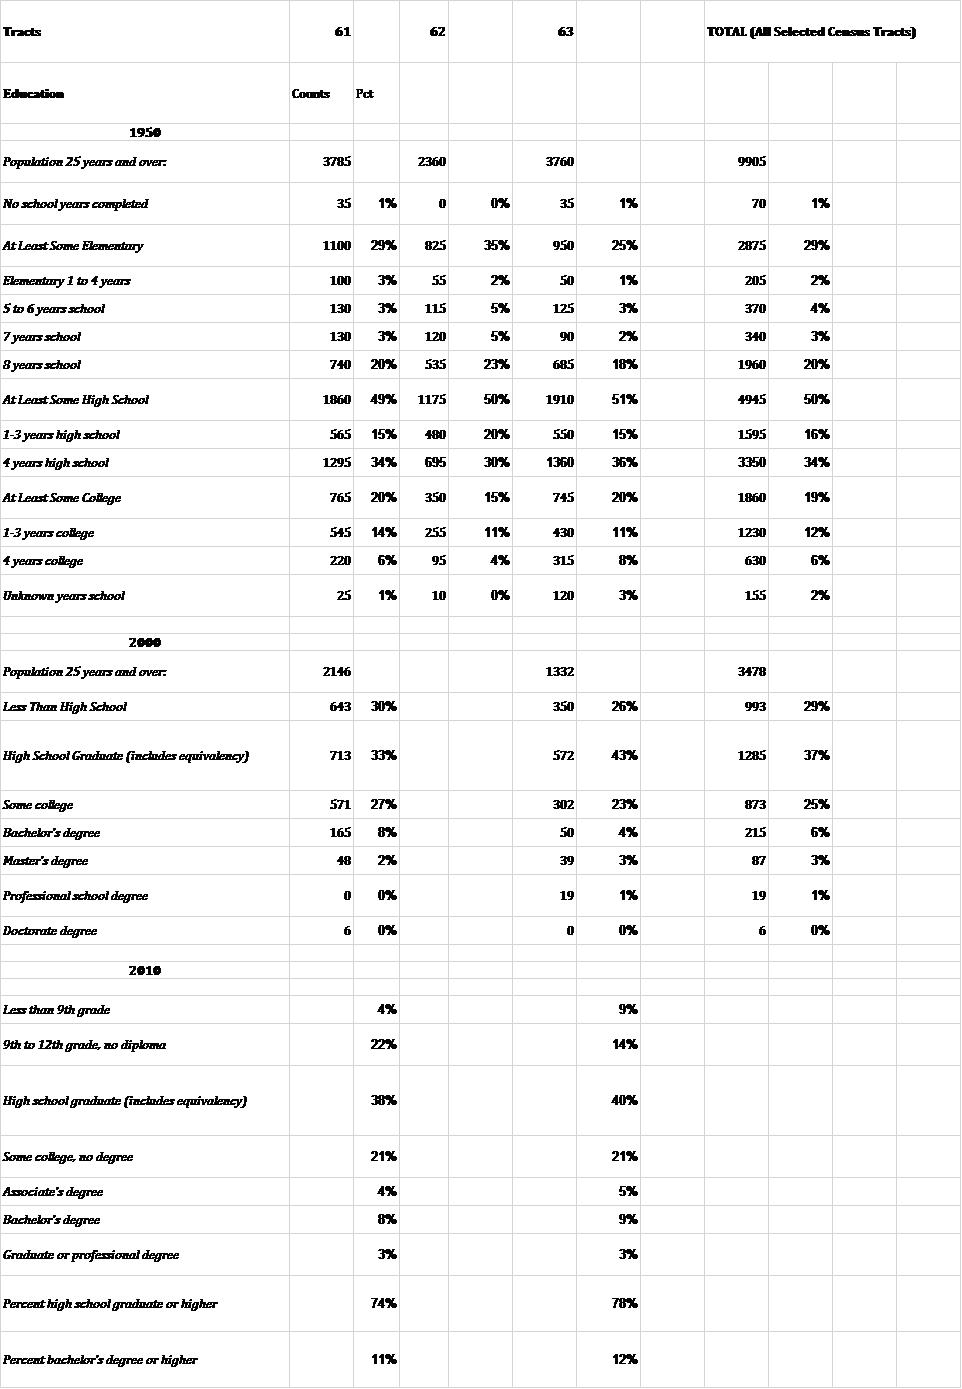
Table 6. Educational Attainment

Table 7. Housing Data
There was almost no housing vacancy in the study area in 1950. Tract 61 had the highest rate of owner-occupied housing units, at seventy-two percent. Tract 63 showed an almost equal proportion of renter versus owner occupation, and tract 62 was only thirty-percent owner-occupied. Overall, there was a range of housing needs met in this area, possibly reflecting residents’ differing ability and interest in owning a home. This neighborhood catered to both needs. Additionally, vacancy was at its lowest.
By the year 2000, tract 61’s owner-occupancy did not change significantly. Tract 63 does have a significant drop in owner-occupation, containing data which was formally in tract 62, possibly lowering the average value. The proportions of owner versus renter occupancy for the area as a whole, in 2000 and 2010, are about 50/50. However, in 2000, vacancy in this area increased to about twelve-percent since 1950. By 2010, vacancy overall is almost thirty-percent.
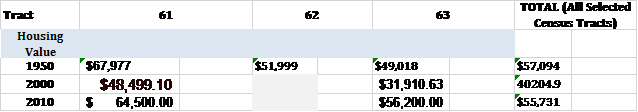
Table 8. Housing Value
In the 1950s, tract 61 had the highest housing value. However, when values are adjusted to inflation, there is not a significant decrease in housing value shown in the data. The year 2000 appears to be a low-point for housing prices.
Citations
United States Census Bureau. (2000). MEDIAN VALUE (DOLLARS) FOR SPECIFIED OWNER-OCCUPIED HOUSING UNITS. (Census 2000 Summary File for Tracts: 61, 62, and 63). Retrieved from American Fact Finder. November 2016.
United States Census Bureau. (2010). 2005-2009 American Community Survey 5-Year Estimates: Financial Characteristics for Housing Units with a Mortgage. (Census 2000 Summary File for Tracts: 61, 62, and 63). Retrieved from American Fact Finder. November 2016.
U.S. Census Bureau. (2000). ACS 2000/Comprehensive Report. (Census Tracts 61, 62, and 63). Prepared by Social Explorer. November 2016.
U.S. Census Bureau. (2010). ACS 2010/Comprehensive Report. (Census Tracts 61, 62, and 63). Prepared by Social Explorer. November 2016.
U.S. Census Bureau. (1950). Census 1950/Comprehensive Report. (Census Tracts 61, 62, and 63). Prepared by Social Explorer. November 2016.
U.S. Census Bureau. (2000). Census 2000/Comprehensive Report. (Census Tracts 61, 62, and 63). Prepared by Social Explorer. November 2016.
U.S. Census Bureau. (2010). Census 2010/Comprehensive Report. (Census Tracts 61, 62, and 63). Prepared by Social Explorer. November 2016.
U.S. Department of Commerce. (1950). 1950 United States Census of Housing. (Vol V, Part 91. Census Tracts: 61, 62, 63). Kansas City, MO Block Statistics. November 2016.