Continue reading Census Data for 8th-11th St on Prospect Ave
Prospect Corridor Amie-Lexington
My assigned area is between Lexington Avenue and Amie street, in the Historic Northeast neighborhood Pendleton Heights. I have rented in this neighborhood for 10 + years, it was interesting to dig into some demographics.
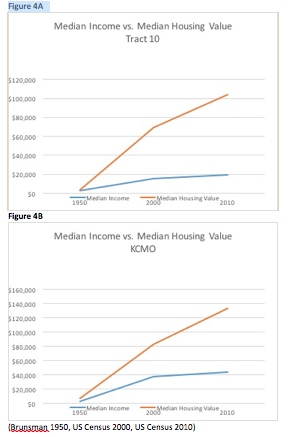
Something I have suspected recent years is the reality that I will soon be priced out of the neighborhood. This year an $85,000 house that my boyfriend and I were interested in sold for CASH the day it hit the market. My census studies confirmed this for me. The rise in home value has nearly doubled from 2000-2010, while the median income has remained stagnant. This trend is not reflected in the KCMO area as a whole.
Prospect Corridor Analysis: Linwood to 30th Street
A major transformation along my assigned blocks is the density. While conducting my census comparison analysis I noticed that listed in the 1950’s census was a significant amount of population density. Also, the median housing value was much lower. I would think that the housing prices did have some influence on the density I mentioned earlier. Also there were twice the number of residential units in this area in the 1950’s than in more recent years.
Census Analysis E 26th to E 28th in 1950-2000-2010
In summary, I am surprised how much of the population has decreased in the area. In the 1950’s the total population was recorded at 18,521; and has decreased to 5,617 in the year 2000, and decreased a bit more to 4,957 in 2010. House abandonment and new development have played a huge role as I have noted from the Sandborn map analysis. Education after high school has increased from the 1950’s but there seems to be very small decline in the span of 10 years from 2000 to 2010. Race in general has also not stayed the same, as there was a decrease in white population over time, with 54.4% being African American/Black and 45.4% White in 1950. The 2000 census data showed a huge decrease in white population in the area in 50 years, with only 1.7% of white occupants in the area, and 94.7% of the population being African American. Though white population in this area has begun to increase over the recent years, as have minority races, that aren’t African American/Black.
Census Data
When looking at the all the census tracts I found a lot about the area and how it changed over time. In the 1950 census tract there were 14,954 residences that lived in the area by 2010 there are only 7,115. The area has changed demographically too, it was a majority white neighborhood then by 2000 in was a African American community. There was also a housing crisis. In 1950 there were 4,828 housing units and by 2010 there were only 3,192. After reviewing the data is kind of overwhelming to see a area that was thriving disappear.
Census Tract Analysis along Prospect between 52nd and 54th
I was able to look at census tracts for Prospect between E 52nd Street and E 54th Street in 1950, 2000 and 2010. The Census Tract for the west side of Prospect on these blocks is 0.49 square miles and the east side of Prospect on these blocks is 0.64 square miles. Factors such as race and ethnicity, educational attainment and population density changed much through these decades.
There is a constant data difference for the west side and the east side of Prospect for these blocks. For the most part, the west side has a higher percentage in population. In 1950, on the west side there were 4,459 people. On the east side, the population was 2,815. The population density for the west was 9,009.12 per square mile and for the east 4,374.2. The west side almost doubles the east side population. However, by 2000, the population is not as contrasted in the west and east. The west side greatly decreased to 2,980 while the west side decreased to 2,096. By 2010, the population continued to decrease on both sides of Prospect, the west side had 2,631 and the east side had 1,403. Even though the population decreases from 2000 to 2010, the population decrease from 1950 to 2000 was greater.
Census Tract Data Analysis: Independence to E 8th St along Prospect Ave
For my analysis, my block was within two census tracts that go north-south from Independence to E 12th st, and east-west from Cleveland Ave to Woodland Ave. What mostly got my attention is that population drastically decreased from 1950 to 2010 and esp. around the area of 2000. In my own opinion, I think not only in this area I believe in America in general during that period of time (1950-2000) population decreased because of the two wars that happen in America, the Korean war and the Vietnam war, which caused a lot of battle deaths that lead to a decrease in the population. However, this is not the only reason there are other factors of course.
On the other hand, the increase in education was pleasing to find. Education is power basically and we can see this in our time today. The rates of graduates have increased from 1950 to 2010 in a delightful way, which was not even at a bad low rate in the 1950s. Yet I would love to show some of the charts and data that I have collected, but sadly I forgot my flash drive in studio so you’re just gonna have to believe me because I said so. haha
Prospect Avenue between 40th and 42nd street
Much like other areas within the eastern portion of Kansas City, Missouri, the 40th through 42nd blocks along Prospect Avenue have undergone major demographic transitions over the past 66 years. Between 1950 and 2000, the racial makeup of the area underwent a 180-degree shift from nearly all white to almost entirely black. Housing values and population density also significantly decreased as large populations relocated and investment was redirected toward the suburban fringes.
The most significant change from 2000 to 2010 was the increase in vacant properties. This area was hit hard by the economic recession of 2008, and the number of vacancies and dilapidated properties supports this. Median rent increased as well, indicating a stronger competition for housing among those who no longer owned a home. Proximity to the city center also contributed to this increase as interest in a more urban lifestyle continued to rise.
Census information for 21st to 24th on Prospect Ave
![]()
![]()
![]()
![]()
When looking at the census’ data for 1950, the first thing I noticed was that there are four tracts that make up my blocks; tract 32, 33, 39, and 37. In two of the four tracts there are a very small number of white populations as compared to black on the tracts west of prospect. Redlining was starting to happen more often in this area, as noted in my first paper. “In the late 1940s home owners associations were trying to keep “blacks” out of “whites” neighborhoods. One of the ways that this was accomplished was by the association raising money to buy houses that used to be owned by blacks or who will rent to blacks.
The census data for 2000 shows a huge loss in population when compared to fifty years previous. White flight appears to be an issue when you look at the drastic change of the number of white population in all four tracts
Looking at the 2010 MSA for Kansas City shows that there is a large population in this area, almost 2 million people. The population of whites is more than six times that of the black population is Kansas City.
2010 shows a slight increase in three of the four census tracts, the fourth tract 32 which became tract 166 has a sizeable population increase. Tract 32 had a small increase in white population while the other three saw large numbers return. However, the white population is nowhere near where it was in the 1950s in tract 33 and 37.
E 54th Street and E 56th Street
I was assigned E54th St and E 56th St east and west of Prospect Ave. The Census data I collected from Social Explorer for my section indicated that during the 1950s there were a lot more people living in each tract than in 2010. Again another huge indication was that most of the residents in these tracts were primarily white. In the 1950s’ there were a total of 100% in tract 76, 86.2% in tract 77, 100% in tract 79, and another 100% in tract 80. The total white population was 97.6% with only a total of black population of 2.4% (all selected Census tracts). The 2.4% consisted of 388 black residents in tract 77, 1 in tract 79, and 1 in tract 80. The total population for black residents was shocking, because in the 2010 census data I collected does not compare with the 1950s data. For 2010, my Census data indicates that the total of white residents is 4.2% and a total of 91.4% of black residents (all selected Census tracts).
Meyer Blvd to 68th
In the 1950’s this area was a primarily (99%) white neighborhood. The median house value was high. No rental information was available because it didn’t apply, and Prospect was zoned and utilized as a vibrant commercial street. In the following decades the population of black individuals rose steadily, ultimately making the area a primarily black and minority population. Shortly after this population shift, the implementation of 71 highway devastated the east side of Prospect. Homes were demolished in large numbers and the remaining homes lost their property value. Low property value encourages people to use once owner occupied homes as rental properties or to simply vacate. Information from 2010 explains that this area is currently in a state of disinvestment. A higher percentage of rental properties exist; yet, the median rent is $200 under the metropolitan area median. The census tracts associated with these blocks also have a higher vacancy percentage that the KC Metro area.
Census Report at Brush Creek and Prospect
Census Report / UPD 260
Abigail Newsham
*Please excuse the poor graphics… WordPress is not playing nice.
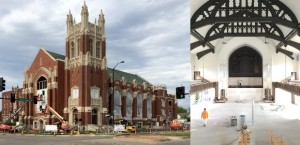
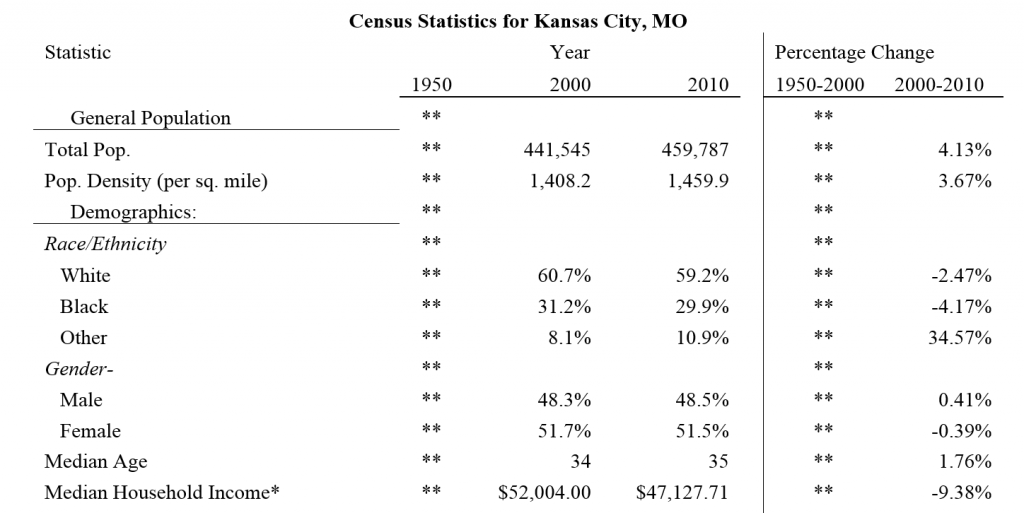
Kansas City’s Prospect corridor has had significant changes in demographics since the 1950s. Since the 1950s, the United States has undergone a series of housing policies and initiatives, aiding in the displacement of city residents (primarily lower-class and minorities), increased incentives for sprawled development, and the changing make-up of residents in the inner-city neighborhoods. This report will cover population, gender, race, age, income, and housing data changes for the years 1950, 2000, and 2010 for census tracts 61, 62, and 63. These tracts are located along Prospect Avenue between 46th Street and Swope Parkway. It is important to note that census tract 62 does not apply to the years 2000 and 2010, as census boundaries have changes since 1950. Tract 62 is, however, included in the report for 1950 data. To analyze the data concisely, totals have been provided for all years.
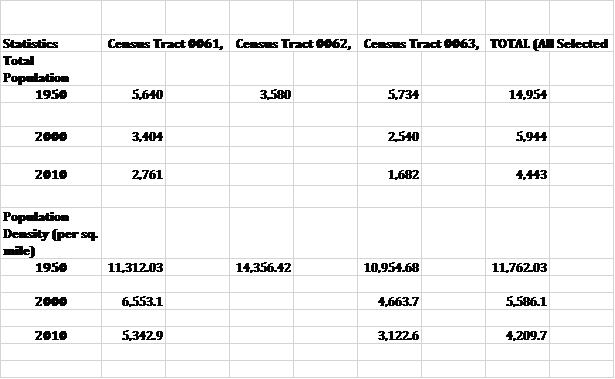
Table 1. Population Data over Time
Unsurprisingly, population counts and densities for the areas along Prospect between 46th Street and Swope Parkway was highest in 1950. In 2000, 50 years later, total population counts dropped by more than sixty percent. Population densities have also dropped significantly since the 1950s. These changes may be partially attributed to post-1950s FHA-backed mortgages which aided in new, sprawling housing development in the United States. From 2000 to 2010, population counts and densities appear to be continuously decreasing in this area.
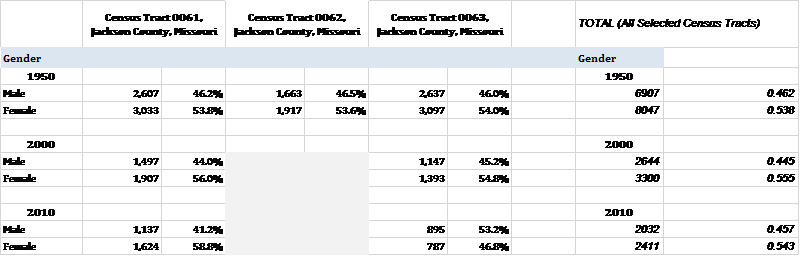
Table 2. Gender changes over time
The composition of male and female residents has remained somewhat steady since the 1950s, with historically higher proportion of females. The proportion of females has risen slightly since the 1950s.
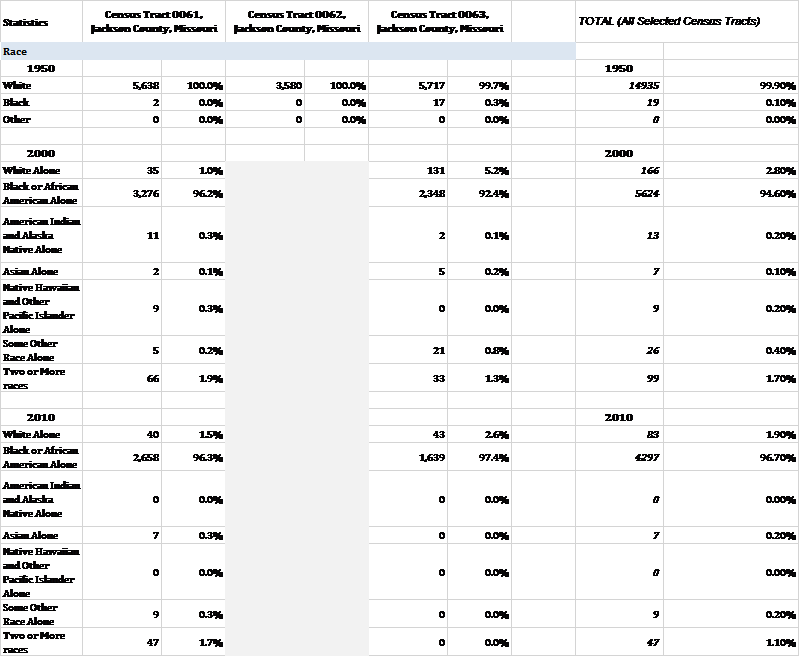
Table 3. Race/Ethnicity changes over time
The data showing changes in ethnic populations is not as transparent. Practices for collecting racial data for residents has changed since the 1950s, as the 1950s census only collected data for populations identified as “Black”, “White”, and “other”, whereas “other” can be American Indian, Asian, Hispanic, etc. Despite these incongruences, there are not very high proportions of populations identified as any other race but White and Black for the years 2000 and 2010. In the 1950s, this area was almost one-hundred percent white. By the year 2000, less than three percent of the population in this area was White, and almost ninety-five percent was Black. In 2000, there was almost two percent of the population identified as “more than one race”. Census tract 63 has a pattern of being more diverse than the other tracts (“diverse”, being used as loosely as possible), as it held the highest proportion of Black residents in the 1950s, and the highest proportion of White residents in 2000 and 2010. By 2010, the residents in these census tracts are almost completely Black, and there are low proportions of those identifying as two-or-more-races, White, Asian, or “some other race alone”.
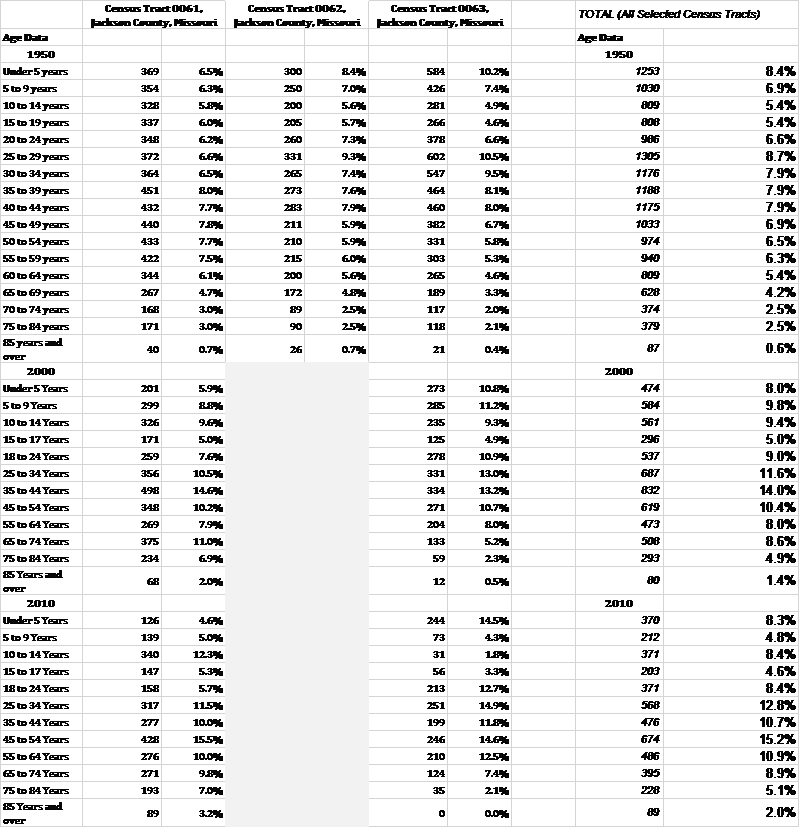
Table 4. Age Proportions
In the 1950s, the proportion of age cohorts were relatively higher for people under 64 years of age. The proportions are relatively stable, ranging from around five to eight percent. No cohorts make up more than nine percent of the population. In 2000, there is a shift in age proportionality. There is a lower proportion of populations over 55 years of age, and populations 25-55 years of age make up more than thirty percent of the population. Since the 1950s, population ages tend to be concentrated within cohorts between 18 to 55 years.

Table 5. Income over time
The dollar amounts for income data has been adjusted to the 2010 value. When adjusted to inflation, the data shows that median household income has decreased in the study area since 1950. Census tract 61 has contained historically higher median household incomes since the 1950s. The most significant change in income is shown in tract 63 between the 1950s and 2000s. This dramatic change may be caused by the changing geographic boundaries for which census data is collected. Tract 62 had very low relative incomes in the 1950s, and the change in census boundaries may have lowered the median income values for the year 2000 and 2010.
In 1950, it was less common for the residents in the study area to have educational attainment greater than high school. Most people had “at least some high school”, according to the census data. Only six percent of the population had 4 years of college.
In 2000, less than thirty percent had an educational attainment that did not include the completion of high school. While the proportion of (assumed) high school graduates remains consistently in the mid-thirty percentile, the proportions of residents having at least some college has risen by five percent.
Educational attainment data has not changed much since the 1950s. In 2010, the percentage of high school graduates (only) were in the high thirties, while proportions for people having completed some college remain mostly consistent.
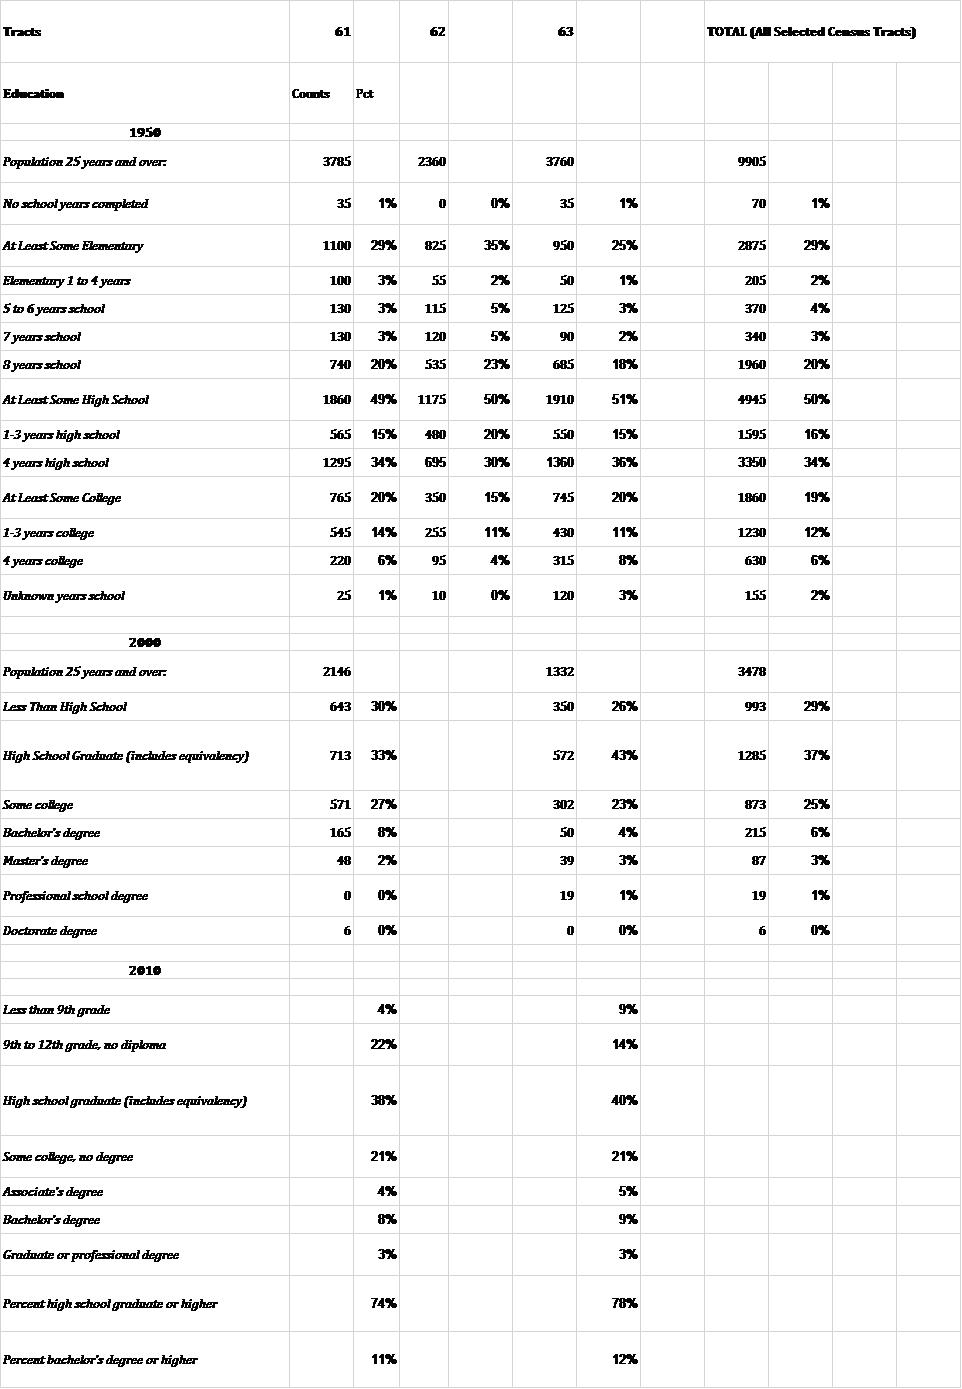
Table 6. Educational Attainment

Table 7. Housing Data
There was almost no housing vacancy in the study area in 1950. Tract 61 had the highest rate of owner-occupied housing units, at seventy-two percent. Tract 63 showed an almost equal proportion of renter versus owner occupation, and tract 62 was only thirty-percent owner-occupied. Overall, there was a range of housing needs met in this area, possibly reflecting residents’ differing ability and interest in owning a home. This neighborhood catered to both needs. Additionally, vacancy was at its lowest.
By the year 2000, tract 61’s owner-occupancy did not change significantly. Tract 63 does have a significant drop in owner-occupation, containing data which was formally in tract 62, possibly lowering the average value. The proportions of owner versus renter occupancy for the area as a whole, in 2000 and 2010, are about 50/50. However, in 2000, vacancy in this area increased to about twelve-percent since 1950. By 2010, vacancy overall is almost thirty-percent.
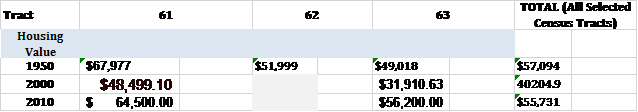
Table 8. Housing Value
In the 1950s, tract 61 had the highest housing value. However, when values are adjusted to inflation, there is not a significant decrease in housing value shown in the data. The year 2000 appears to be a low-point for housing prices.
Citations
United States Census Bureau. (2000). MEDIAN VALUE (DOLLARS) FOR SPECIFIED OWNER-OCCUPIED HOUSING UNITS. (Census 2000 Summary File for Tracts: 61, 62, and 63). Retrieved from American Fact Finder. November 2016.
United States Census Bureau. (2010). 2005-2009 American Community Survey 5-Year Estimates: Financial Characteristics for Housing Units with a Mortgage. (Census 2000 Summary File for Tracts: 61, 62, and 63). Retrieved from American Fact Finder. November 2016.
U.S. Census Bureau. (2000). ACS 2000/Comprehensive Report. (Census Tracts 61, 62, and 63). Prepared by Social Explorer. November 2016.
U.S. Census Bureau. (2010). ACS 2010/Comprehensive Report. (Census Tracts 61, 62, and 63). Prepared by Social Explorer. November 2016.
U.S. Census Bureau. (1950). Census 1950/Comprehensive Report. (Census Tracts 61, 62, and 63). Prepared by Social Explorer. November 2016.
U.S. Census Bureau. (2000). Census 2000/Comprehensive Report. (Census Tracts 61, 62, and 63). Prepared by Social Explorer. November 2016.
U.S. Census Bureau. (2010). Census 2010/Comprehensive Report. (Census Tracts 61, 62, and 63). Prepared by Social Explorer. November 2016.
U.S. Department of Commerce. (1950). 1950 United States Census of Housing. (Vol V, Part 91. Census Tracts: 61, 62, 63). Kansas City, MO Block Statistics. November 2016.
Prospect Avenue From Linwood Boulevard to E 34th Street Census
My blocks extend from Linwood Boulevard to E 34th Street on Prospect Avenue. These blocks lie within the bounds of census tracts 54 and 56.01 (56 in 1950). These demographics of these census tracts have changed drastically over time. In 1950, the ethnicity of 99.5% of the residents was white, but by 2000 over 90% of the population was characterized as African American, and by 2010 around 90% of the population was characterized as African American. At the same time, the median income adjusted for inflation increased for the census tract 54 but decreased in census tract 56 or 56.01. The bounds of census tract 56 changed from 1950 to 2000, being cut approximately in half. This may have skewed the data for quantitative data such as the number of dwellings.
Census Data: Prospect Ave. Blocks from E. 28th St – E. 30th St.
I was assigned the blocks from E. 28th St. to E. 30th St and Prospect Ave. The census data that I obtained from Social Explorer coincided with my findings from our last assignment creating the figure ground maps. My section seemed to be thriving as much as it had ever been in 1950 as evidence by a large total population and an average medium income for that time. By 2000 the area had taken a big hit, the population decreased by more than half and continued to decrease in 2010. The median income is at poverty level. When investigating the cause for the decline I found a multitude of factors including crime and lack of resources. The tipping point seemed to be integration and the race riots in 1968 where a large 3 block area of Prospect Ave. was burnt down and white owned businesses had been targeted. Hopefully, in the near future more attention will be given to the area and restore community.
Prospect Ave E.44th St to E 46th St 1950 Census
I notice in my 1950 U.S. Census that the population of my two census track were a total of 11,374. The population of the 2010 U.S. Census for my two tracks were 4,443. There has been a big change in population in my area over the last 60 years. U.S. 71 Highway split right down the middle of one of my census track destroying a lot of houses.
30th street to Linwood Ave
In the past there has been significant amount structural density on these blocks. This is especially true in the 25 years from 1925 to 1950. There was obviously an economic decline throughout this area. That decline did not have a significant effect on the structural density of the area. What did happen was a rise in the number of vacancies and neglect of properties. Buildings do exist which could be rehabbed and repurposed or , I believe, should be demolished.
Analysis of Prospect Avenue: E 28th St. to E 30th St.


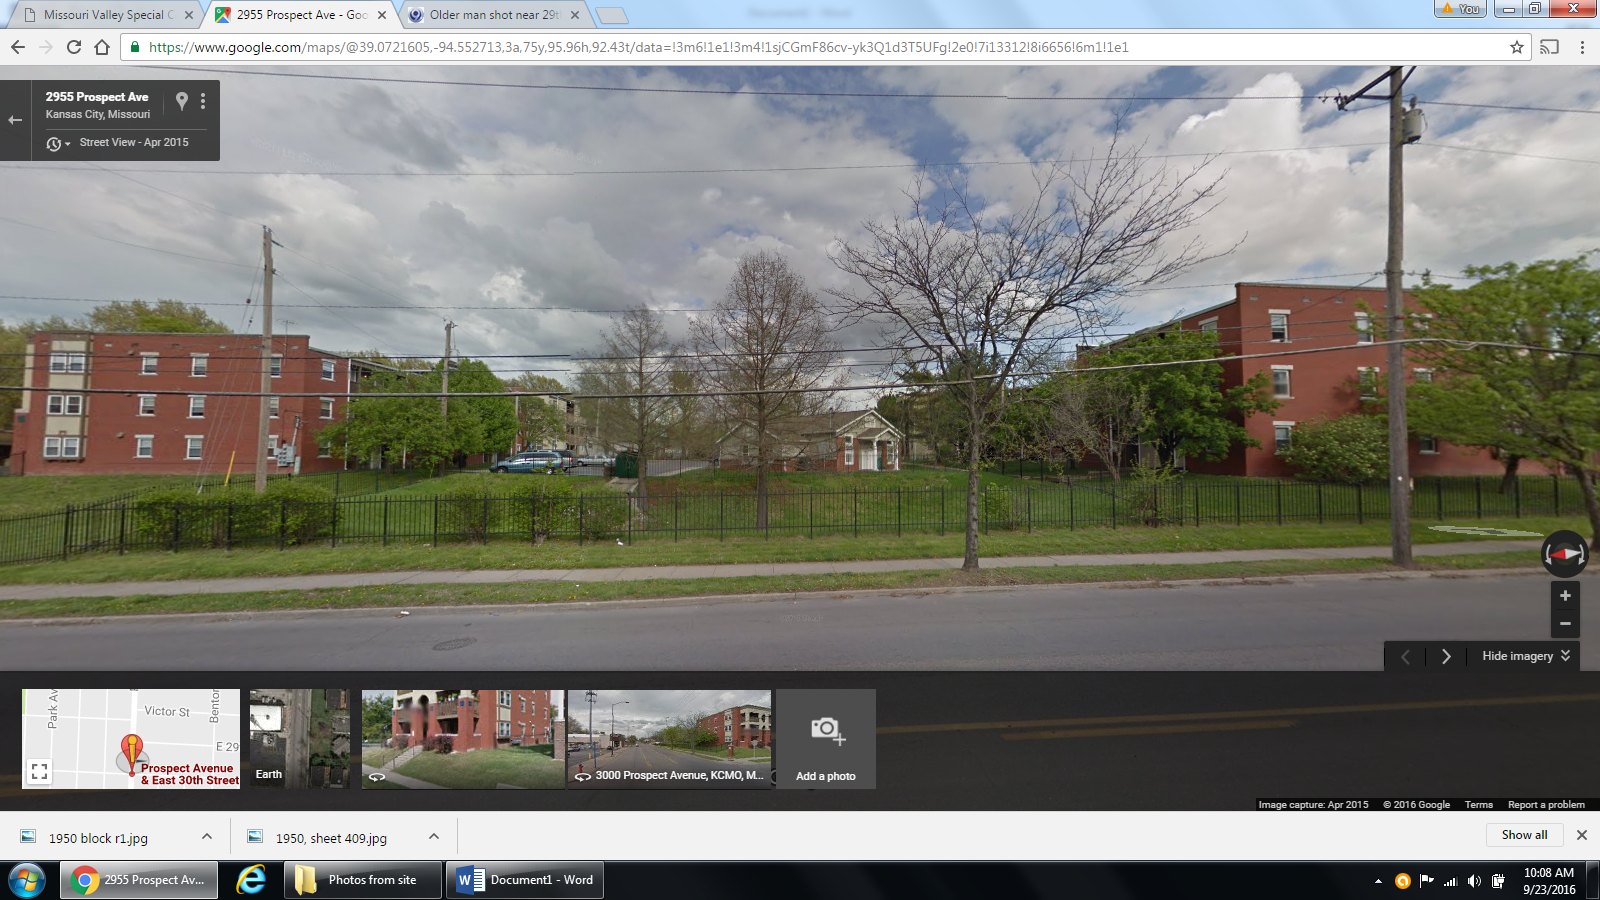

Blocks E. 28th St. – E. 30th St. and Prospect Ave. have undergone a period with a clear trend of growth up until the 1950’s, as indicated by the increase in number of structures and the density of the buildings in the Sanborn Maps and KC Atlas. I had trouble locating the 1895-1896 maps but in the 1907 Sanborn maps a lot of building were already in place. In contrast when looking at 2016, very little of the original structures remain and a decline in the number of structures and density had occurred. Researching articles for the history of the area suggest that crime could be a cause for the decline. In 1968 Kansas City was the center for a riot. I located historical newspaper articles describing shootings that took place, men that were killed and buildings that were burn down in my blocks. Since then it appears that the area has never recovered as evidence by the series of maps. More recently, a man by the name of Jimmy Townsend was shot at his home located at 2900 block of Prospect Ave. Townsend operated Jimmy’s and Dee’s Steakhouse that used to be located at E. 29th Street and Prospect Avenue. It was part of cluster of businesses along Prospect Ave. that included the Byron Hotel that was located on the east side of Prospect Ave. between E. 29th St and E. 30th St. At Byron Hotel four men were killed in the riots that followed the April 1968 assassination of Martin Luther King Jr. Jimmy Townsend was a figure in this area and his shooting shows that unfortunately this area remains an area of crime today which may be a large account for the decline.
62nd and Brooklyn Ave.
I examined 62nd and Brooklyn Ave to the West of Prospect and also a little of North up until 59th Street as well. I had difficulties allocating maps for my area due to its lack of development up until 1925 (Atlas.) This was the first indication of structures in that area, but it was still documented in an Atlas and not a Sanborn Map. the area was primarily residential with single-family dwellings from what I could tell f rom the lot sizes and structures.
As the neighborhood progressed there were several new residential homes added up until 1939, and then the timeline gets a little hazy. From 1939, the last documented Sanborn map shows a decline in development and actually a staggering amount of demolition to the block on 62nd.
Though it wasn’t noted in my paper due to lack of evidence to support it, I’m going to mention it hear as a controversial factor to 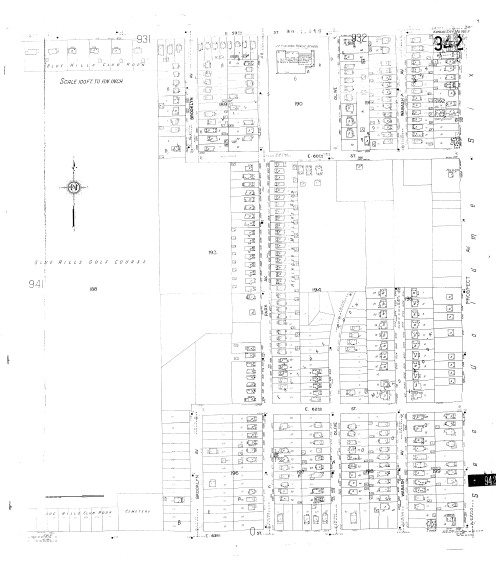 this deconstruction of the neighborhood along Prospect Ave. There is a pretty concise grid network through Kansas City and the construction of US 71 (Bruce R. Watkins Expressway), which extends North to South, cuts through this grid. In my opinion, my block suffered from this segregation and physical barrier, relocating many residents in the area.
Synopsis of Analysis for Prospect Avenue from 52nd Street to 54th Street
Walking through Prospect Avenue from 52nd Street to 54th Street today we find a mix of residencies and businesses sporadically located. The residencies have little space between them and are similar in size. However, some of the businesses have large properties or are by a vacant property. There is an auto shop, a dental clinic, a discount merchandise store, a party shop, a motel, a restaurant and a laundromat.
On the West side of Prospect for these blocks, the 1925 Atlas and Sanborn maps c.1950 volume 9 and volume 6, show that landlords of certain sections on these blocks, divided the area into grid-like compartments and placed buildings in the compartments. These compartmentalized sections, shared the land on the block with a landlord, Mary S Smeltzer who kept her section unbuilt and undivided. The East side of Prospect for these blocks show a similar division of land use. However, the 1925 Atlast shoes an interesting set of buildings were located Prospect and 54th Street — Wheatley School. The school was name after Phillis Wheatley and was for African Americans. The c1950 Sanborn maps show that the school moved two blocks East and in parenthesis classifies it as “colored”. It also showed that the buildings for Wheatley School by prospect were not there anymore by then.
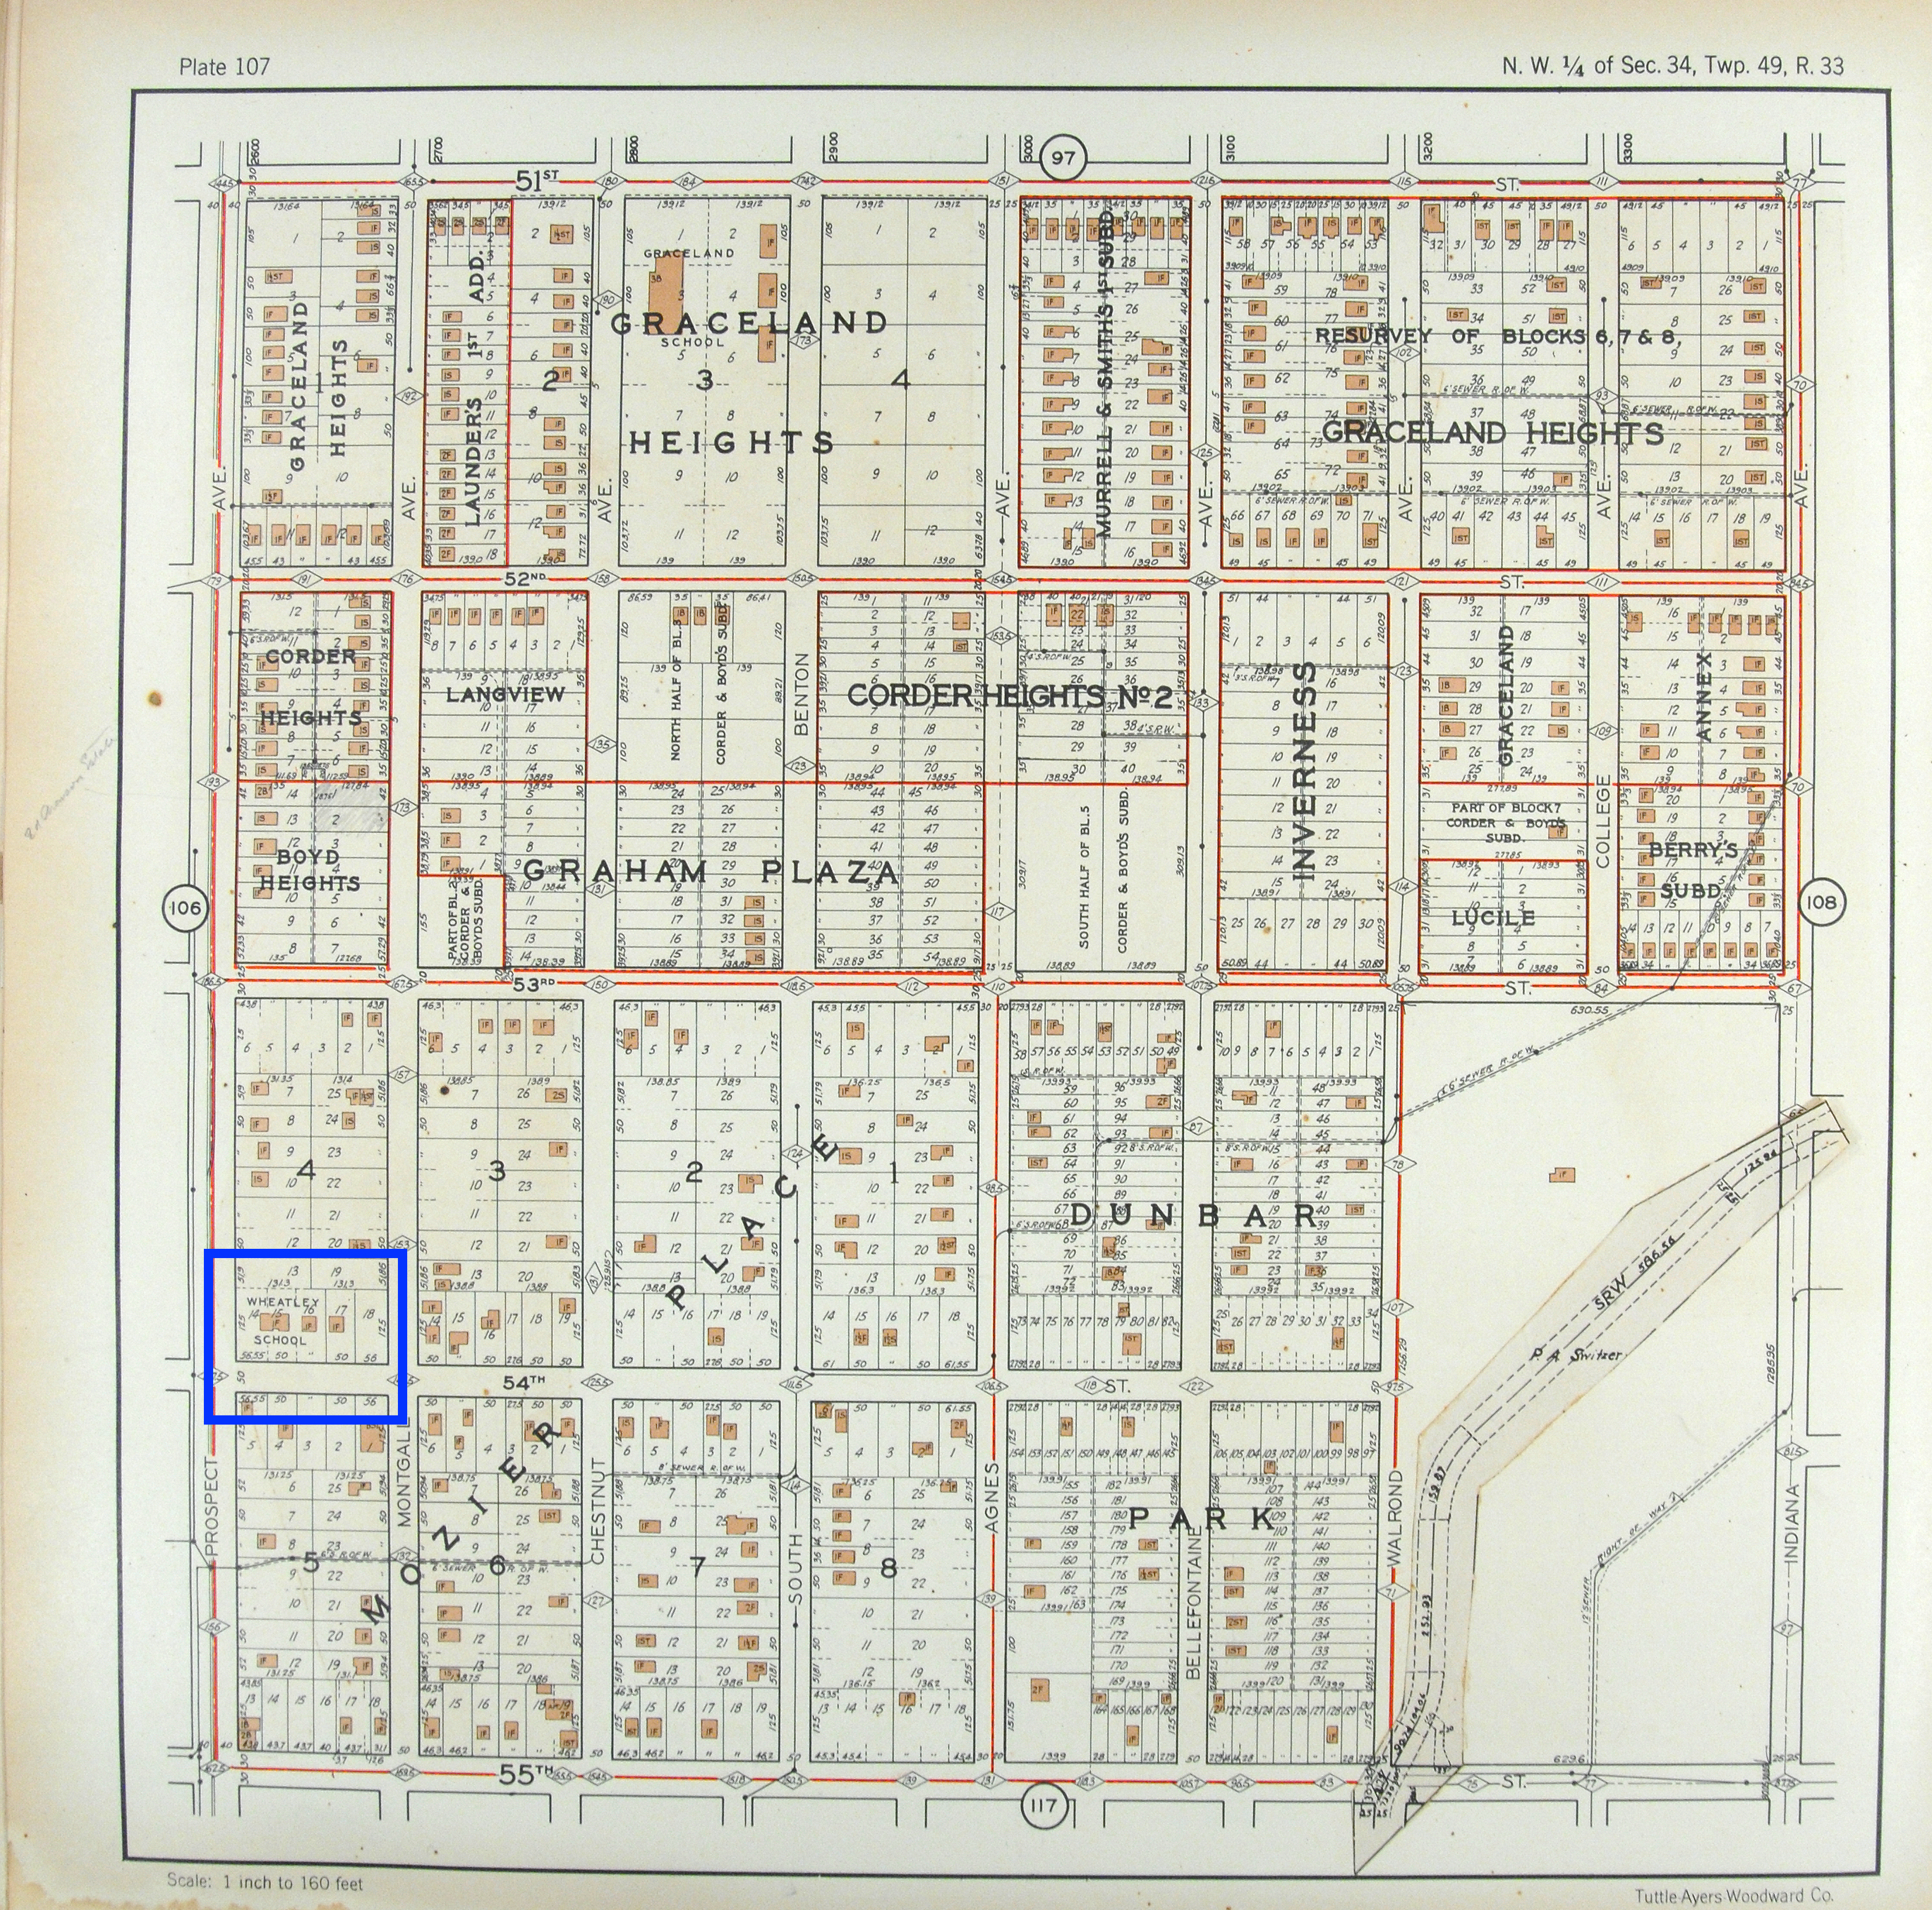
Today, there still is a mix of compartmentalized residency buildings and unkept, empty sections of land on these blocks.
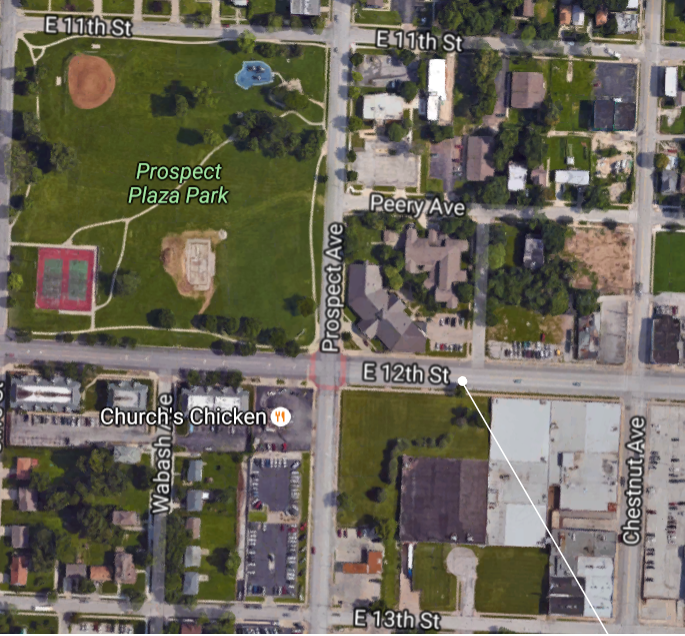
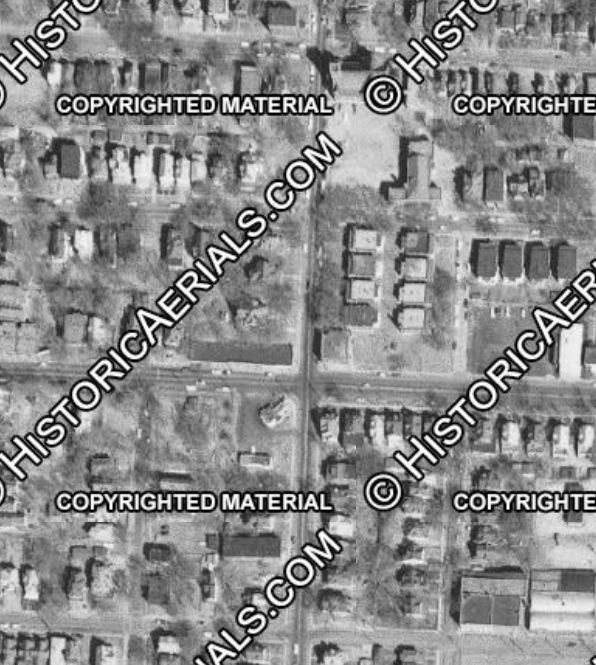
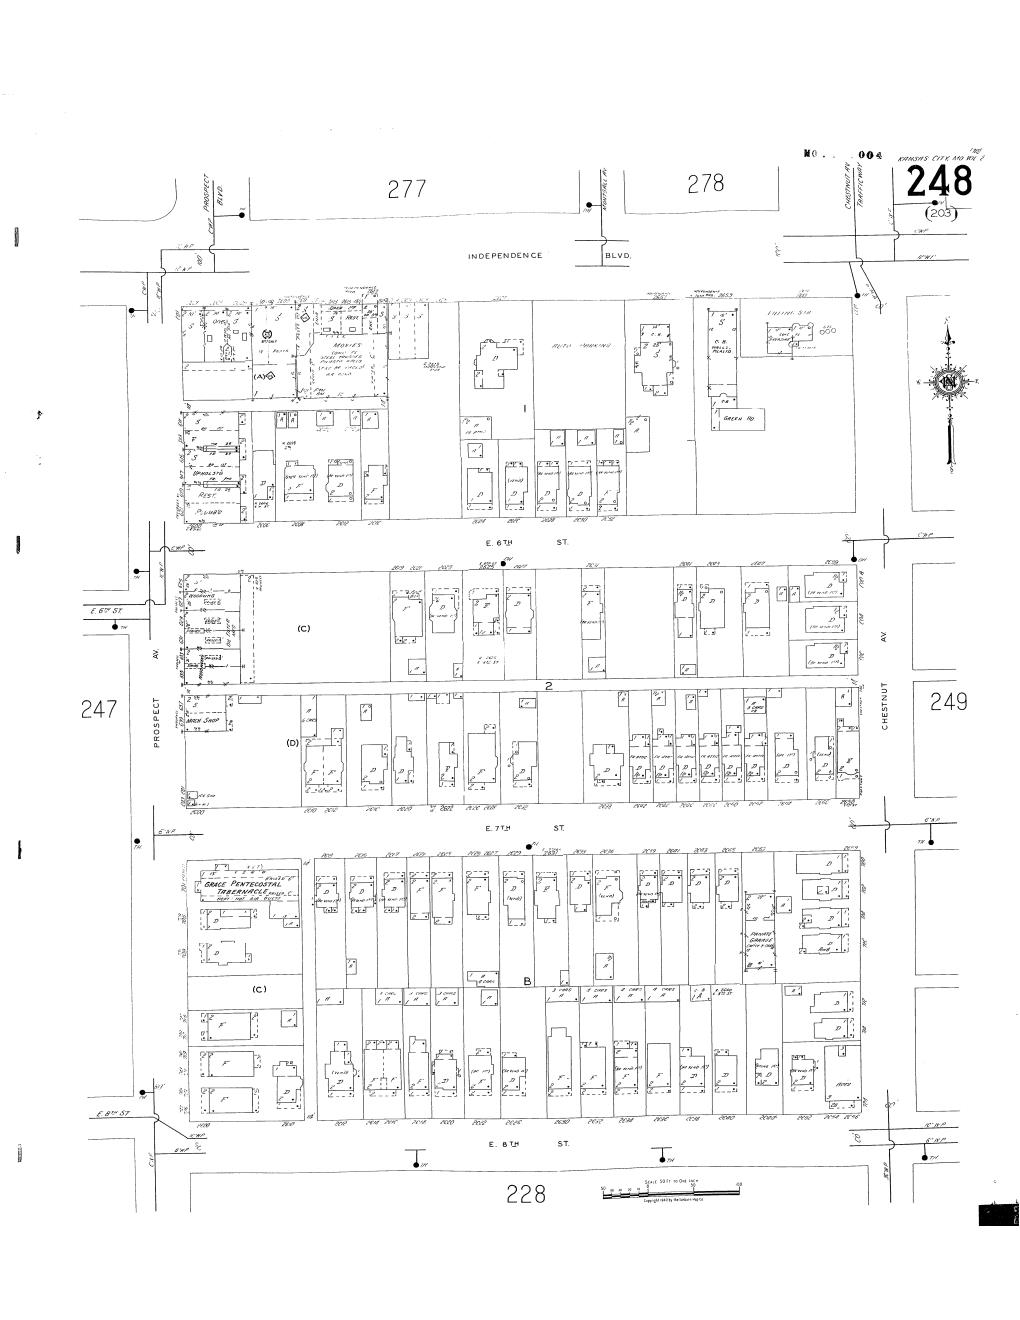
Prospect and E 11th St through E 13th St
My blocks were primarily used for commercial purposes. I saw a BP gas station, a Church’s Chicken, a police gas station, a life insurance building, a car dealership, a women’s center, and Prospect Plaza Park. The area was pretty busy and the park was well-maintained. 12th St had the most traffic traveling east and west. When I did my figure-ground study, the area was not very dense, mainly because parking lots took up so much space instead of buildings.
When I looked back at the historical maps of the area, I was surprised to see it had mostly been residential single-family homes, a different apartment complex (now gone), and a large Catholic Church. I asked a friend about the church and he was surprised to hear it was gone. After doing some digging, the church closed down because it didn’t have a large enough following anymore. It appears people are moving away and businesses are moving in.
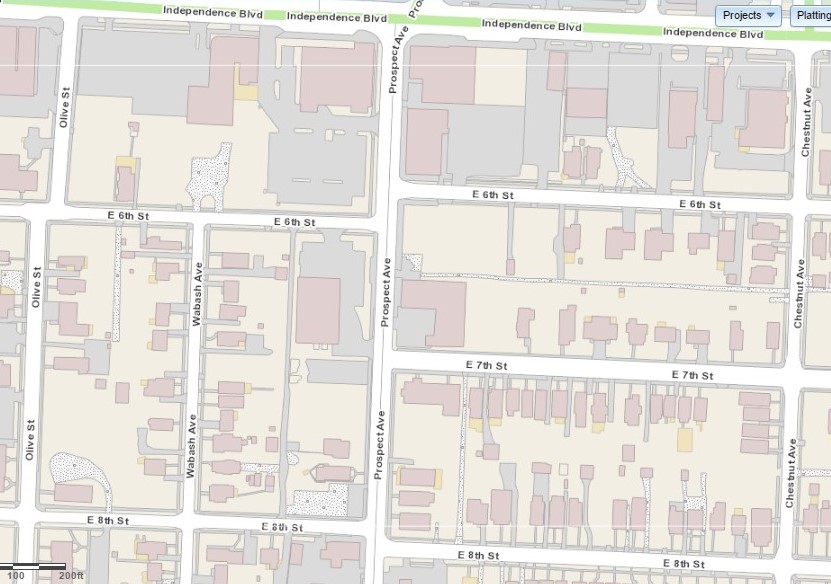
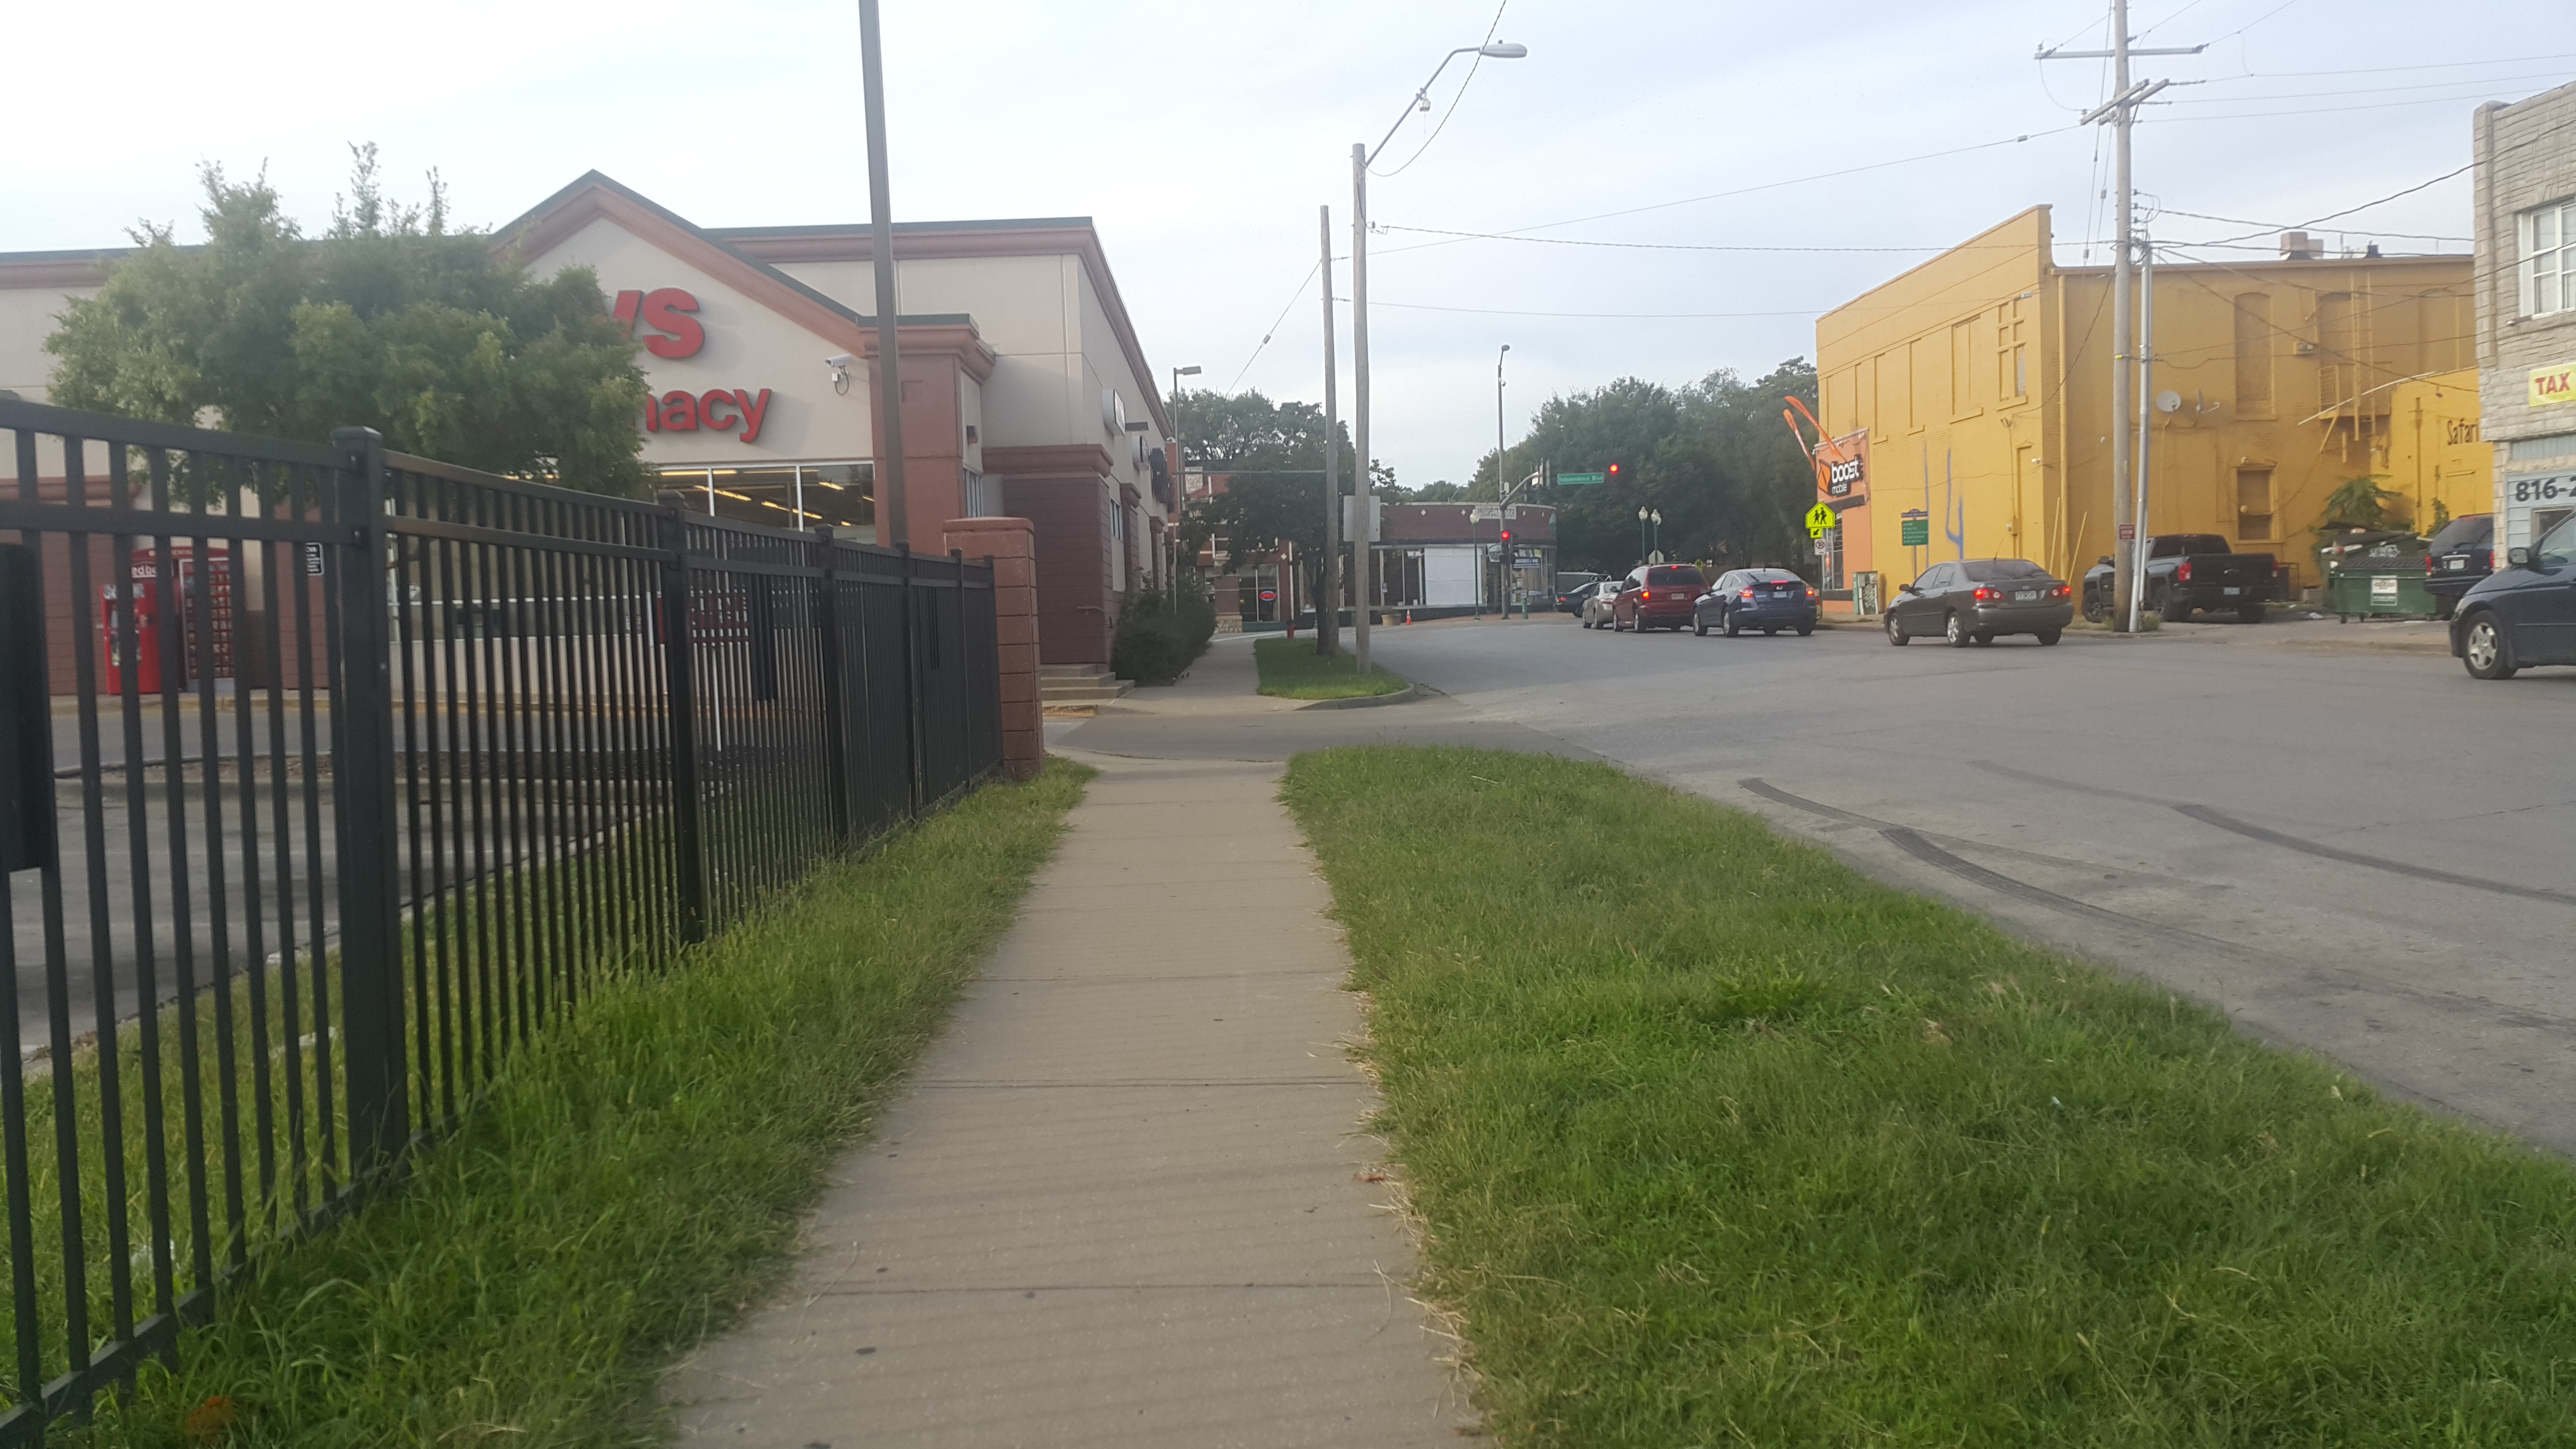
Independence Ave and E 8th St.
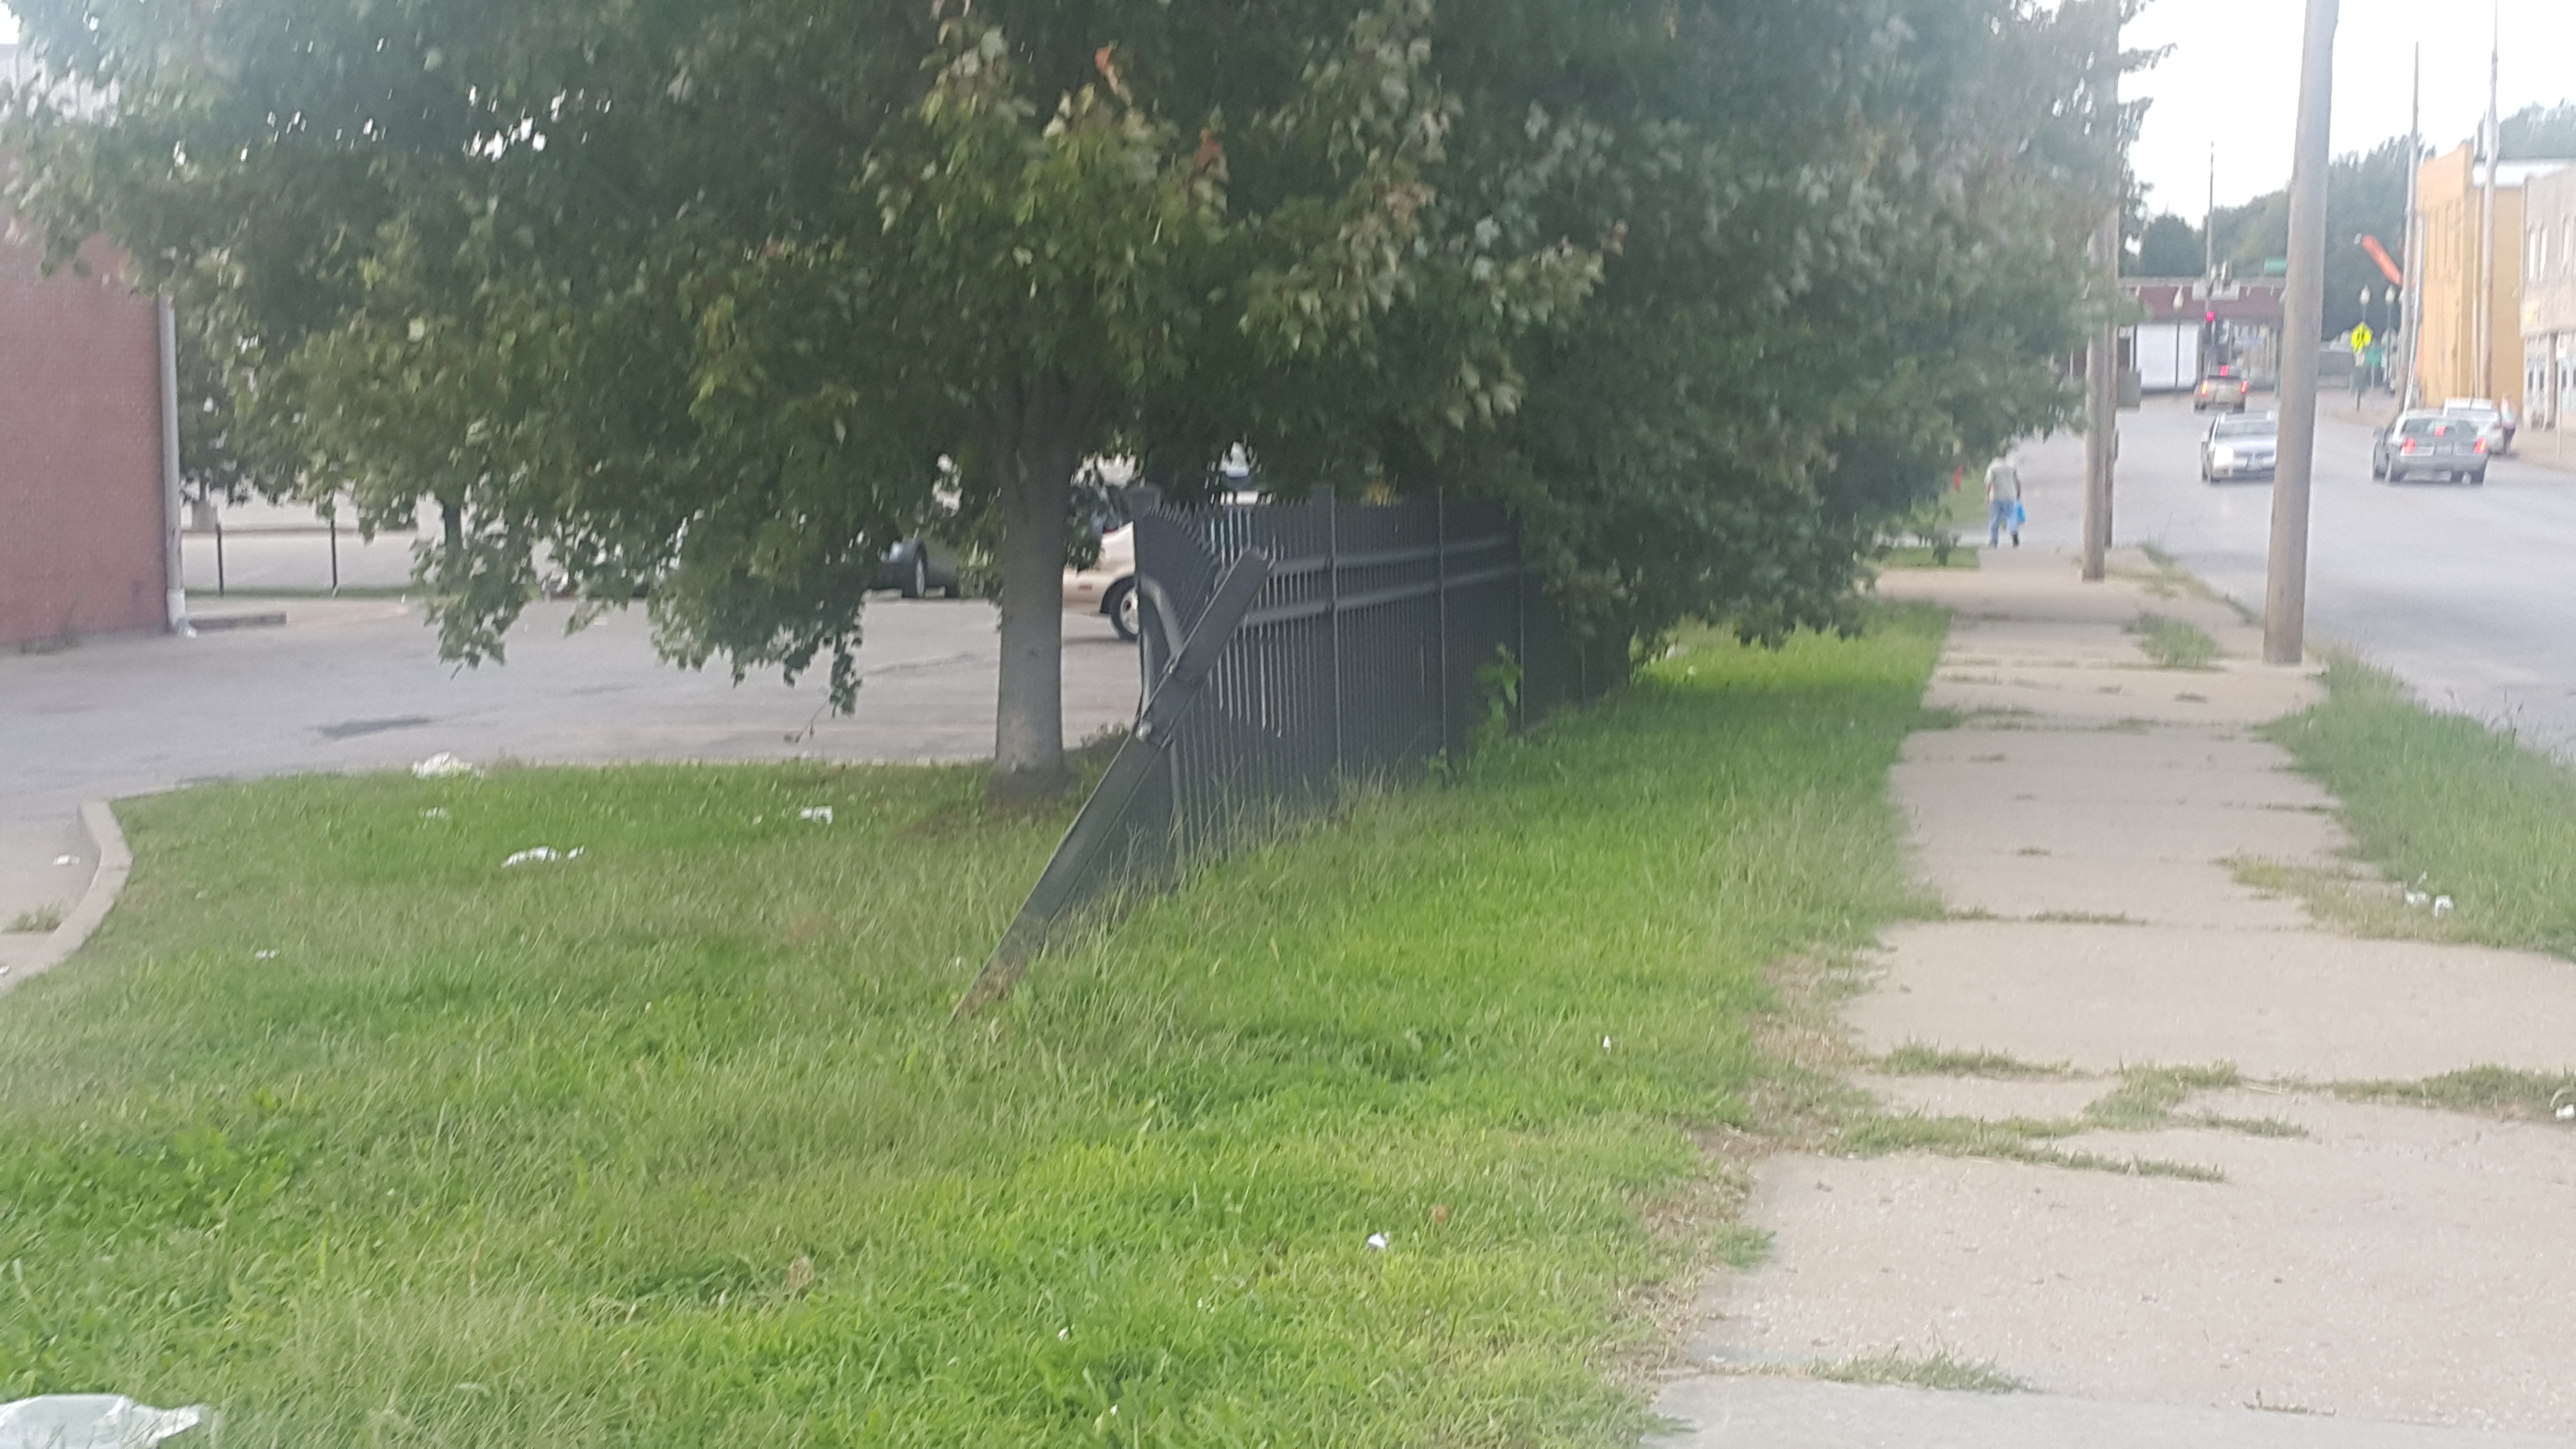
My assigned area at first glance looked old and not taken care of, backing up what I’m saying it turns out to be this block and blocks adjacent to it go back to the 1800’s when they were first built. Down below some pictures I’ve taken that show the conditions of the neighborhood where you could clearly see between E 6th and 7th St the tall grass, trash, bended fences, however, it would look better near Independence Ave where the CVS is which did not exist until 1999.
However, studying the sanborn maps showed quiet differences between 1909 and 2016 building footprints. Few houses were built, others were taken down and replaced with commercial buildings or parking spaces. Density decreased nowadays than what it used to be in 1925. I wished I had more time, and not so much work to do for studio 3rd year, to look deep into why exactly those changes occurred, but that’s as far as I went.


Either side of Prospect and between Independence and Amie/Elma streets
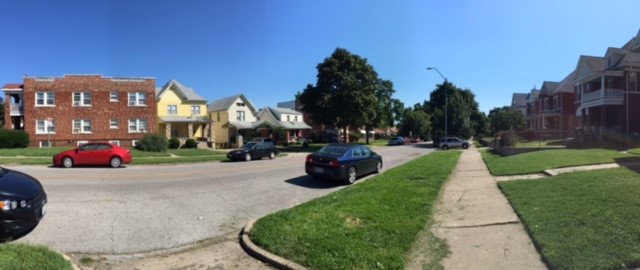
The two blocks between Independence Avenue and Amie Street/Elma Street, on either side of Prospect Avenue, are a primarily Suburban family area with almost 40% multi-unit homes. North from the blocks is Garfield elementary school, which is a rebuild of the original school established in the late 1800s.
A random sampling of 12 single-family houses within the two blocks puts the average cost of each one at about $86,000. Observing the neighborhoods, the cars are all used, there are a few houses that are condemned, and the majority of the parking is off-street. The lots are small. The neighborhood is close to Independence although it is in Kansas City. Bus 24 runs along Independence Avenue, making the neighborhood accessible to people without cars. Snyder’s grocery is on the southern portion of the block between Prospect and Montgall Ave. There are a few other businesses across the street, such as a Halal mart. The area has the necessities for a family to survive, but not thrive.
There are less buildings than there were in the 50s, in particular, some apartment buildings were repurposed such as in Amie Court, and others, such as at Stonewall Apartments, burned down in 2015. There are also less, but larger houses, and other structures on plots of land such as sheds and such have been taken down. However there are significantly more than there were around the turn of the century.
Prospect, 56th through 58th
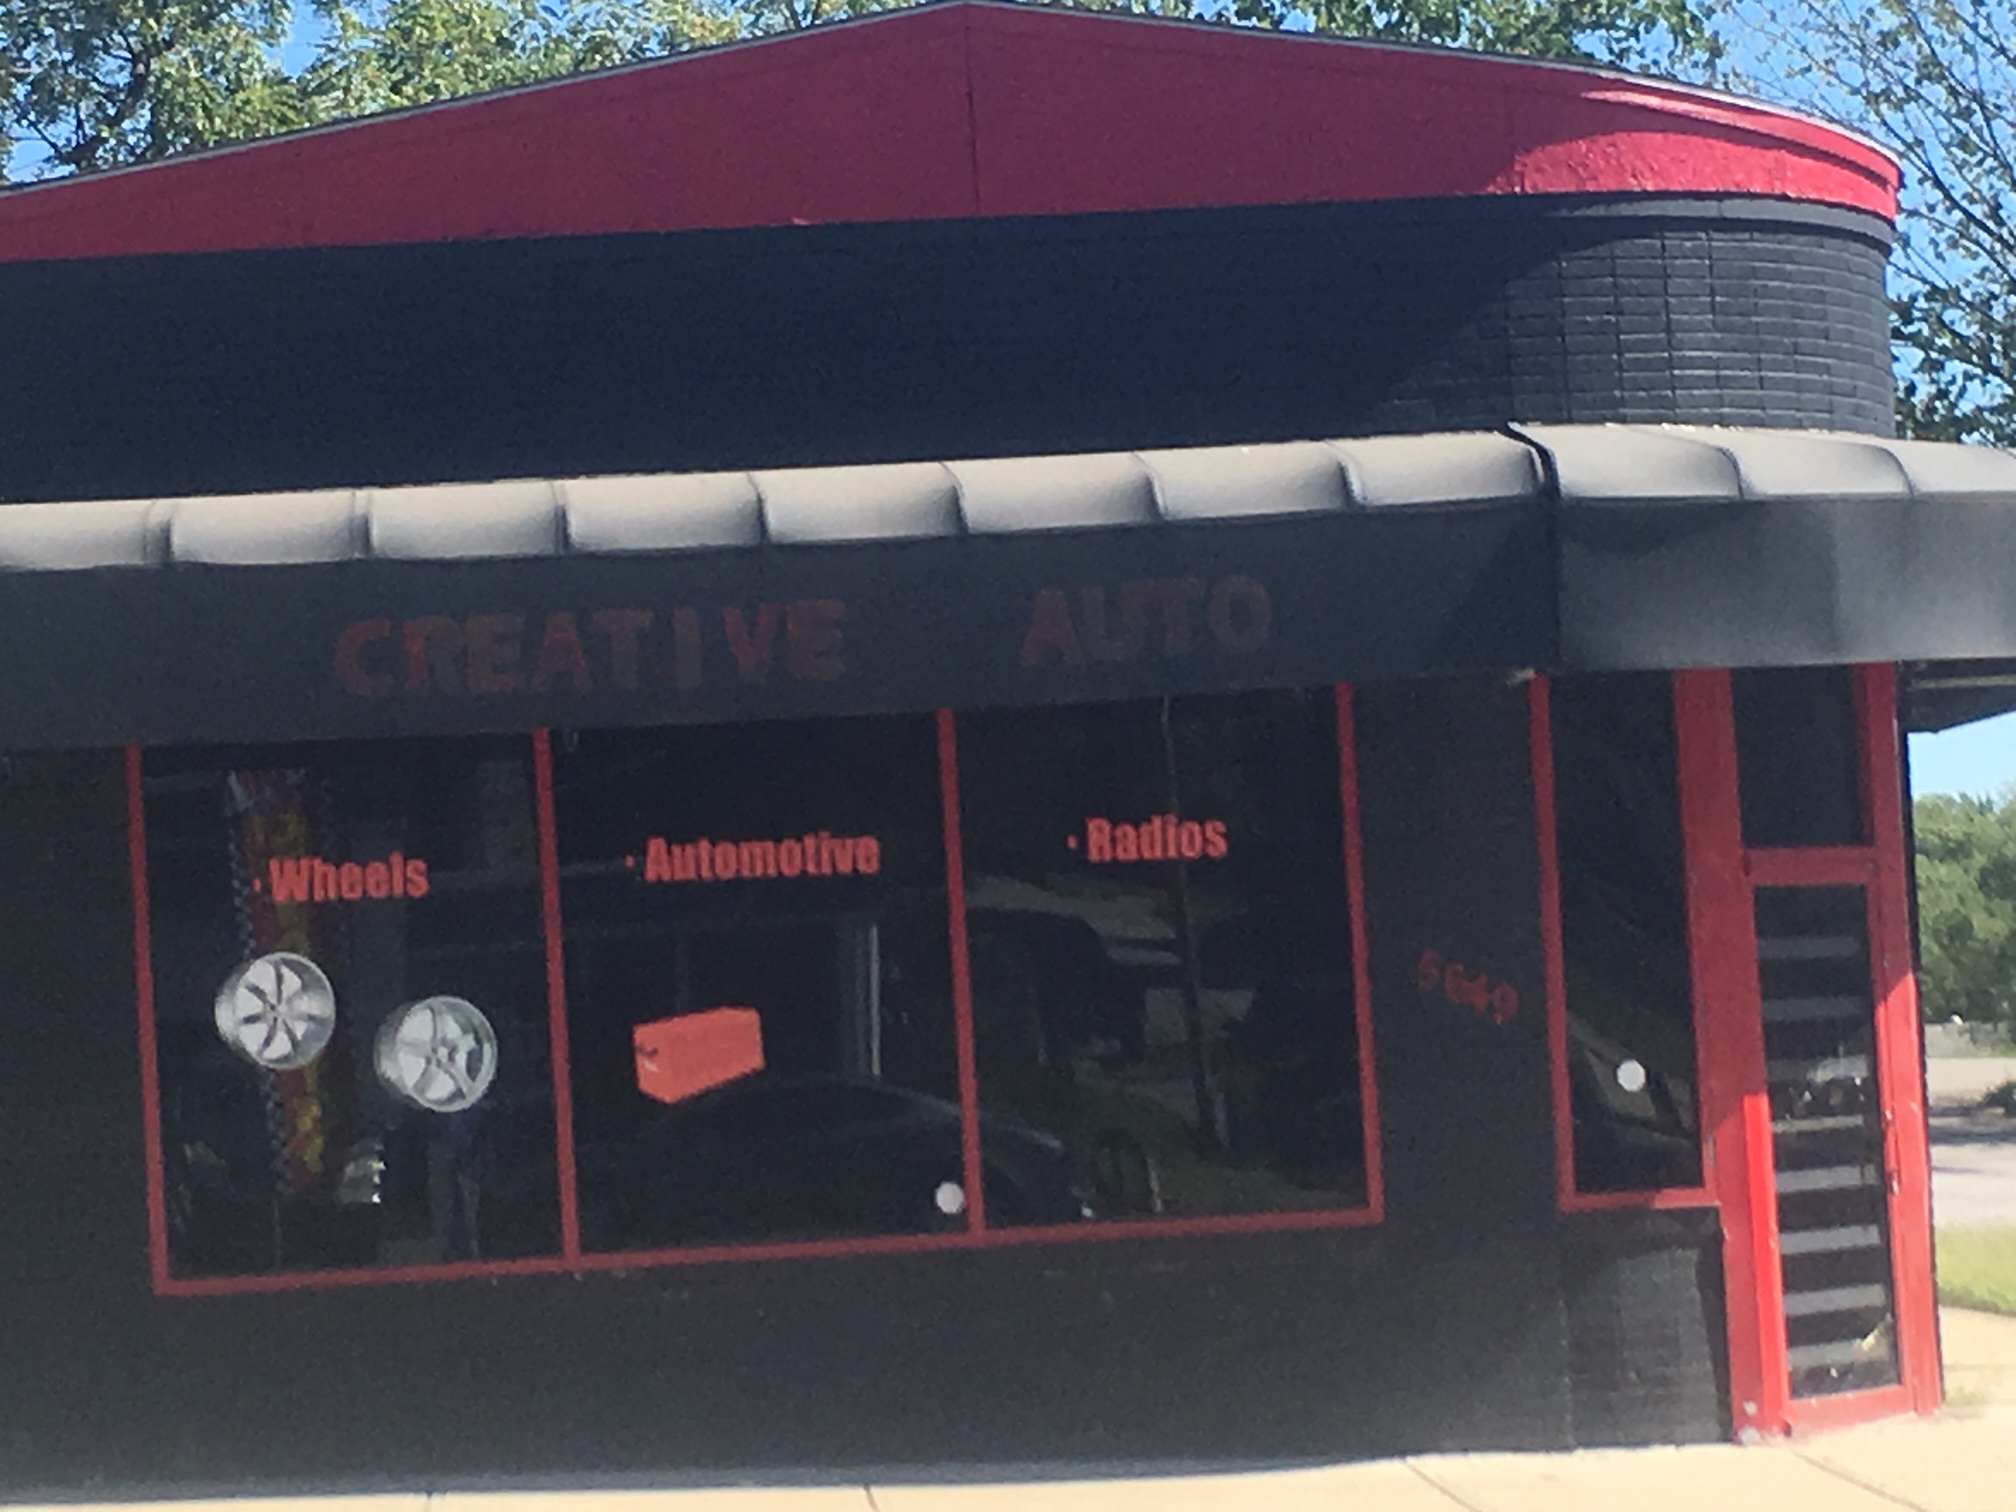
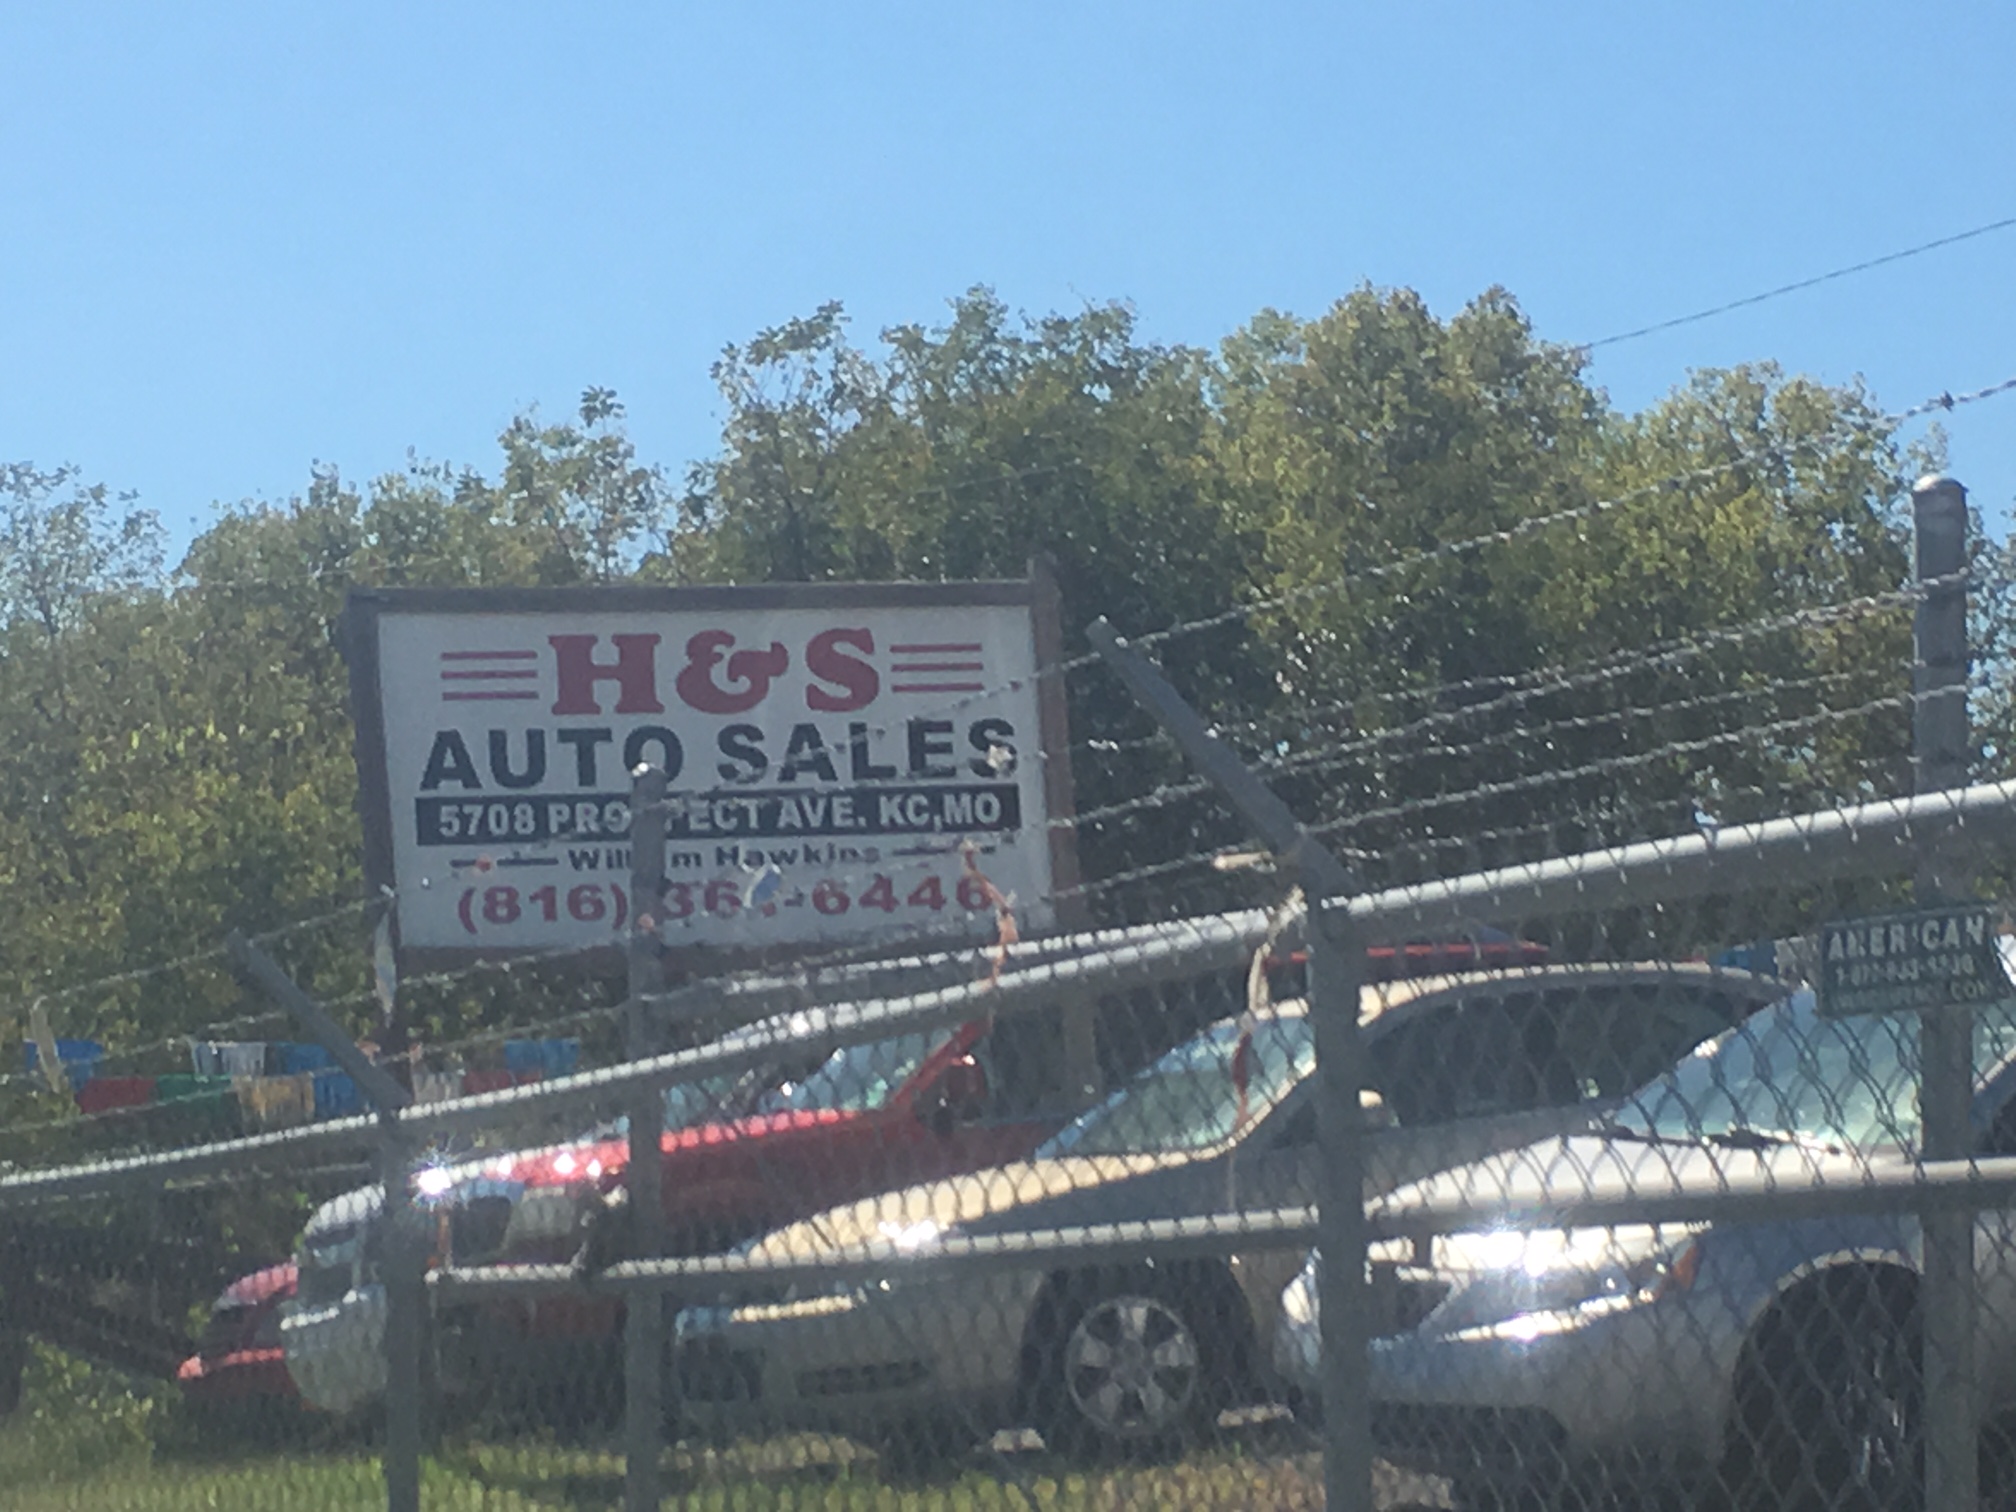
The area of prospect between 56th and 58th streets seems to have been heavily influenced by both the past commerce of the area, as well as the city’s development as a whole. In the 1937 Sandborn Map, one of the only businesses shown was a garage for vehicles. Now in the present day, almost the entirety of this stretch has been dedicated in some way to the automotive industry. The original garage is still standing, and many of the structures have been removed or replaced with either used car lots, repair shops, or some other automotive based company. Many of the residential areas are no longer being used, I believe that this is due to the removal of a portion of the once adjacent street, Montgall, in order for interstate 71 to be installed. This has led to this portion of Prospect Ave being less used for residential purposes and led way for more businesses to move in and take the space.
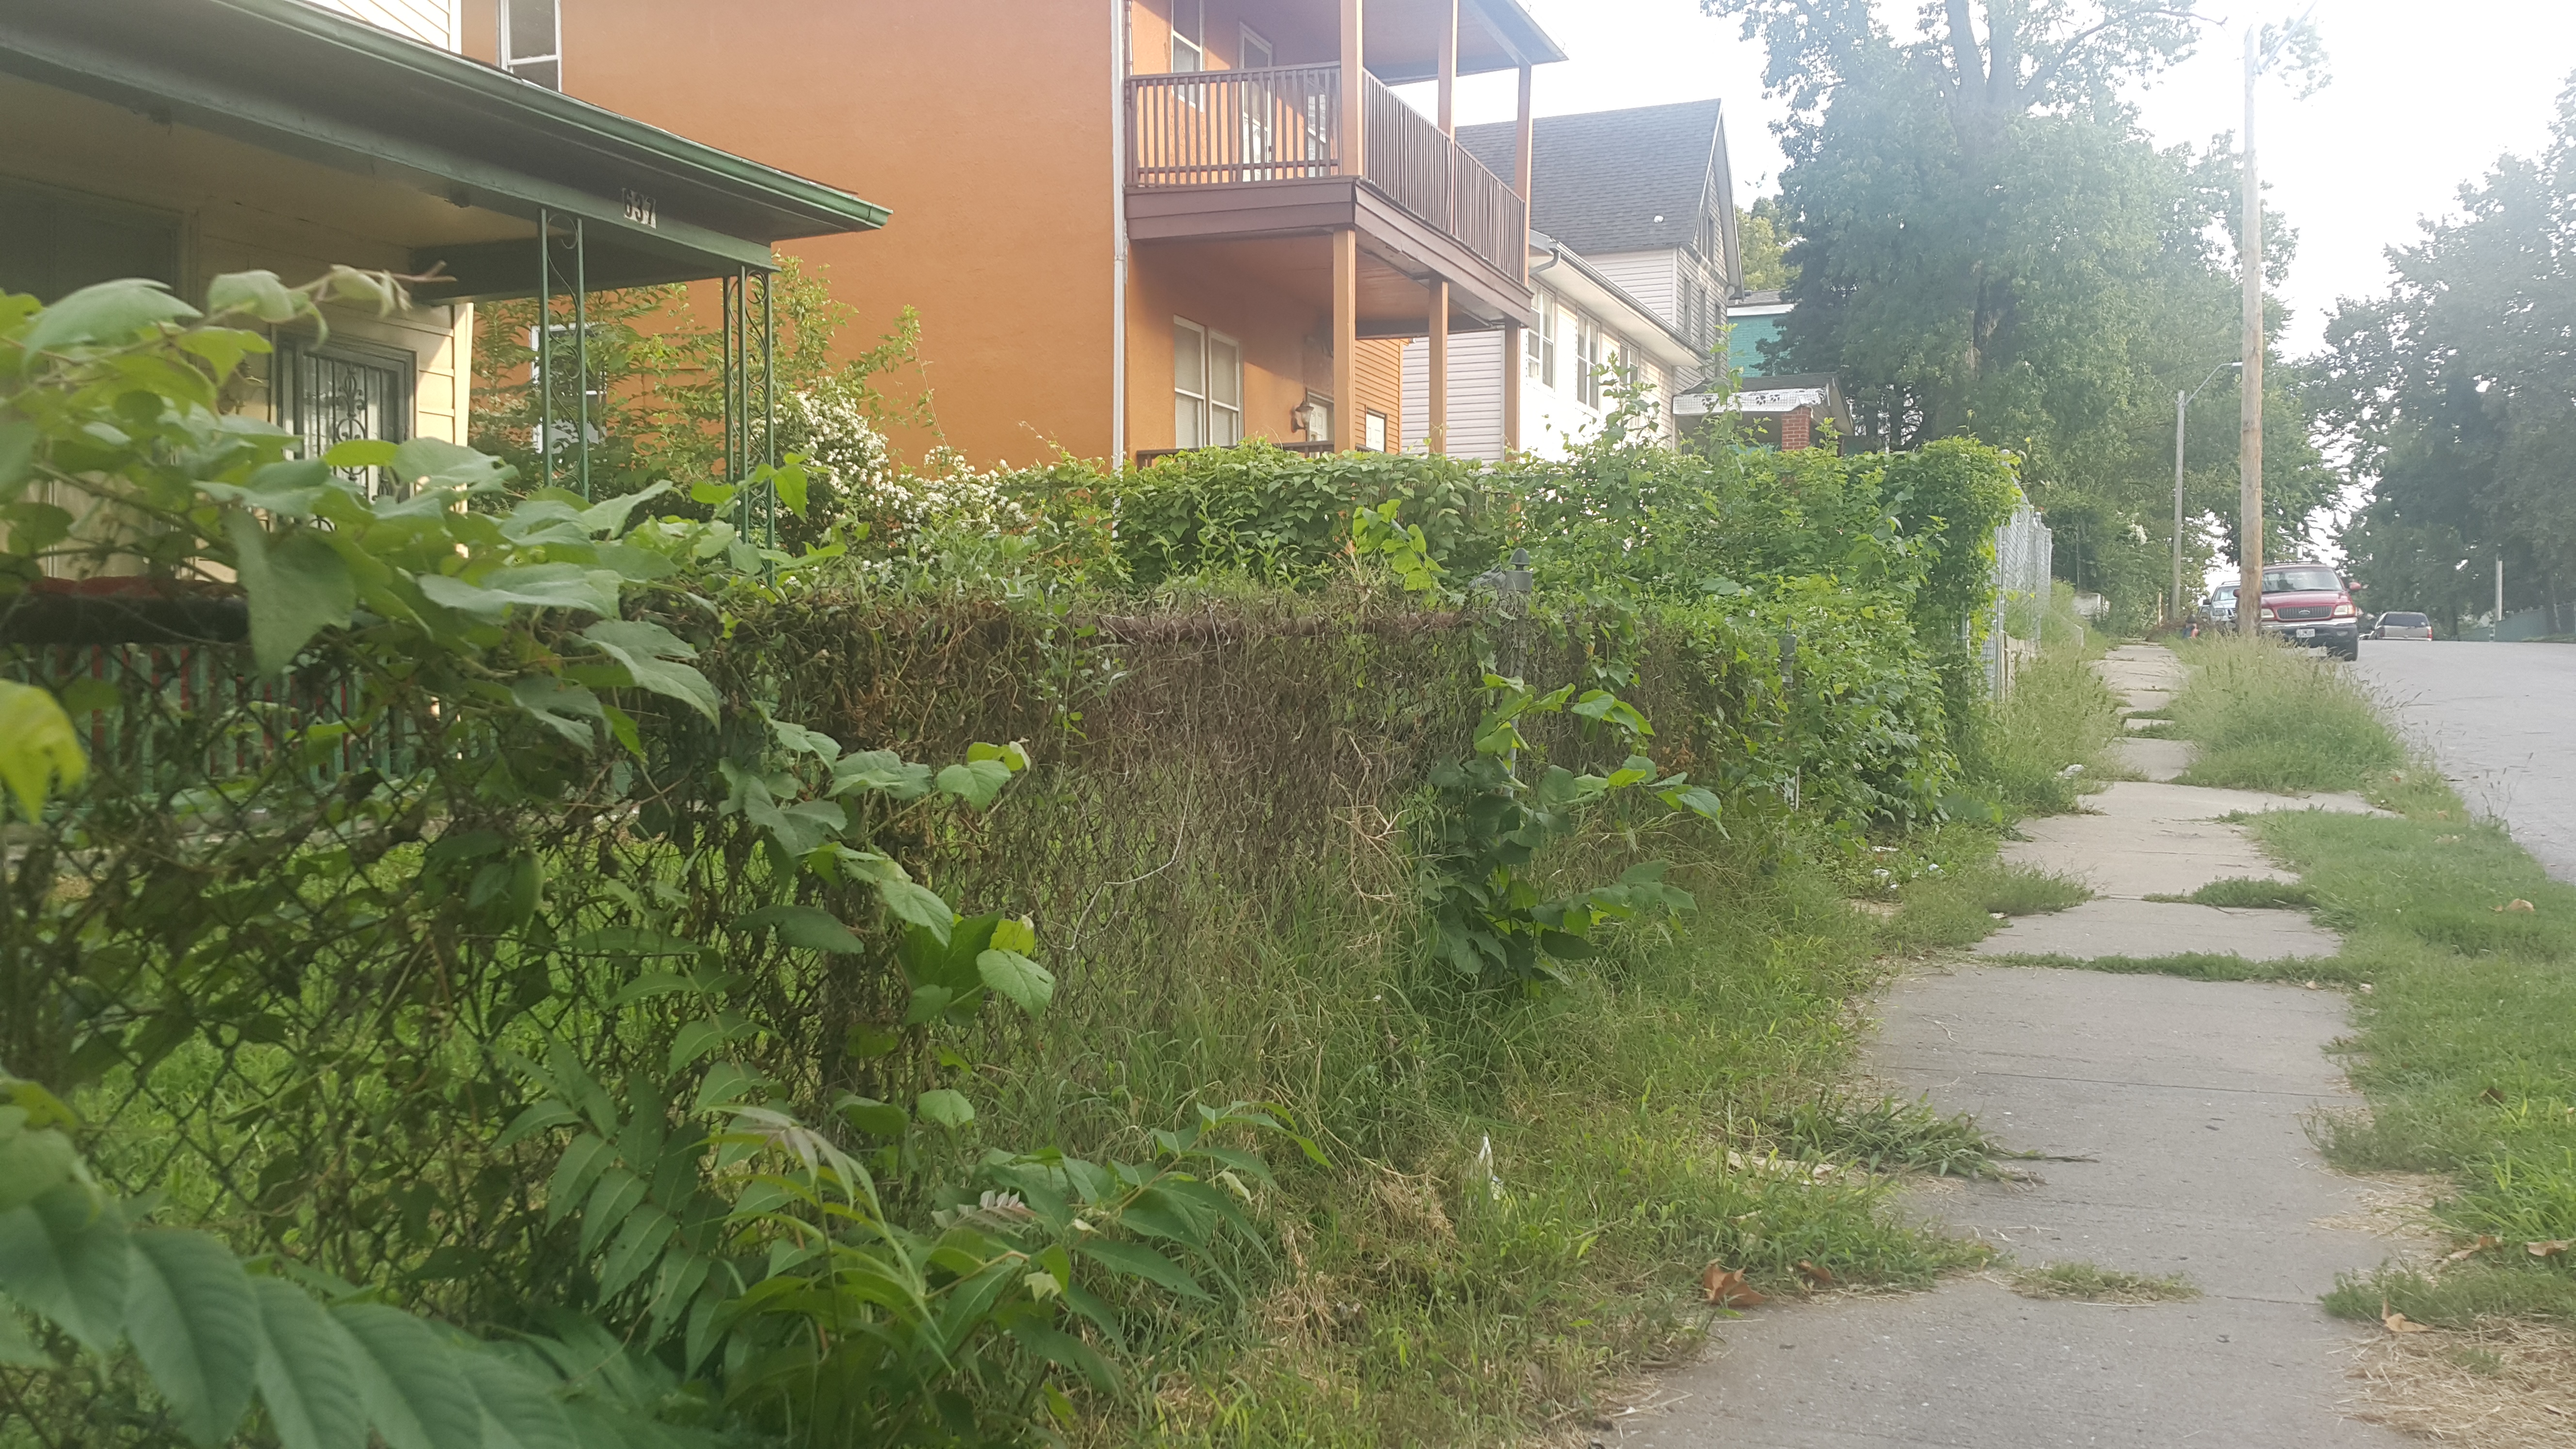
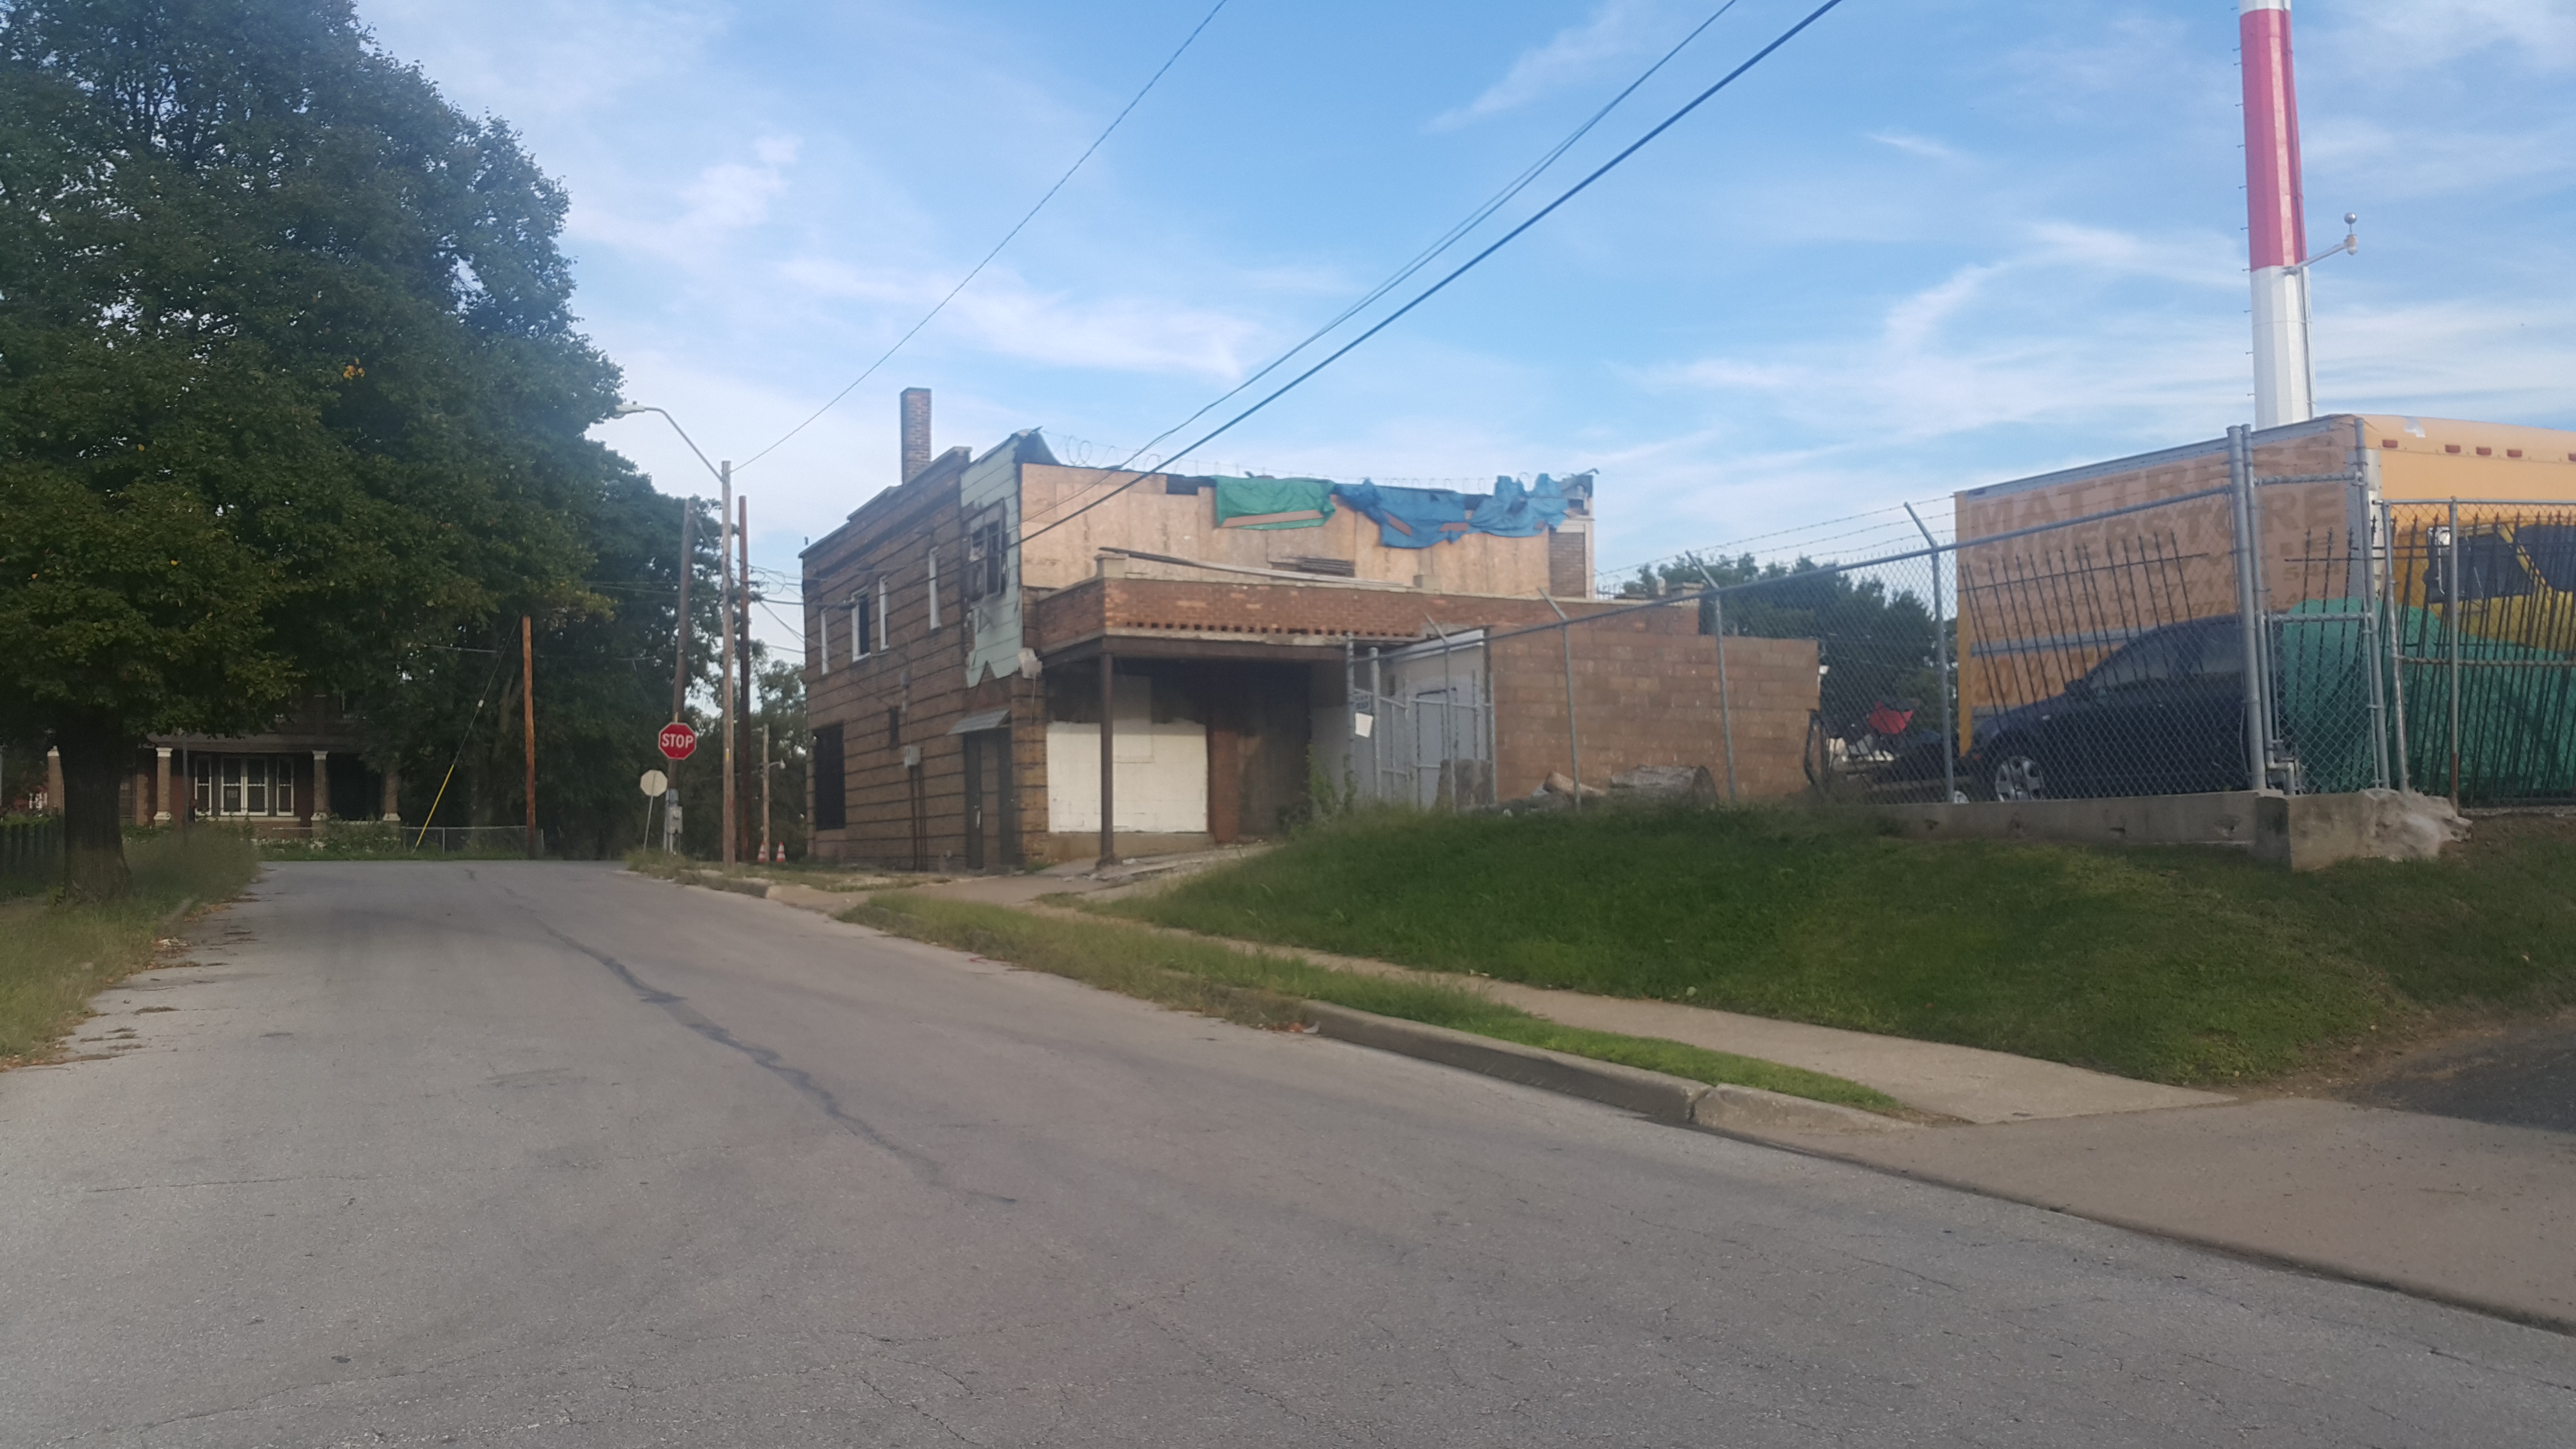
Prospect Ave and 8th-11th St

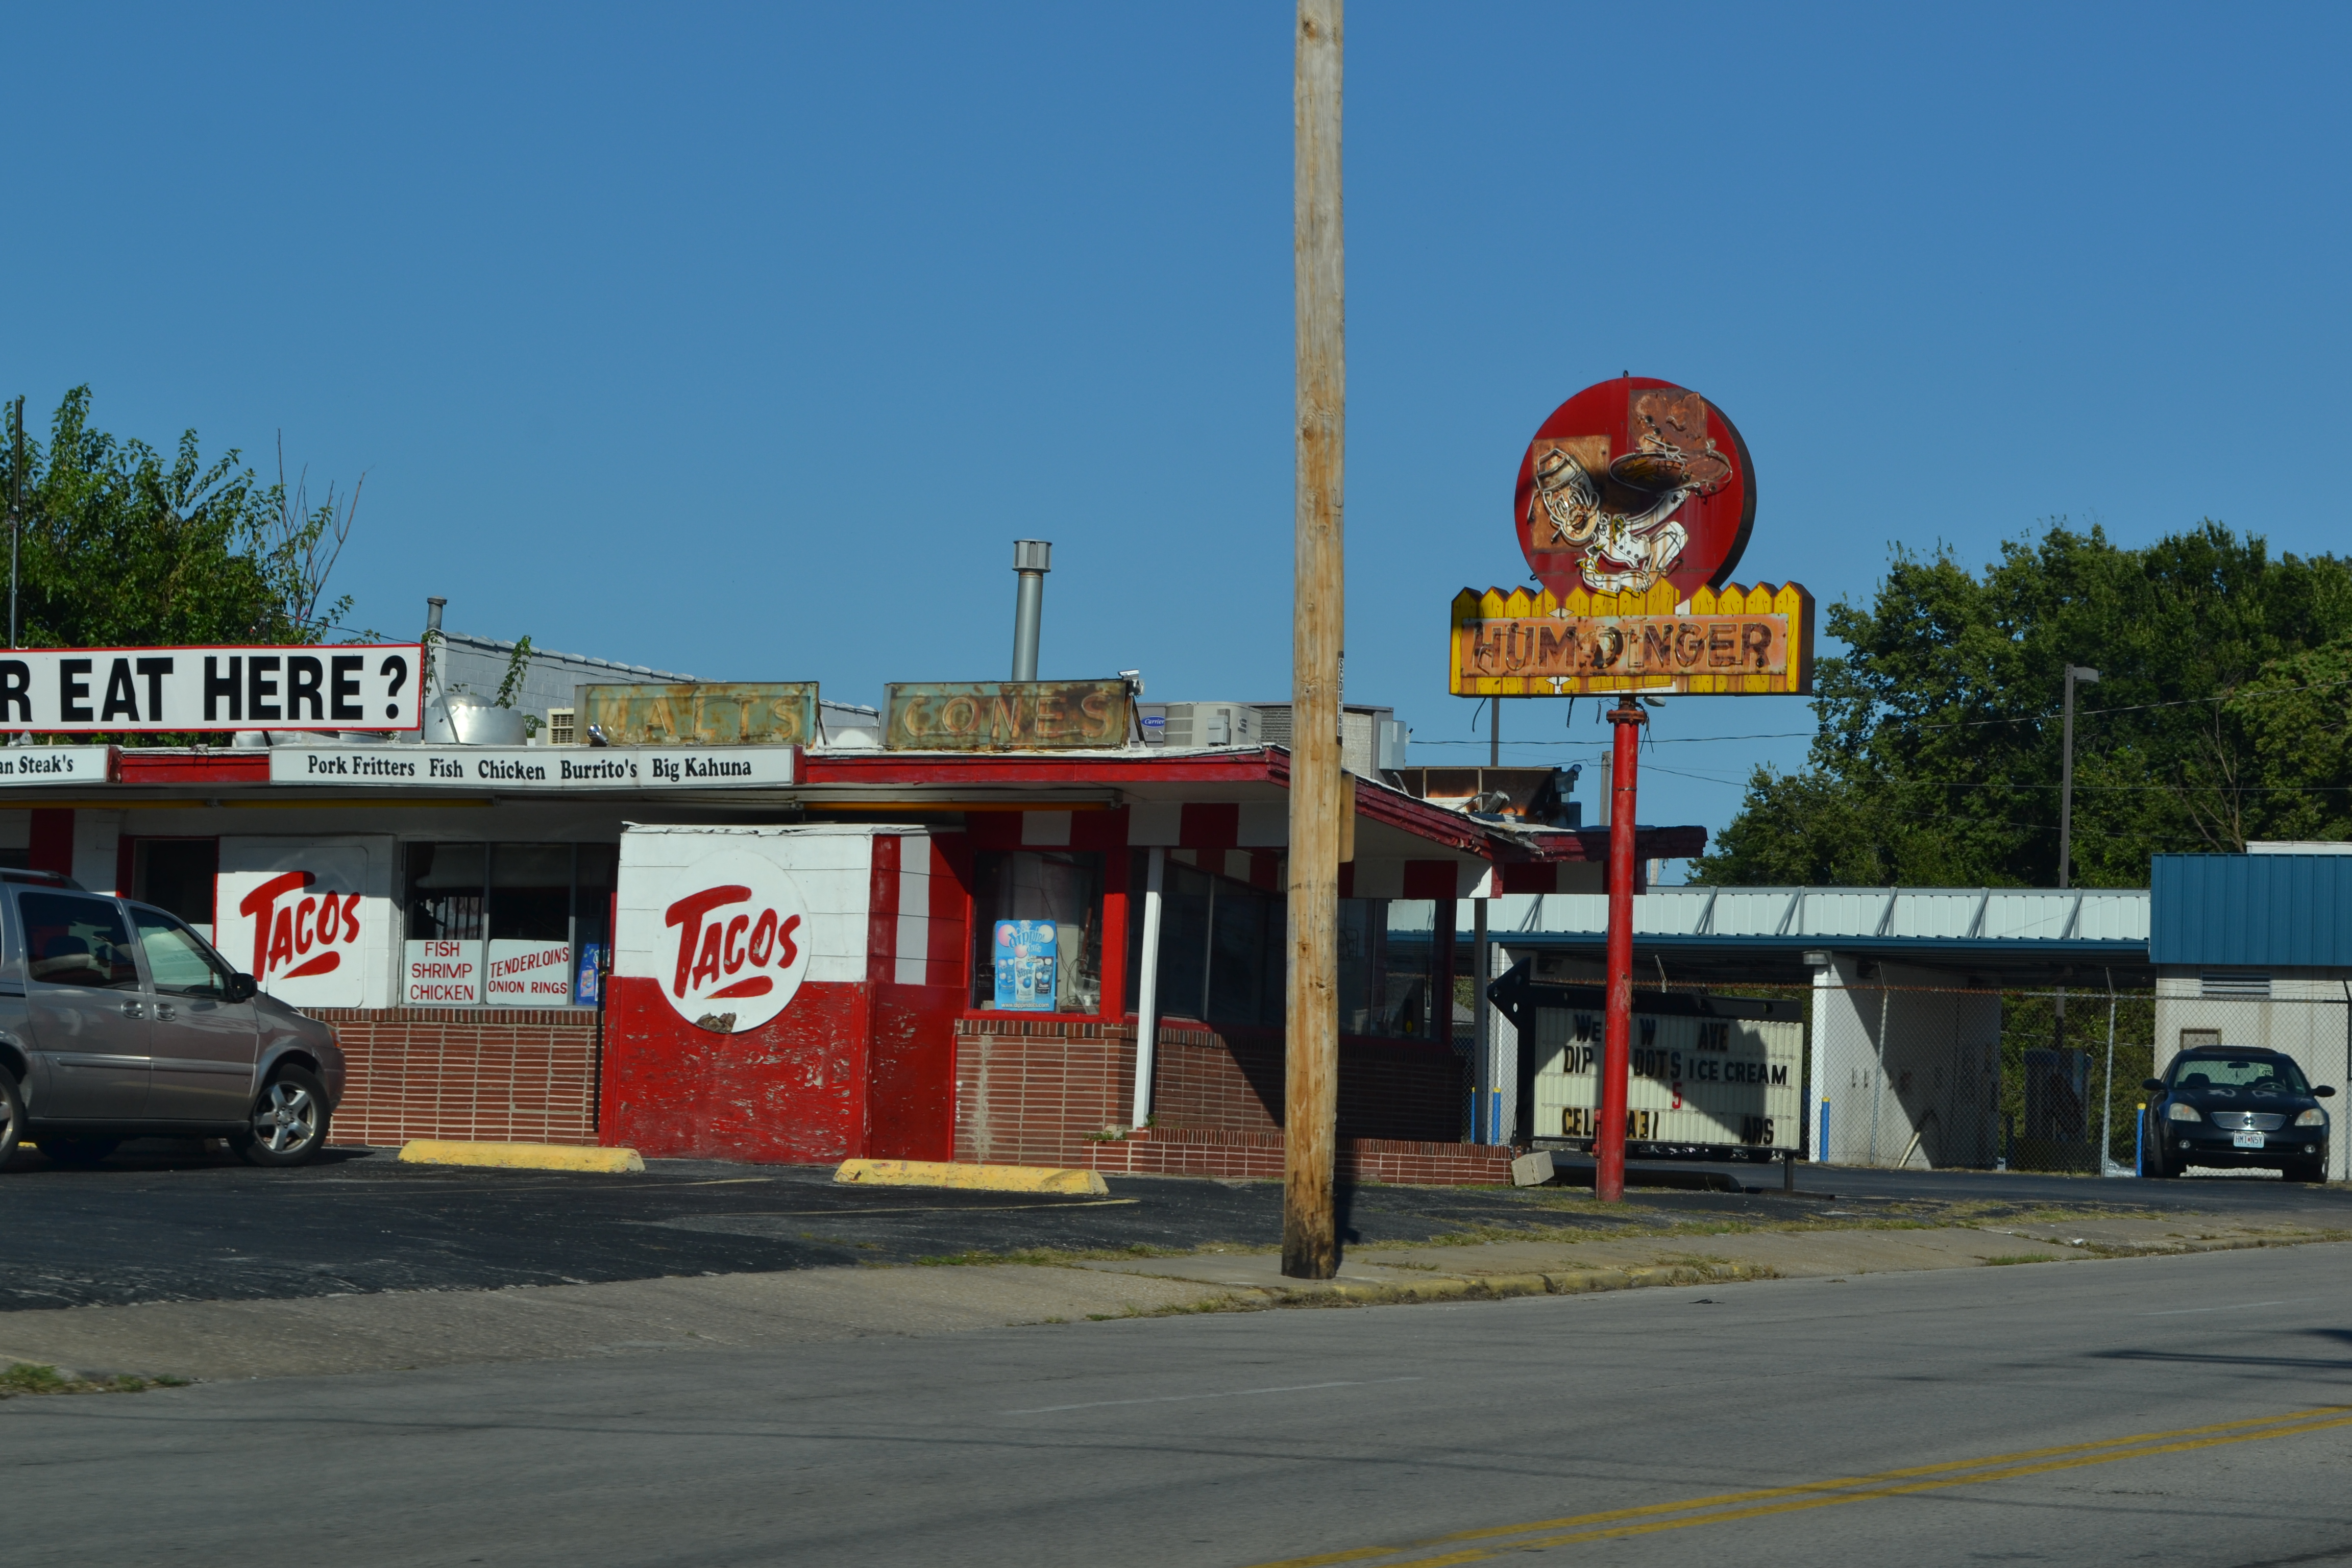
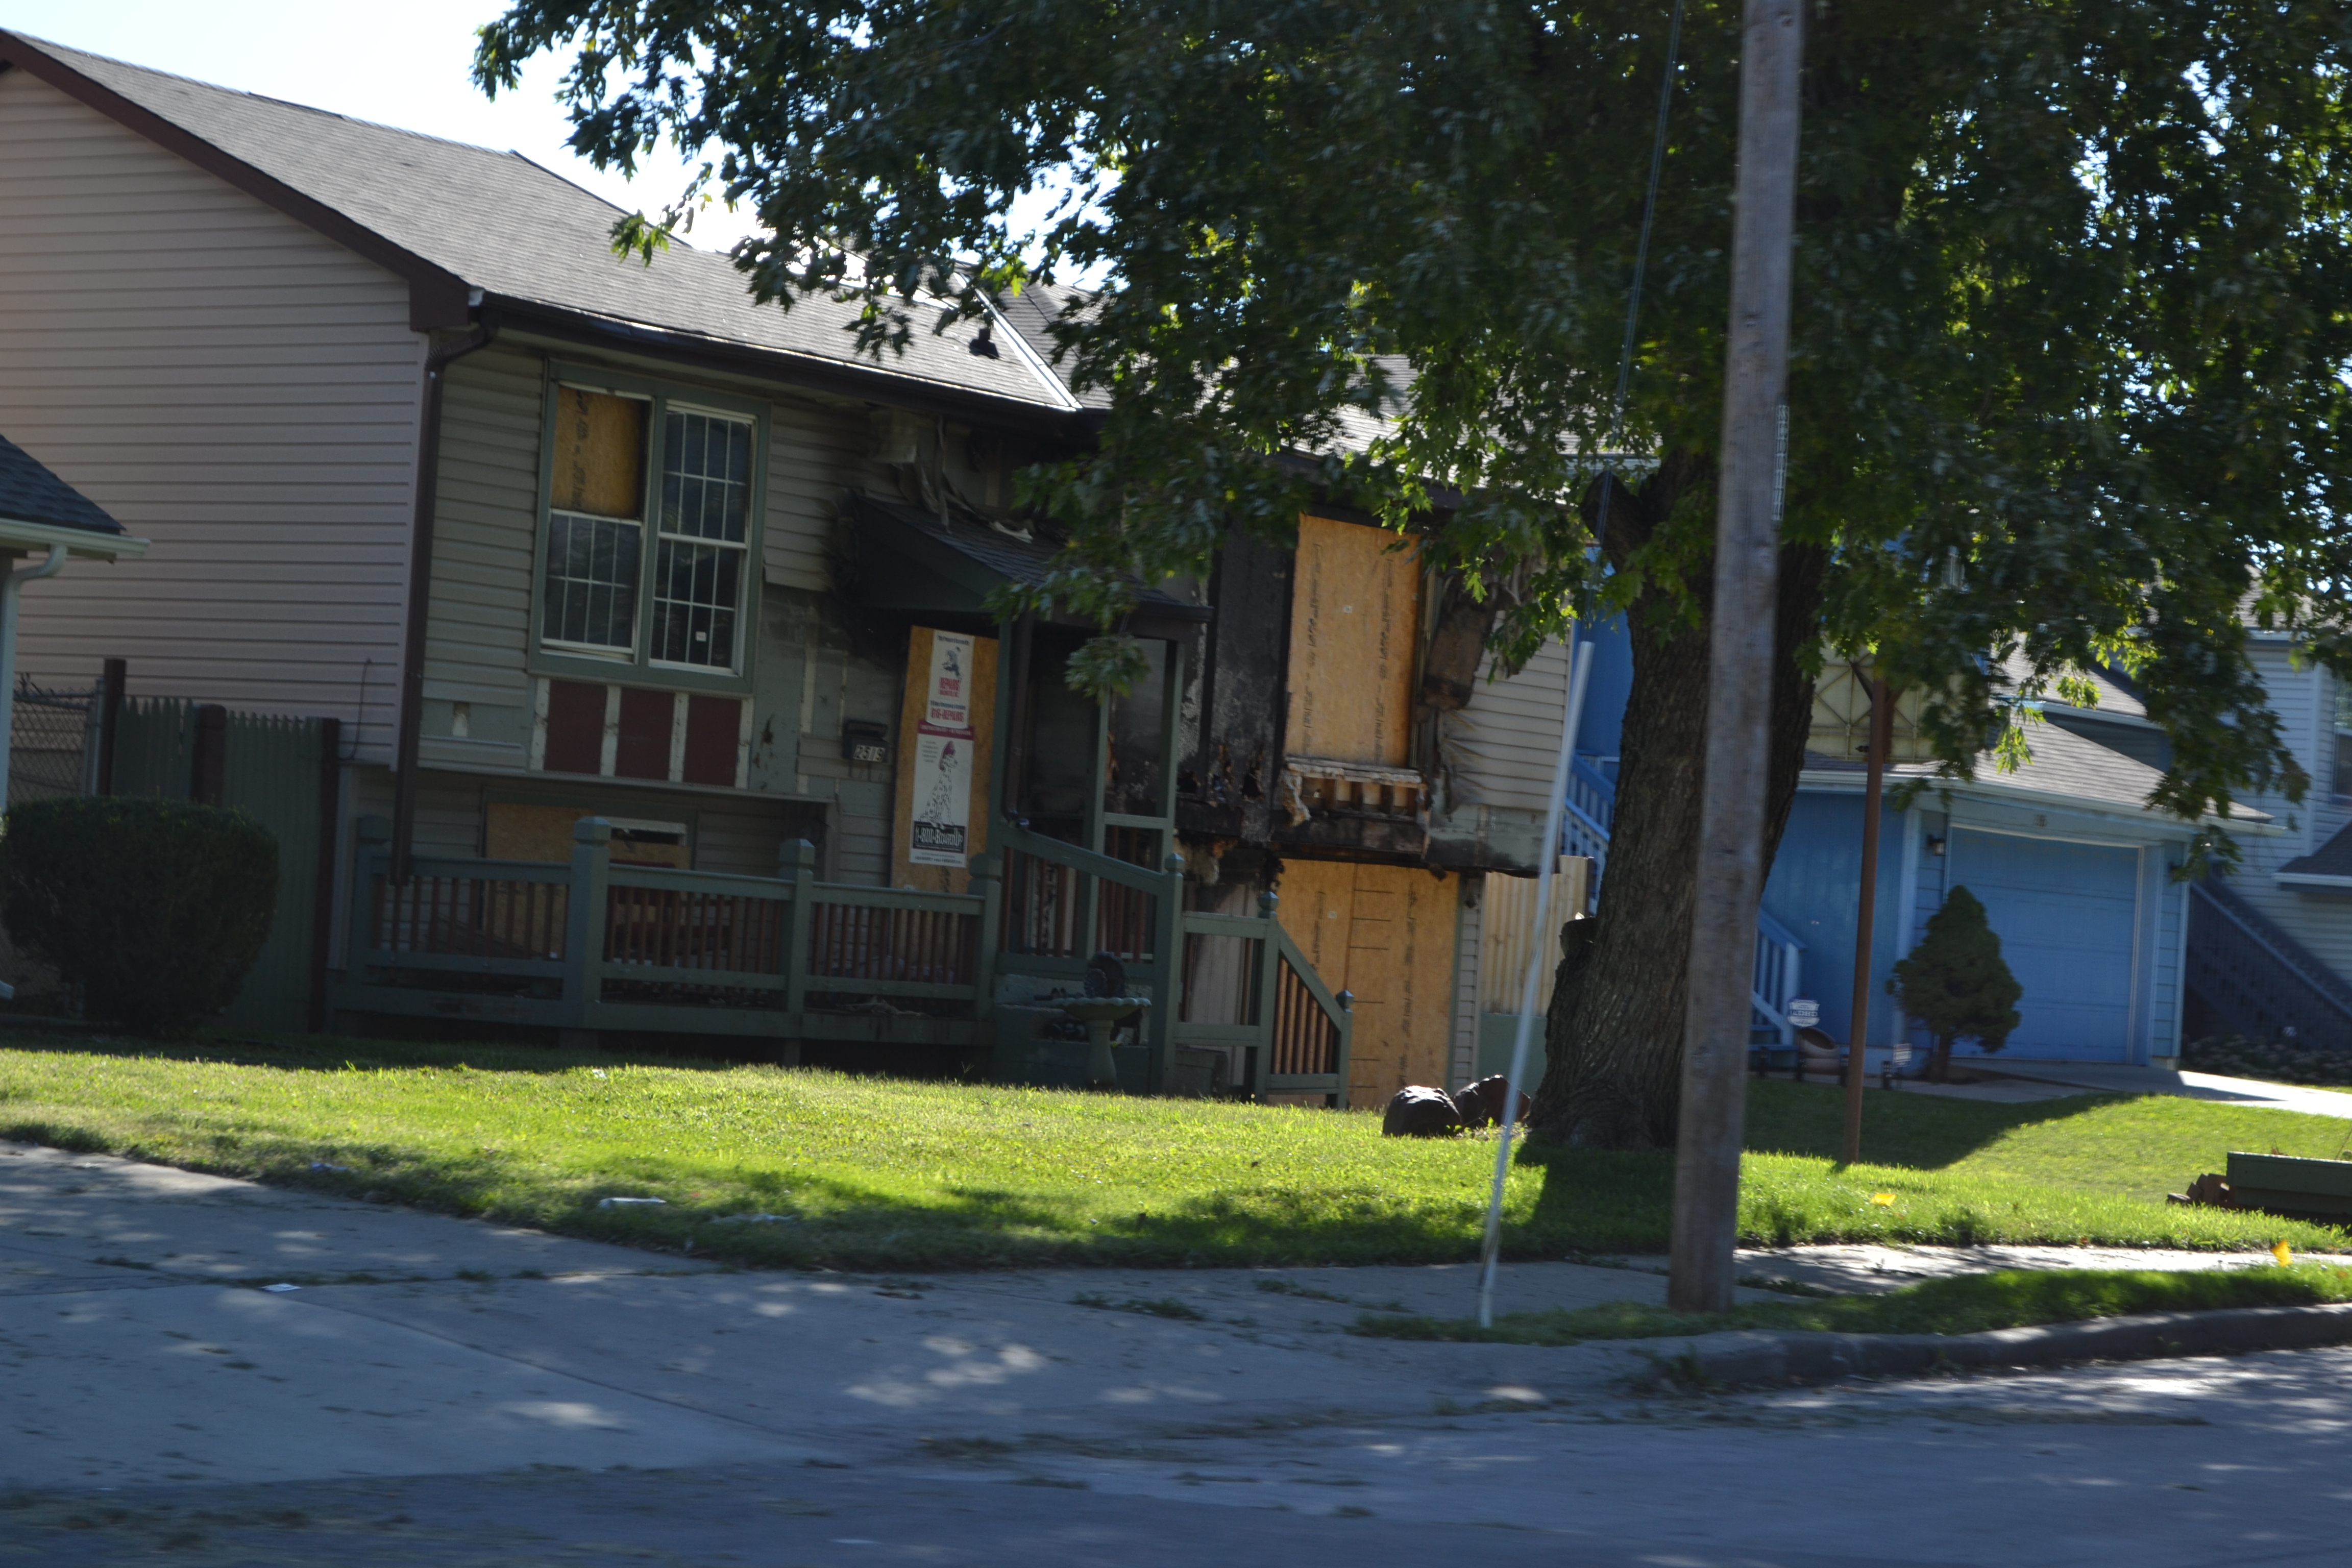
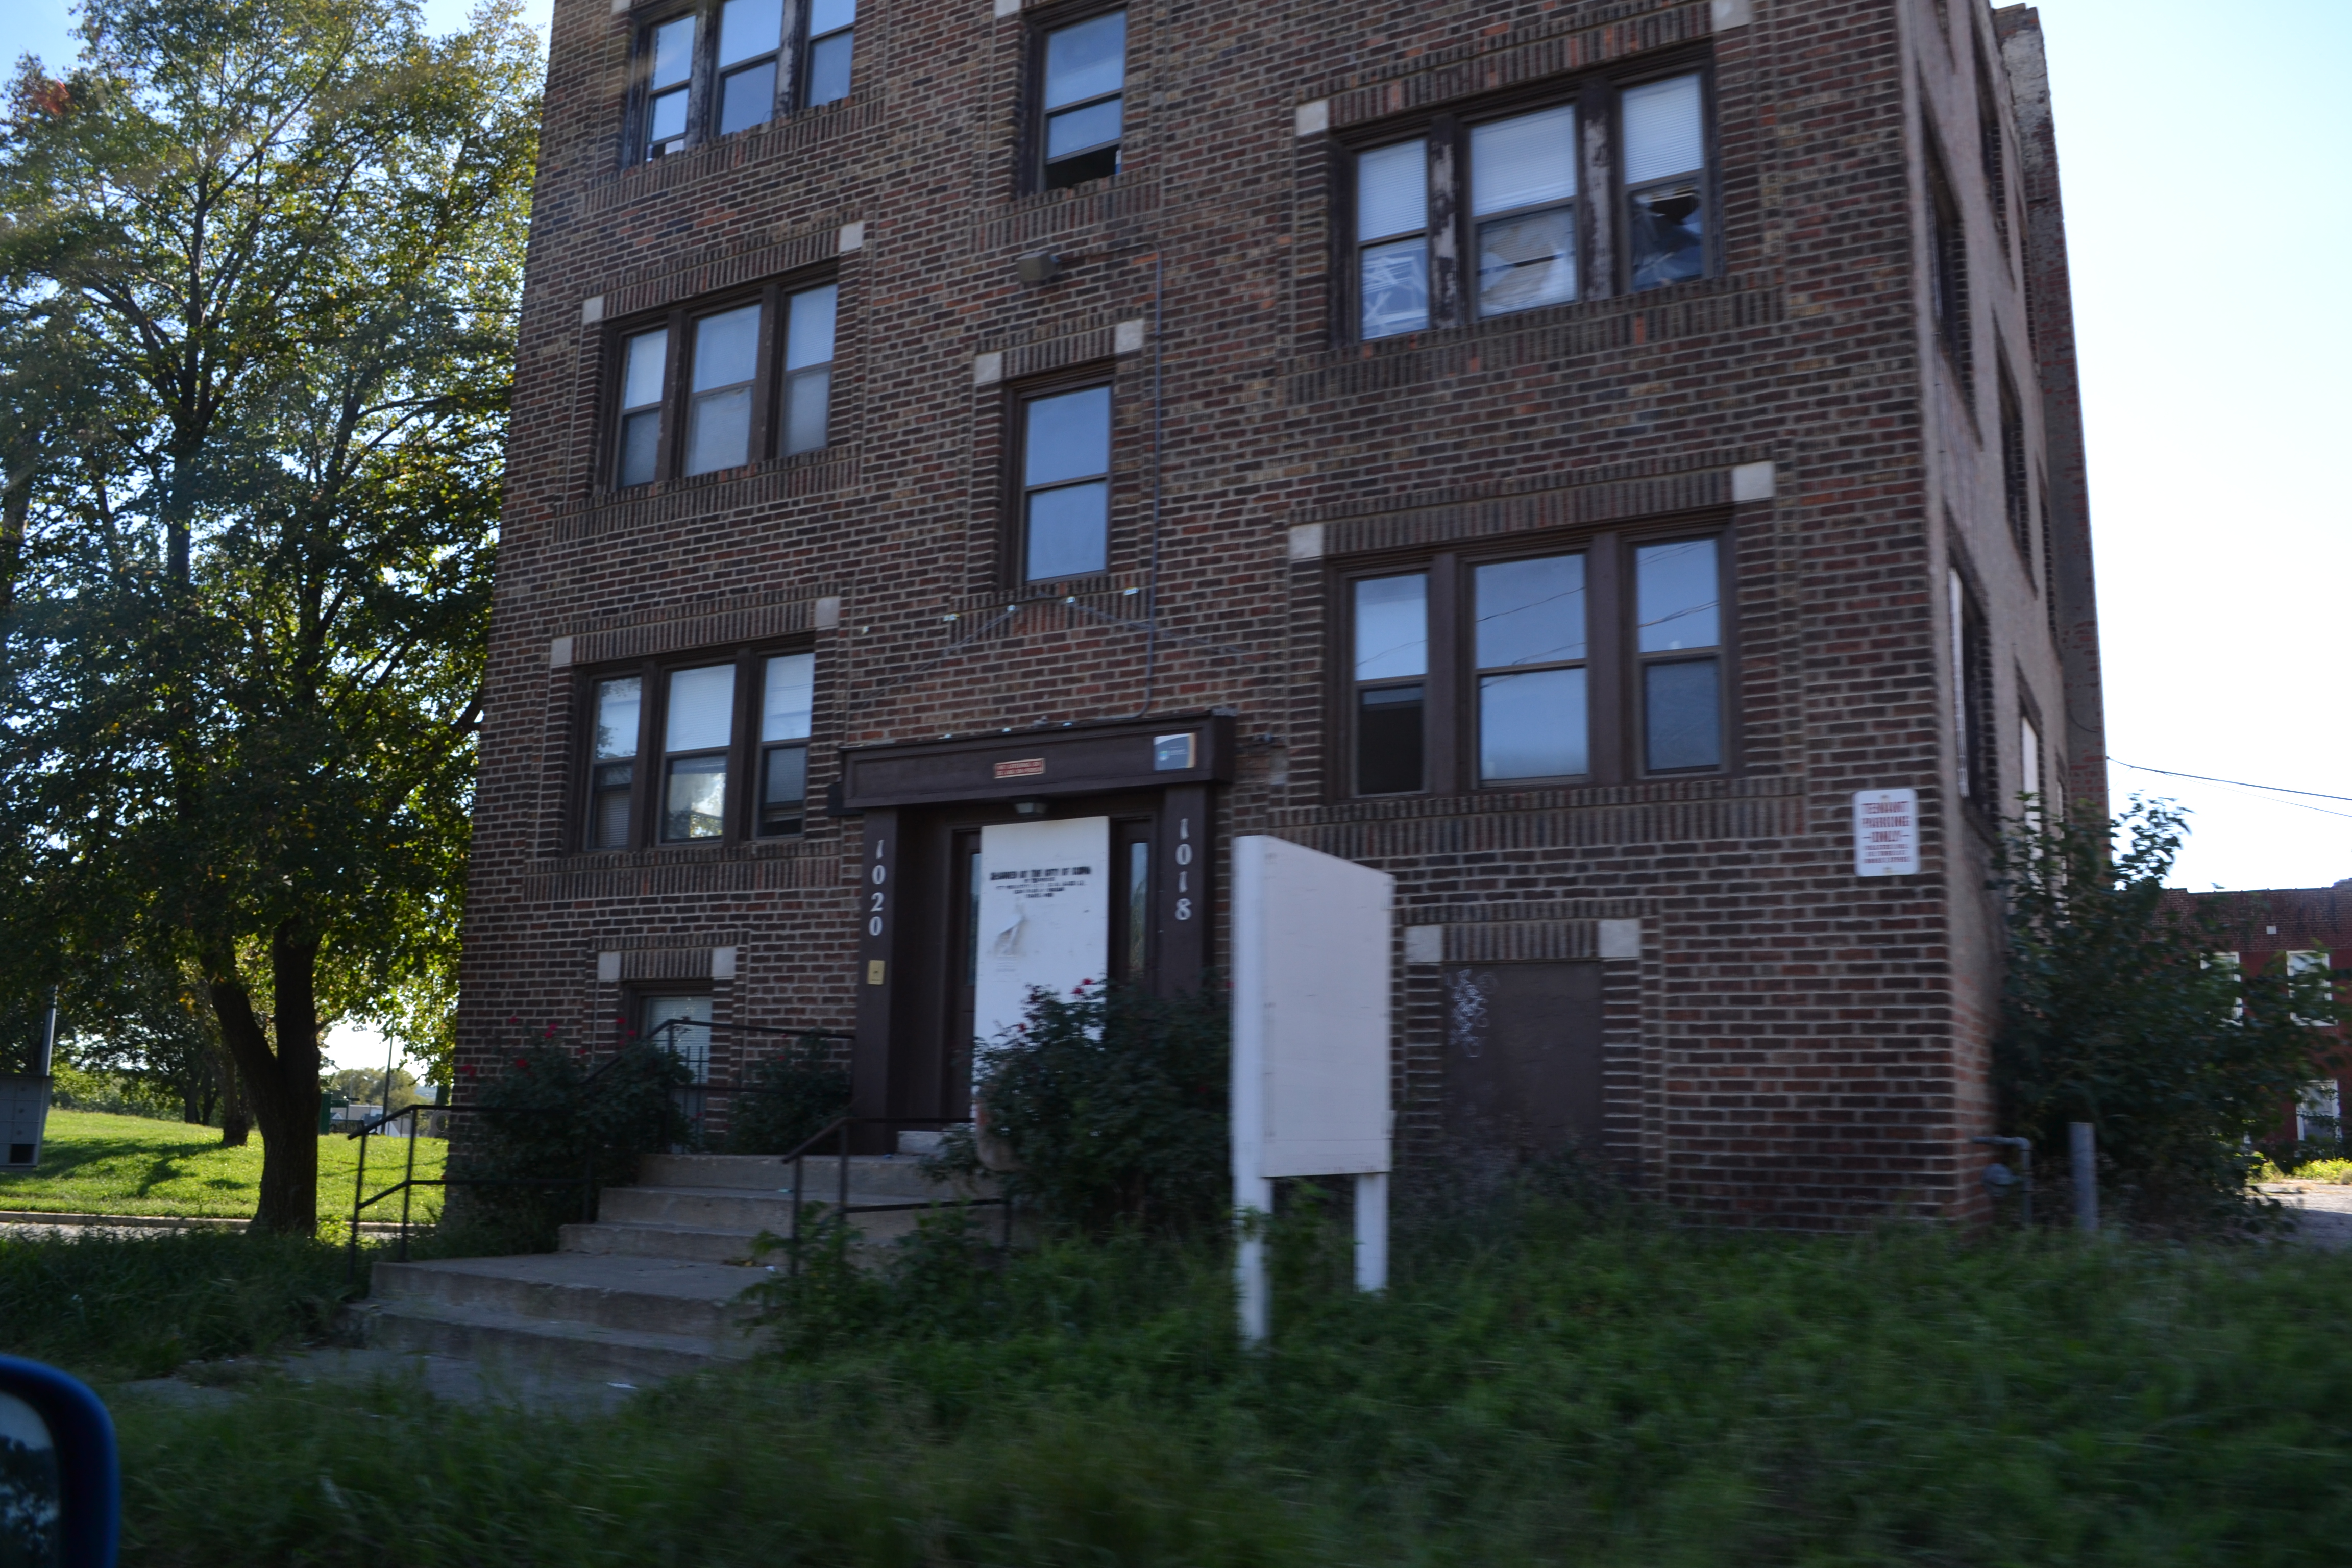
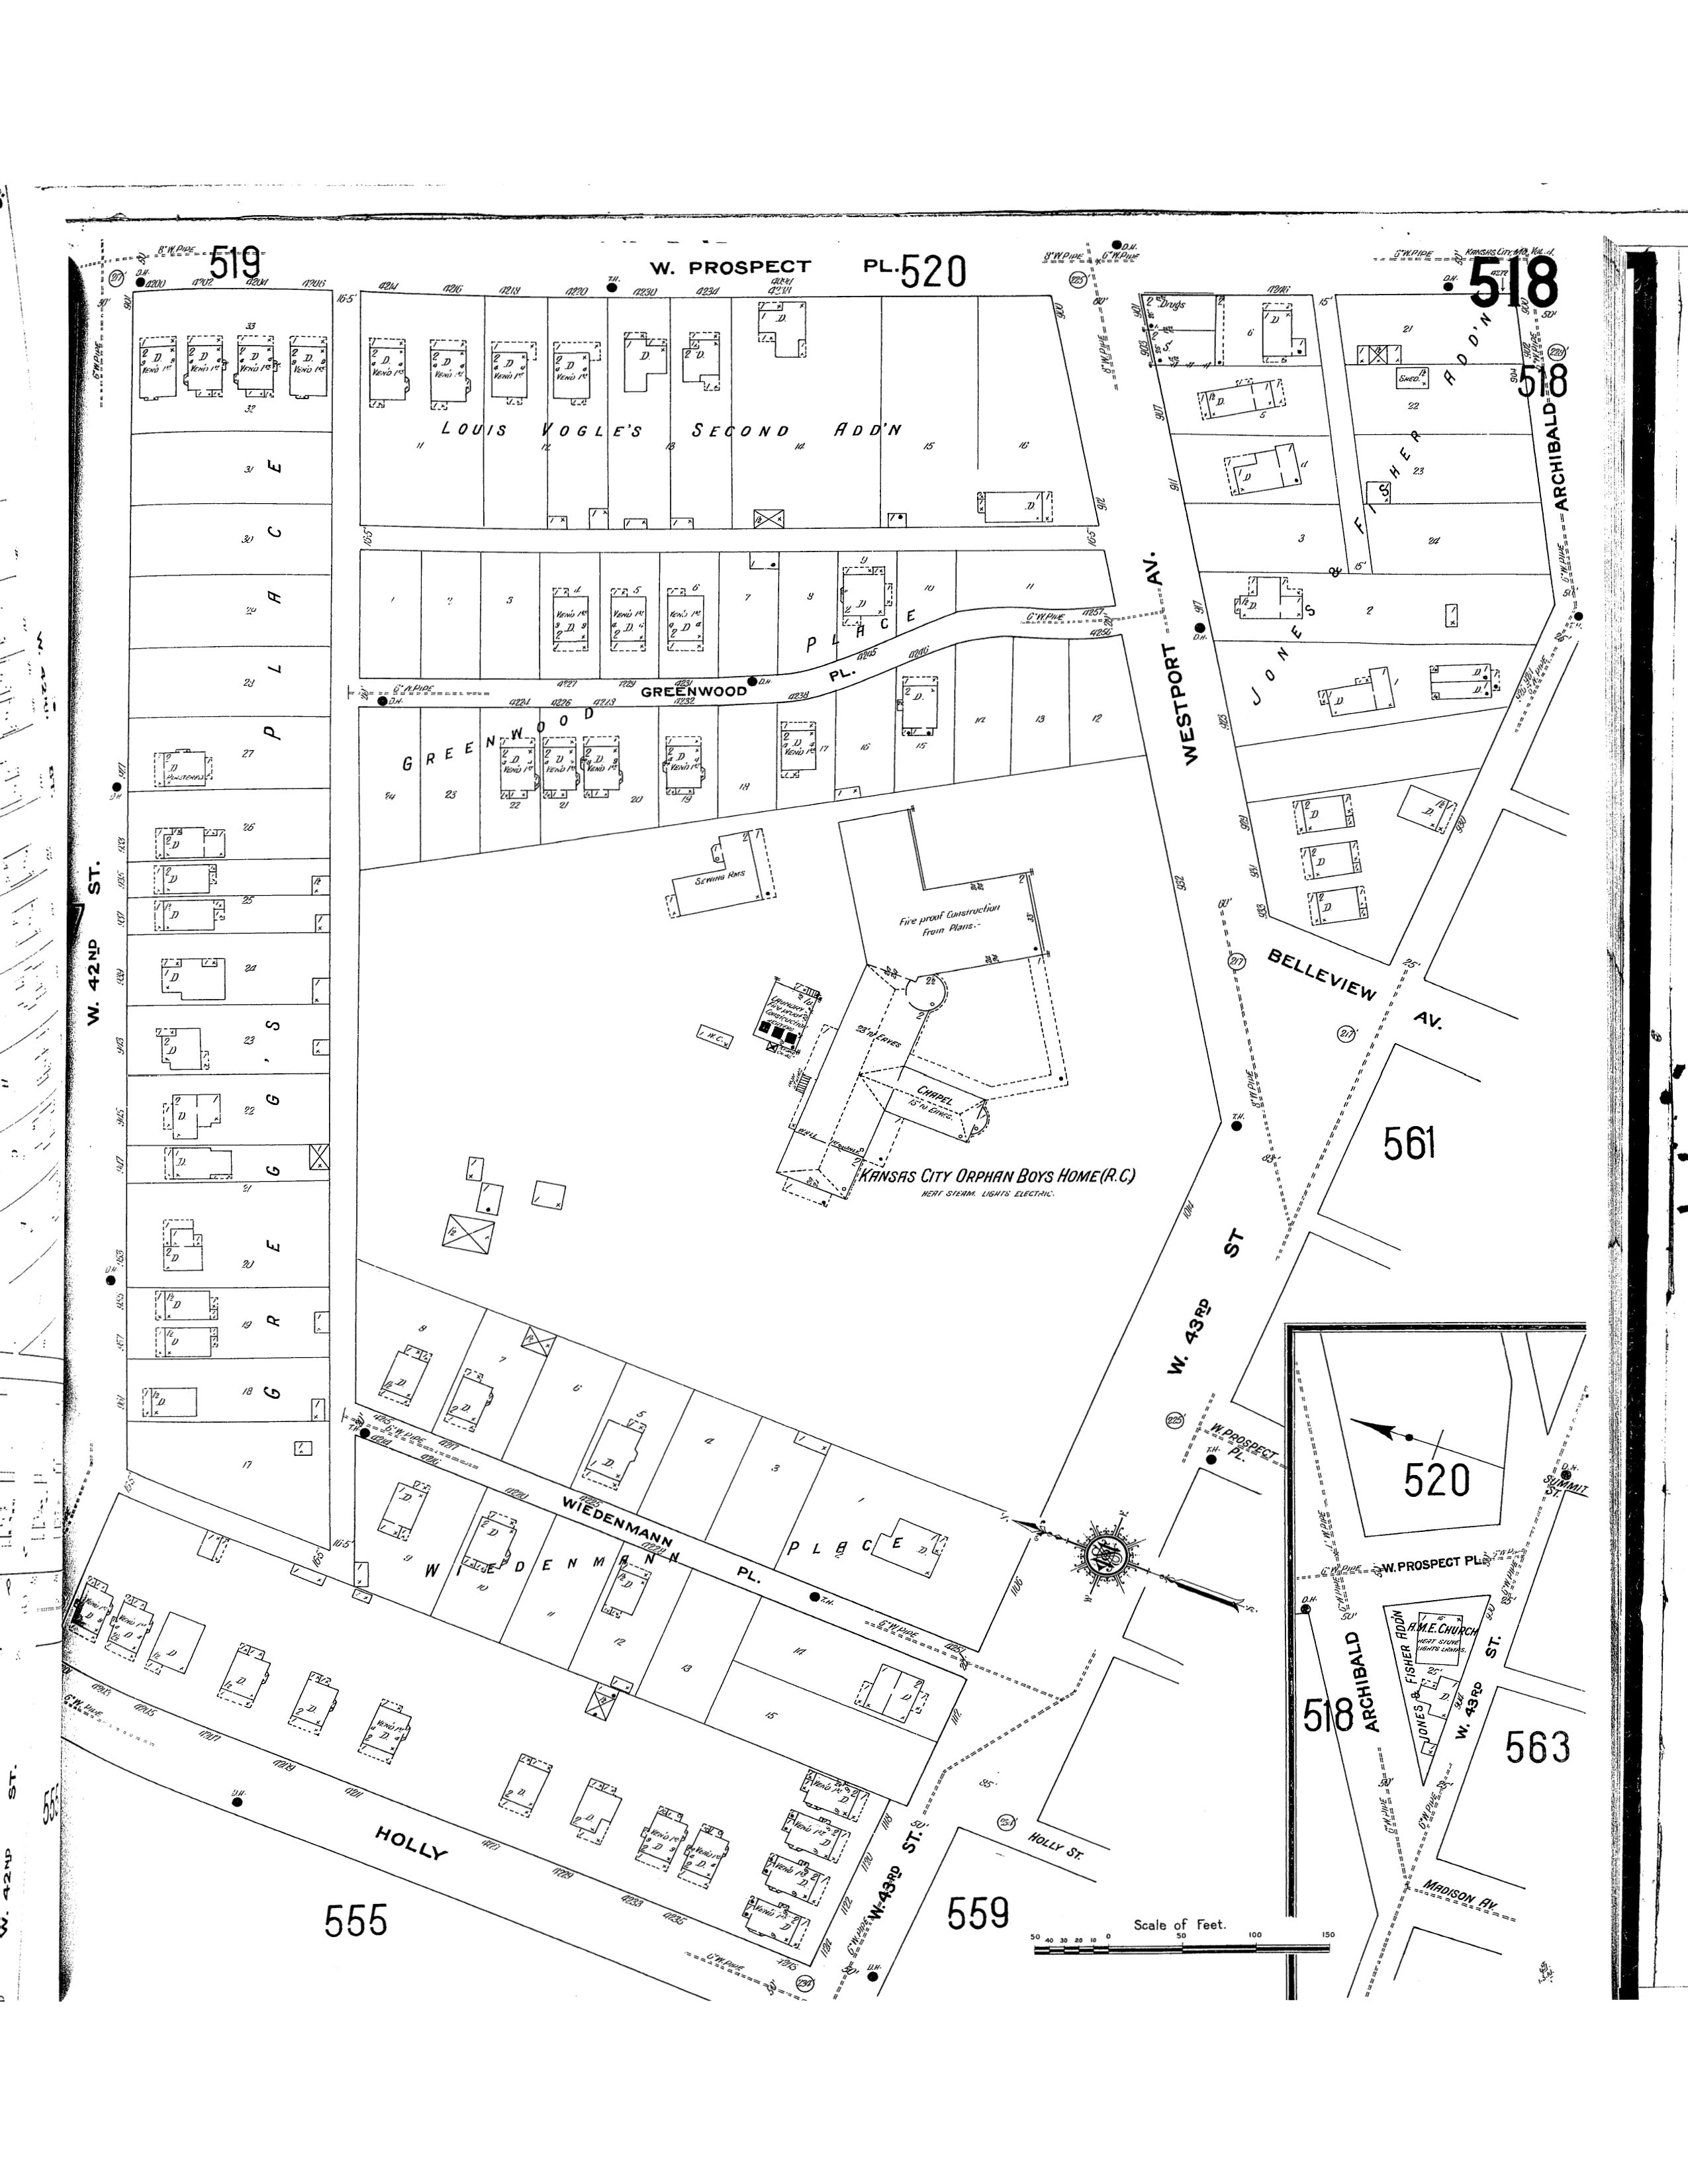
My area along Prospect Ave is a very interesting one. When I did my research of this particular area, the Sanborn maps showed it developing quite nicely with more and more developers buying up land because it was the place to be. But, over time, there has been a definite lack of new growth and development. It was clearly shown that old complexes and houses were traded in, torn down and replaced with low level commercial that kind of signaled the down fall of this area. If you visit this area today, you’ll find lots upon lots of abandoned buildings, apartment complexes, or just empty ones that are overgrown. There is a feeling of neglect and nostalgia of “what once was”. The time, money and care haven’t been put into this area anymore.
42nd through 44 Historical Development
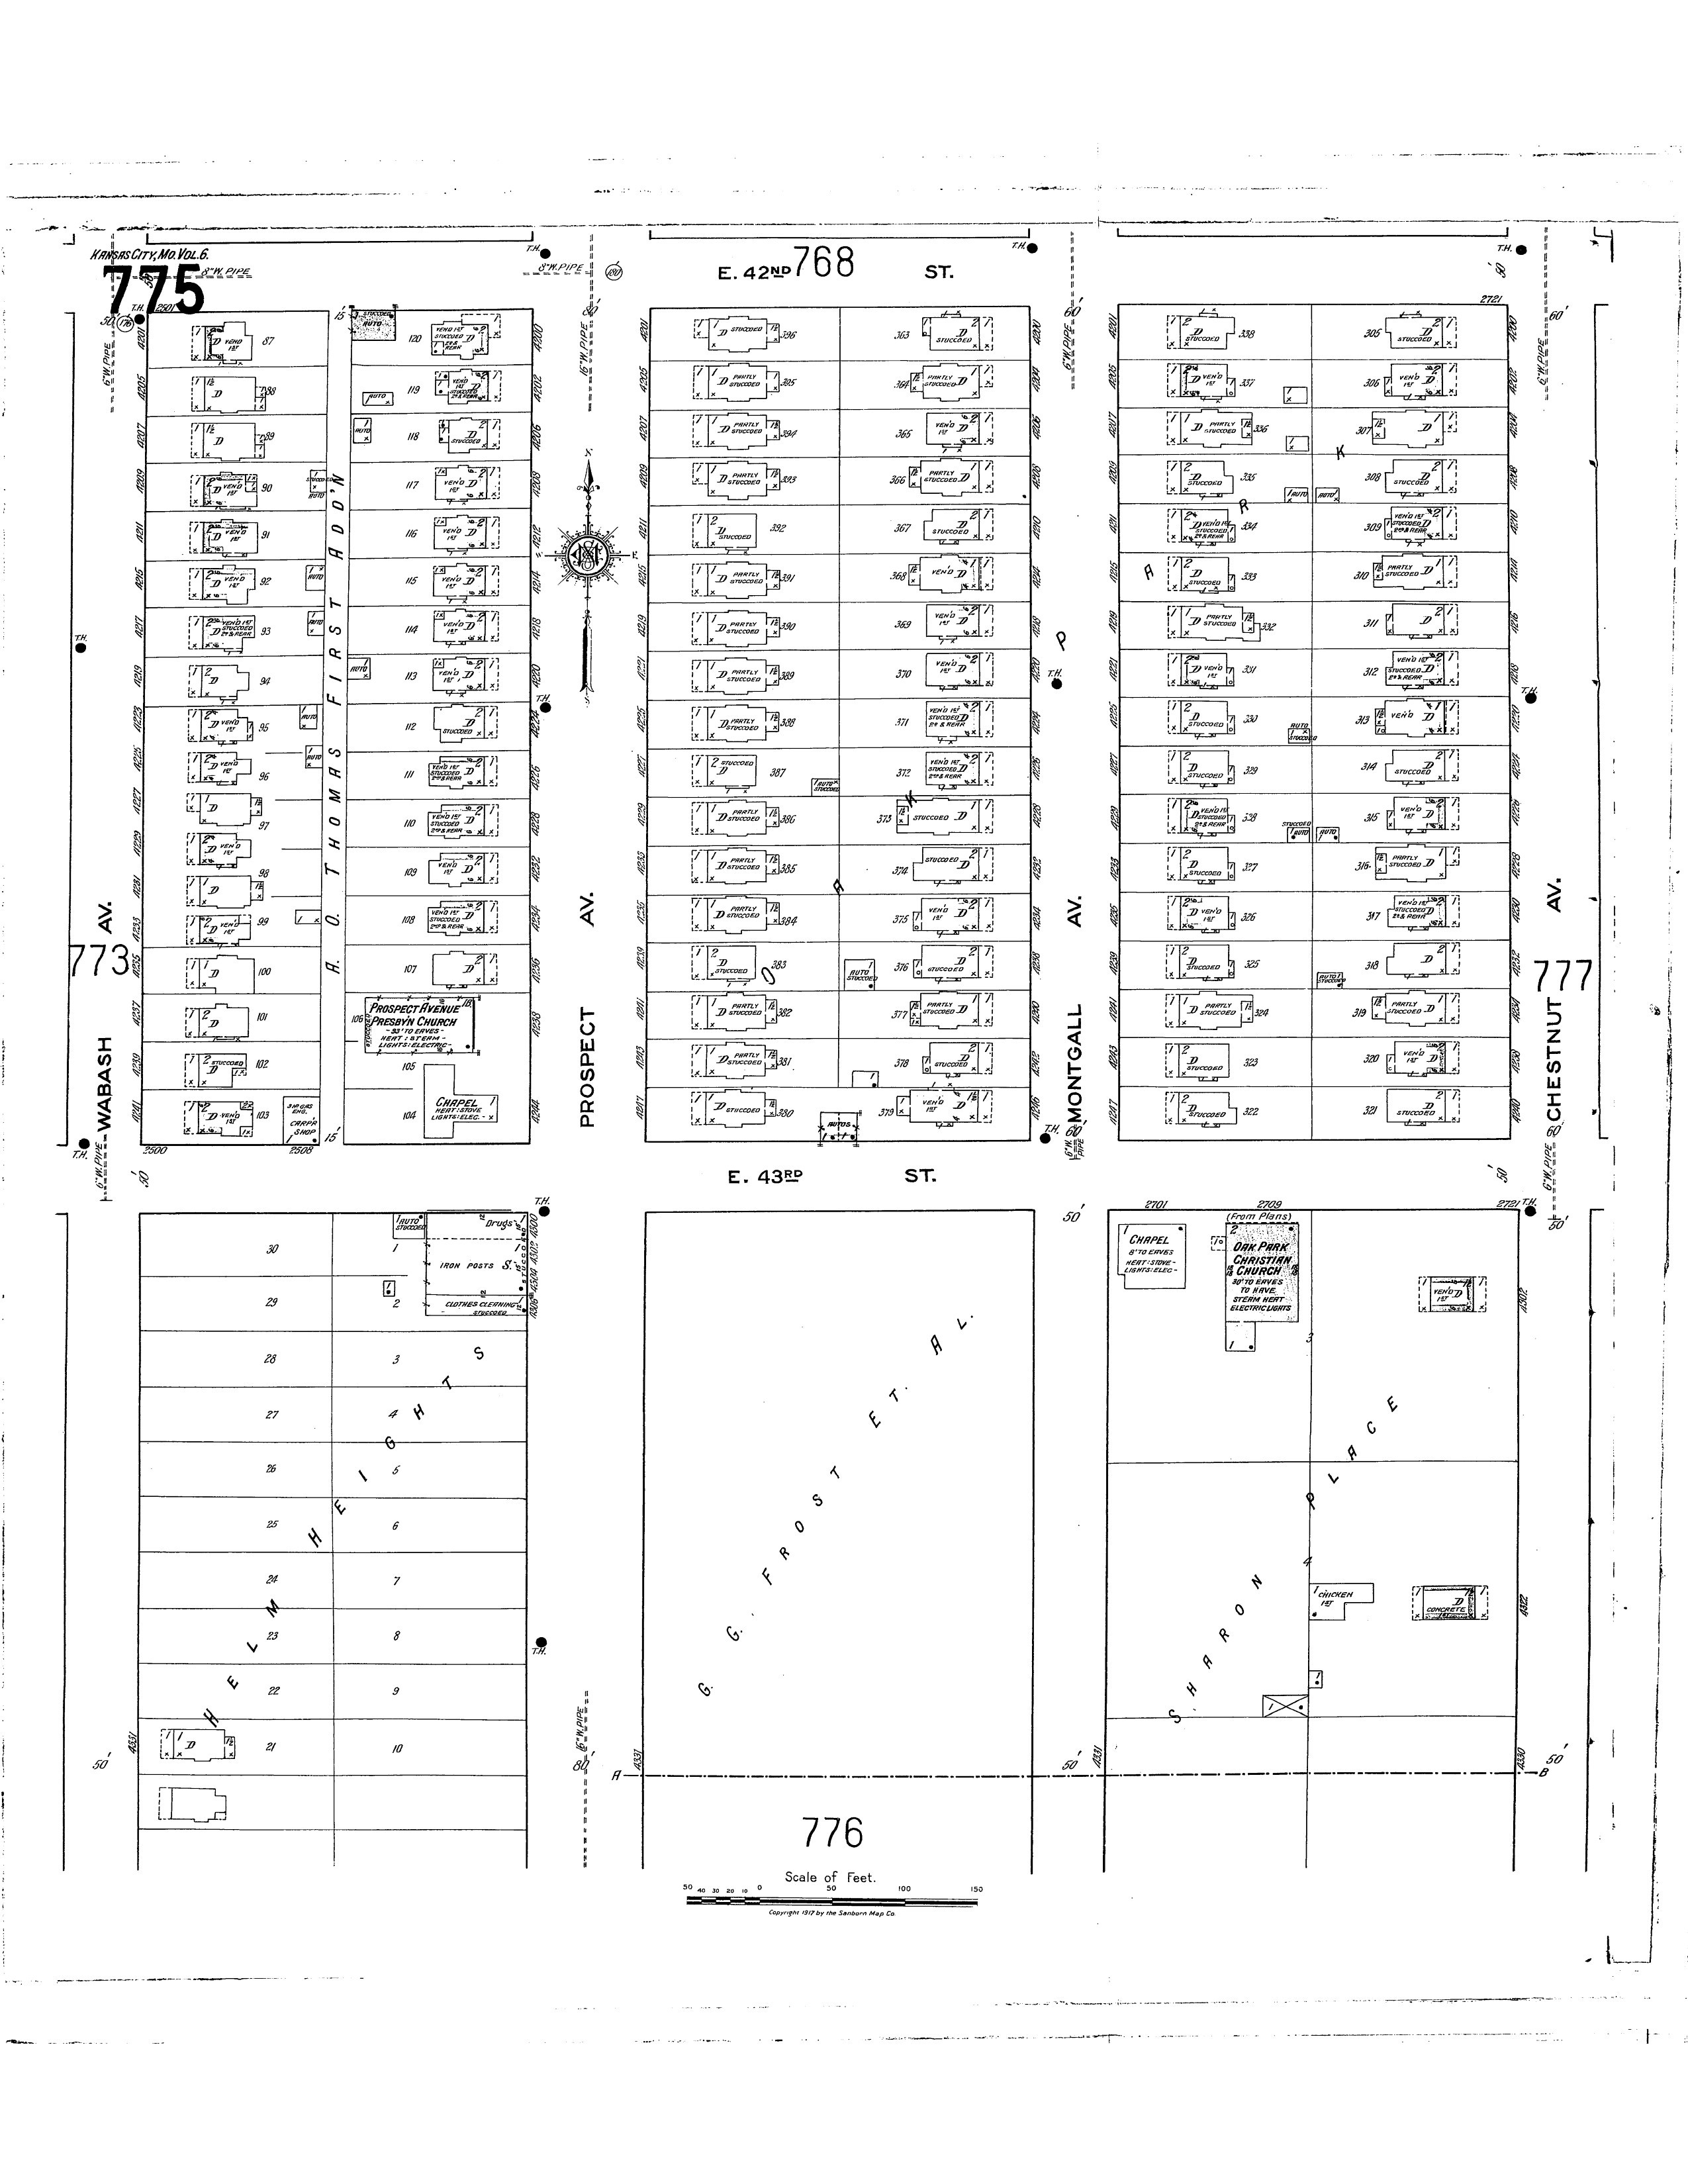
The Map on the left is a Sanborn Map from 1909 showing 42nd street to Prospect and the Map on the right is a 1917 Sanborn Map. With the Map on the left showing roads that angle, they were reconstructed sometime between 1909 and 1917 to form a more grid like pattern. With new construction of the block came more lots that are formal to each other throughout the block. This made it easier to sell for dwellings on the evenly divided lots. The 1917 Sanborn map is what the block looks like currant day with a few less houses.
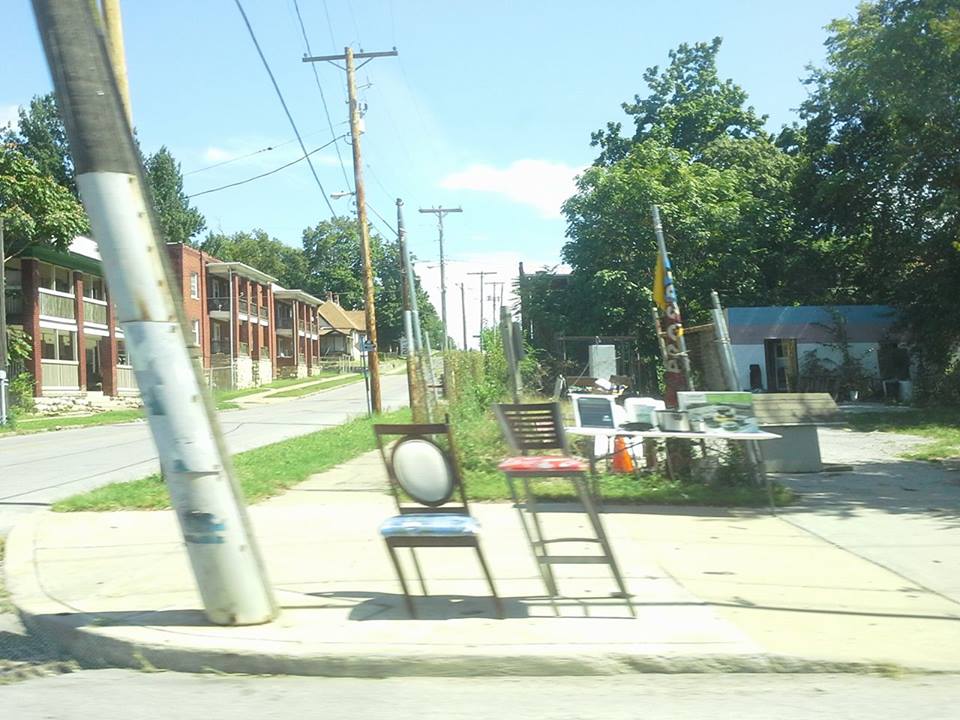
Prospect between 21st and 24th Street
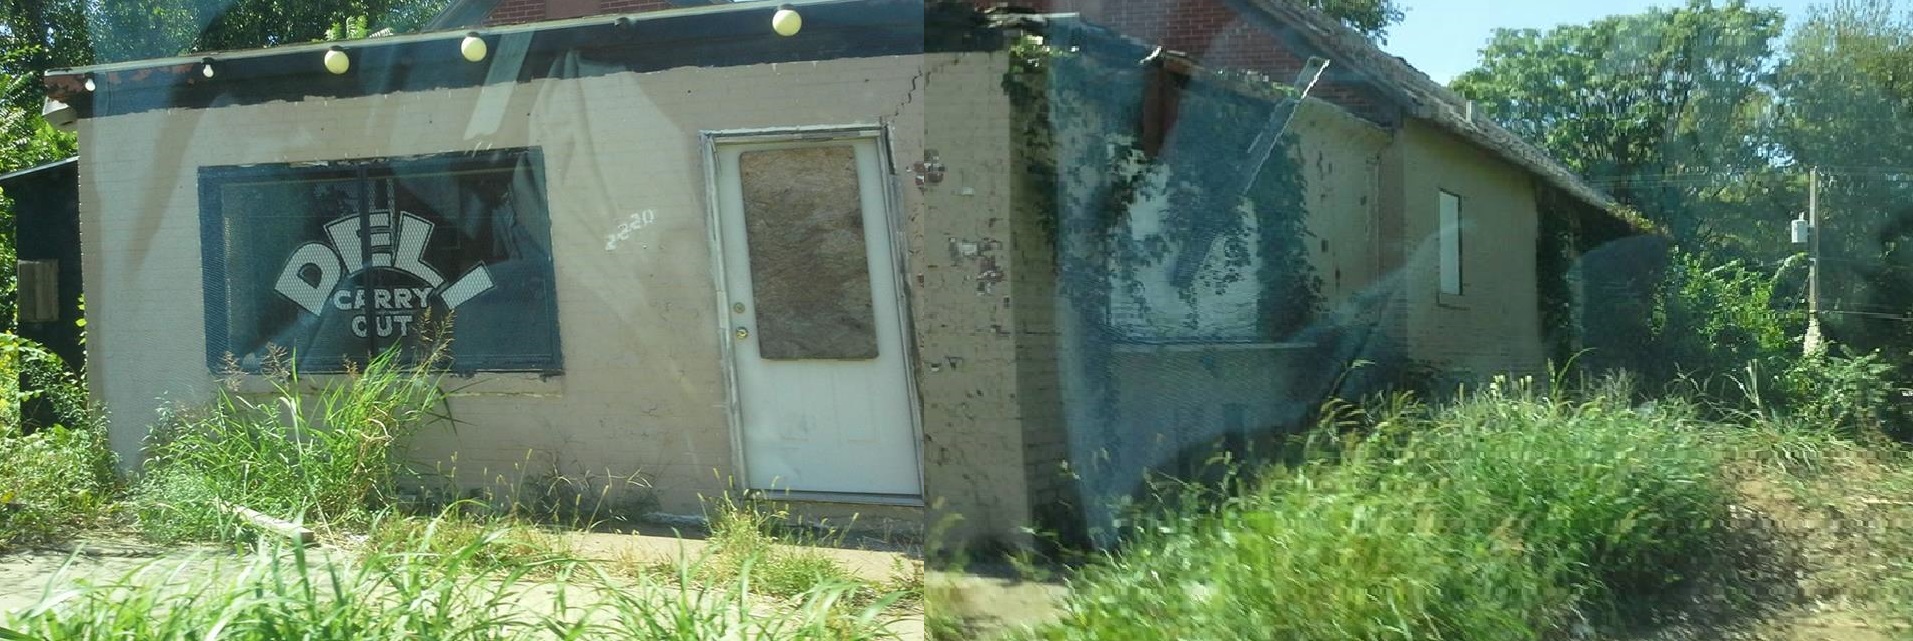
Closed deli on Prospect
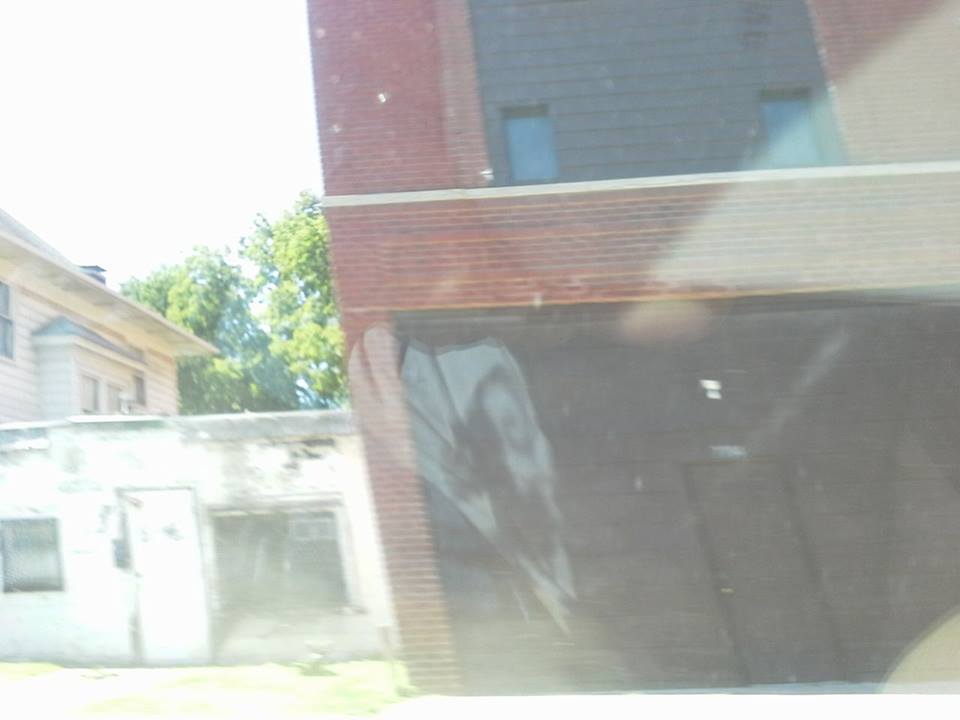
Another abandoned and run down building.
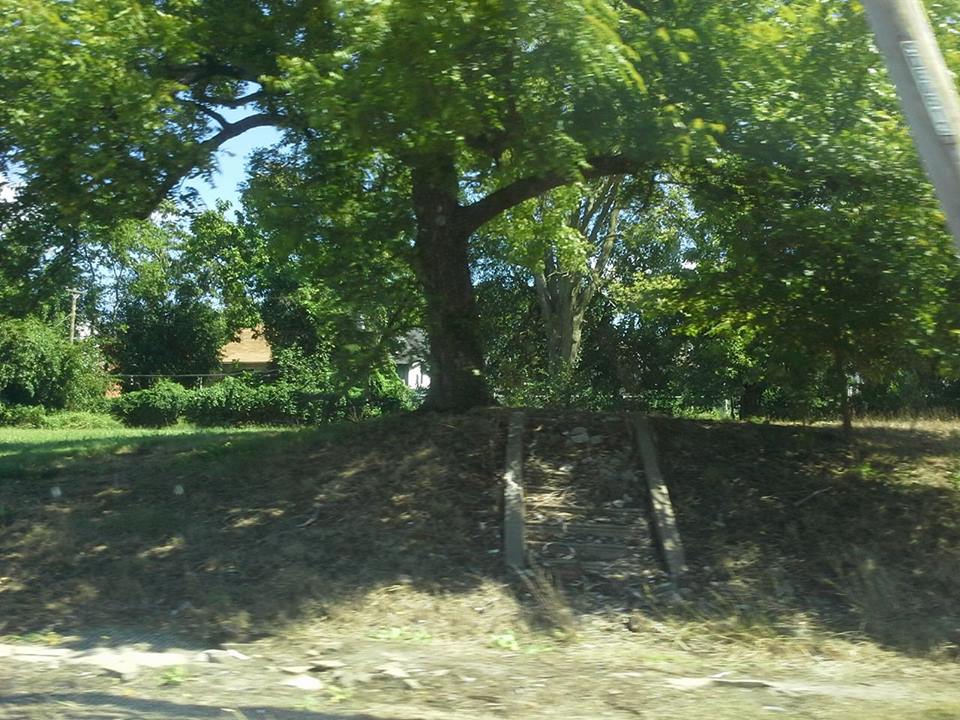
Stairs to nowhere.
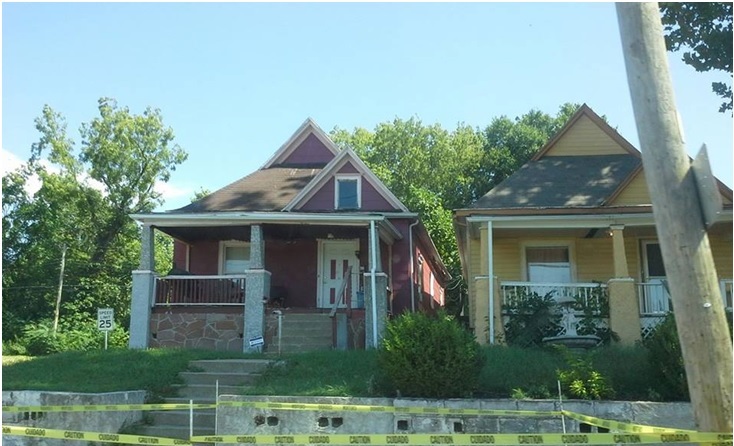
2101 and 2103 Prospect Ave, newly renovated houses.
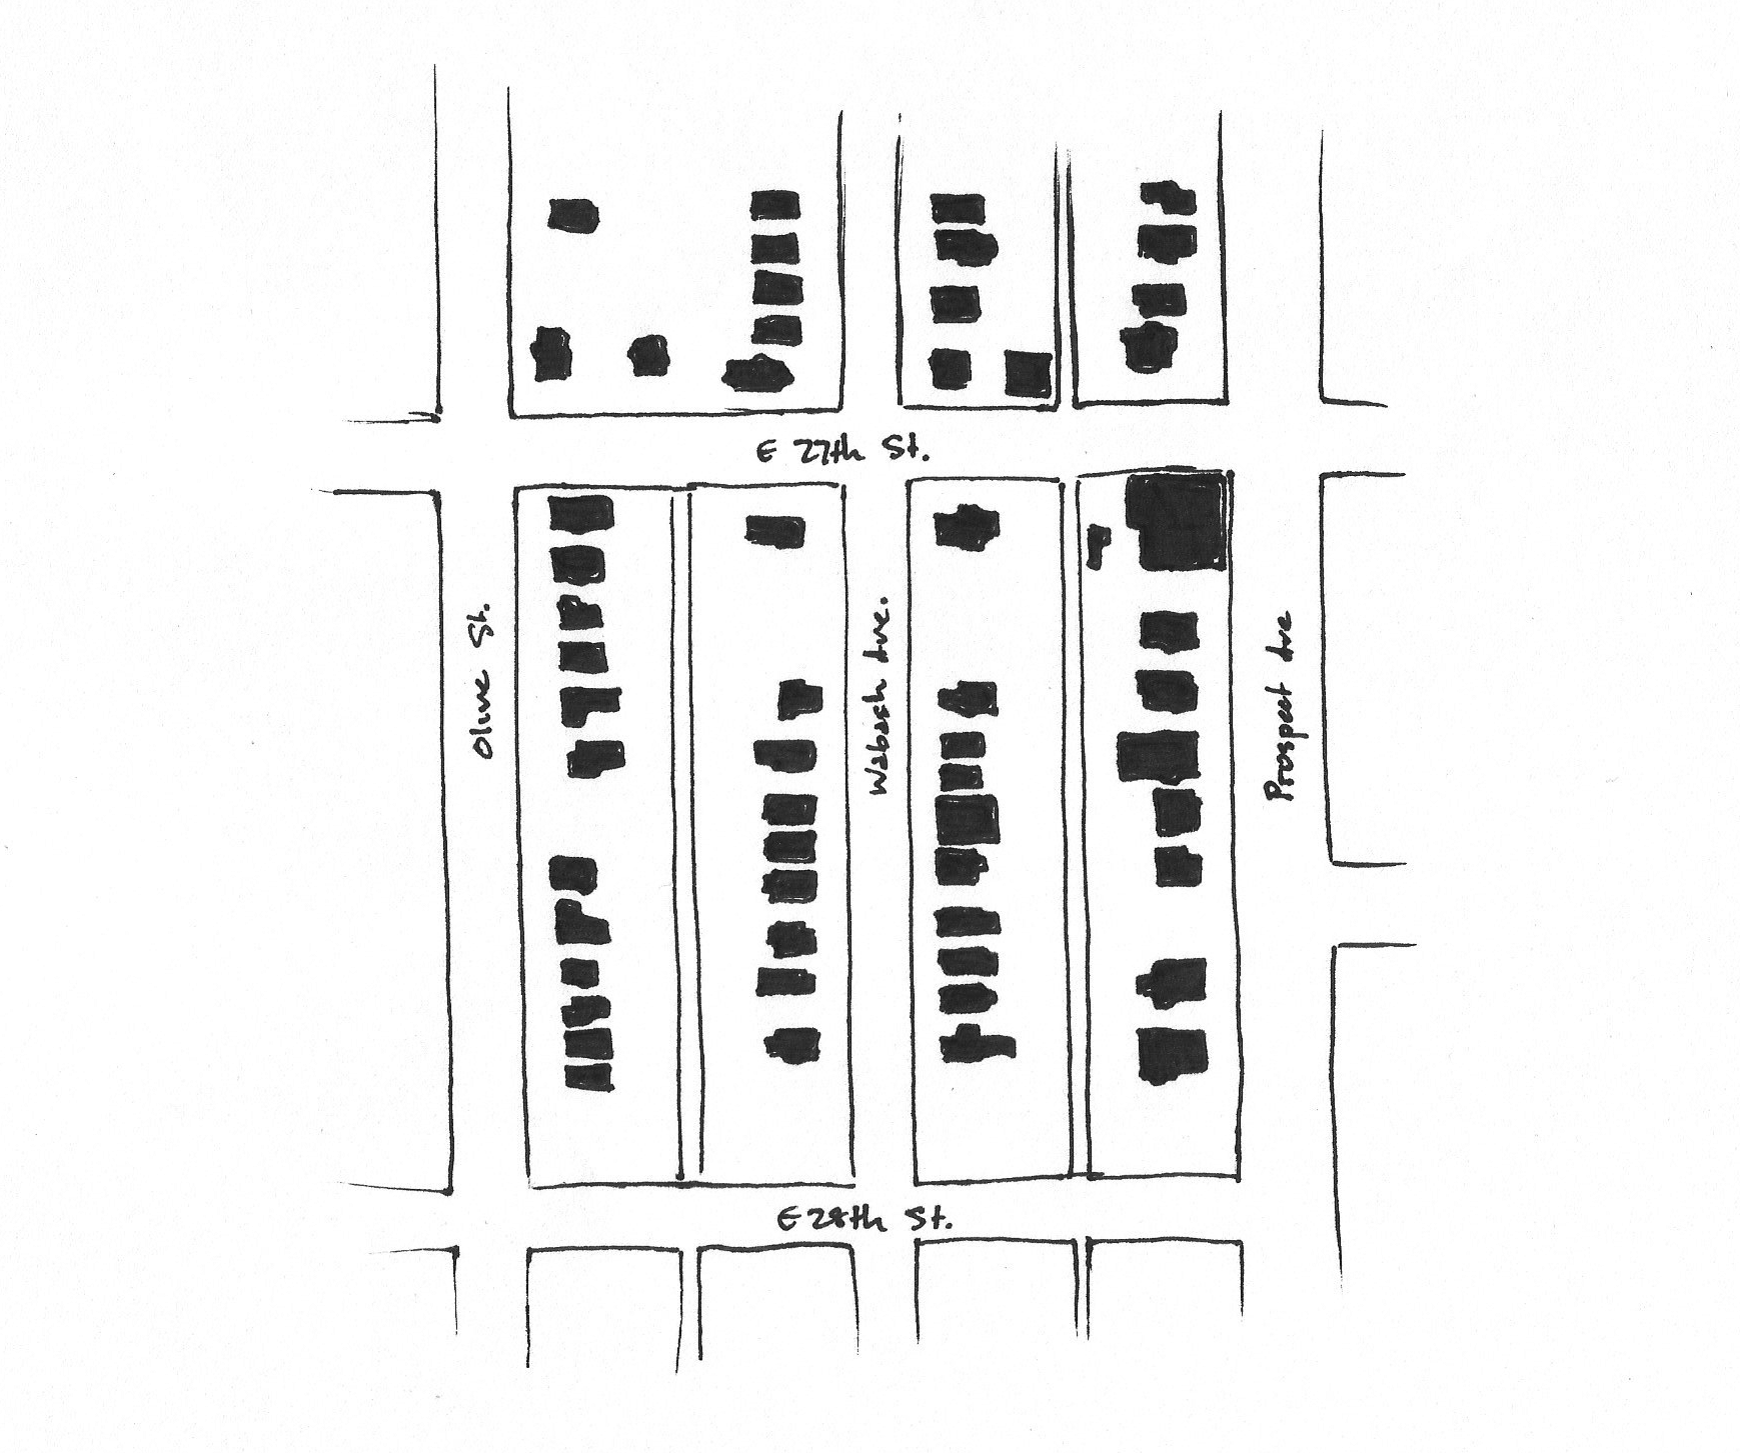
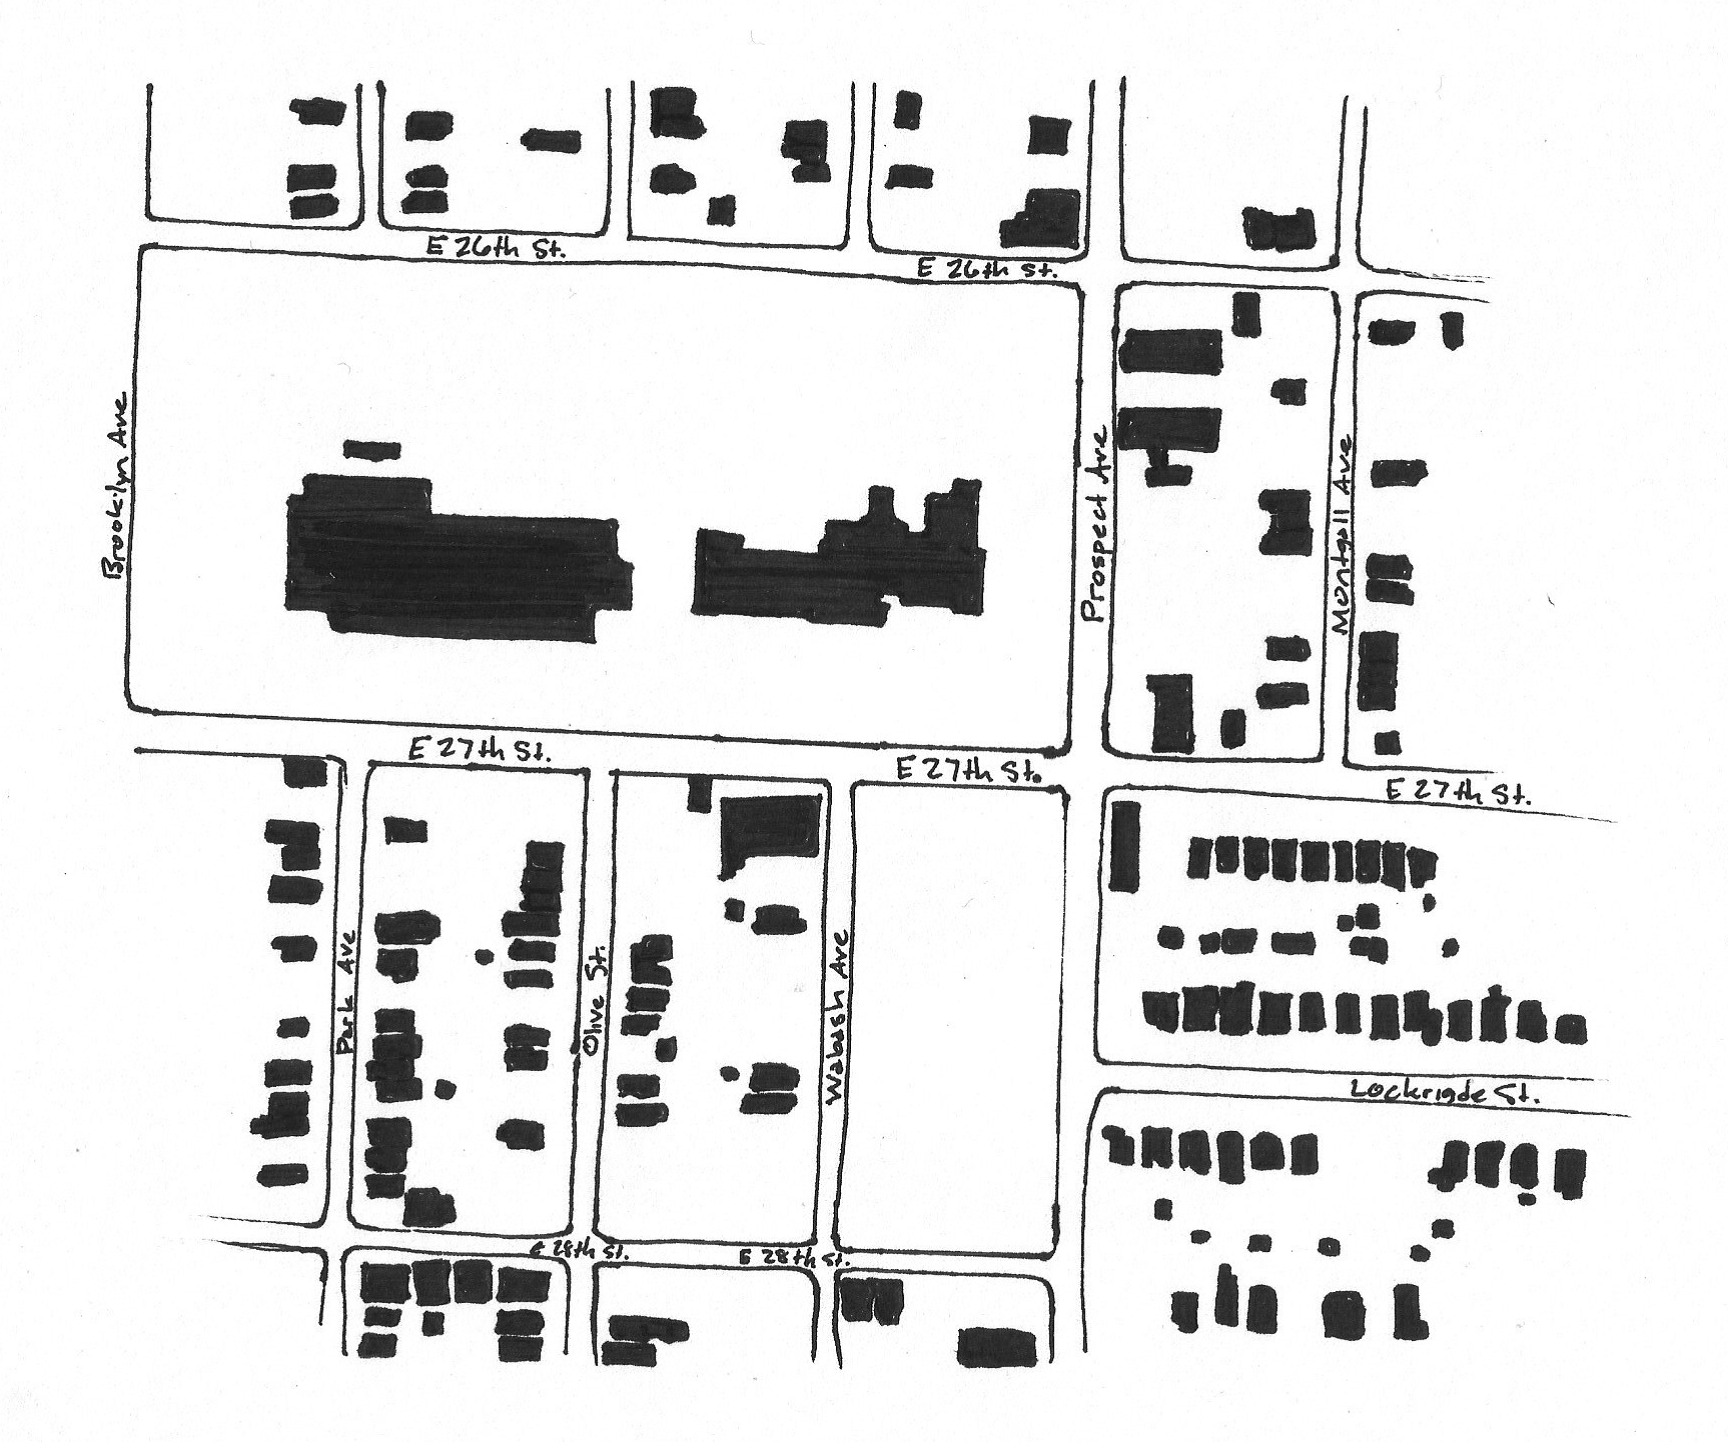
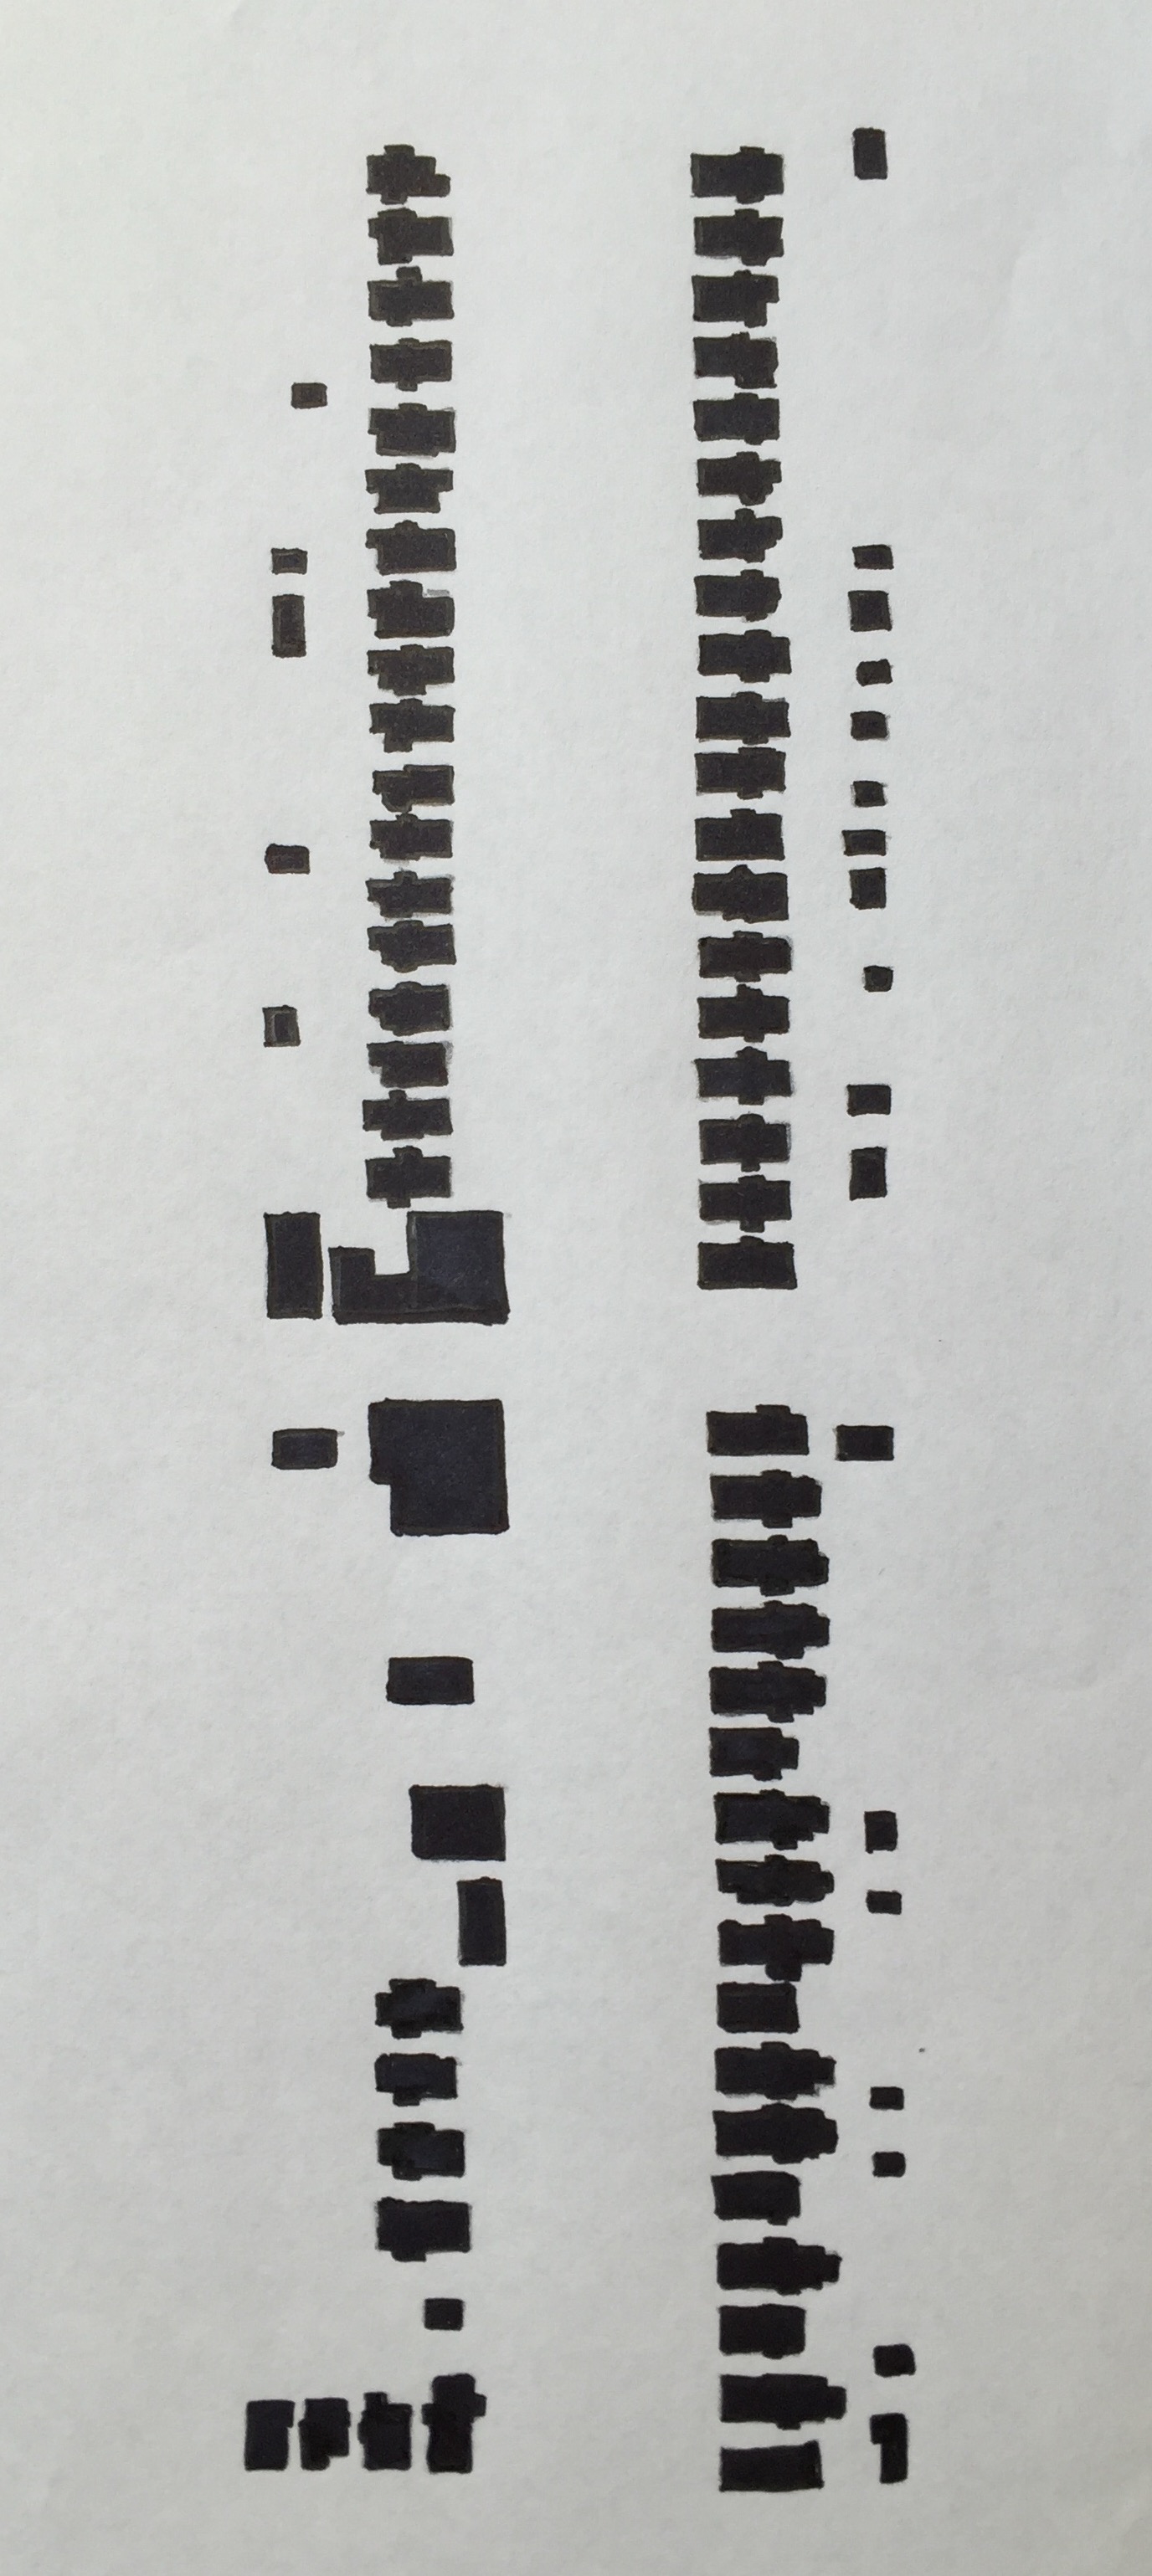
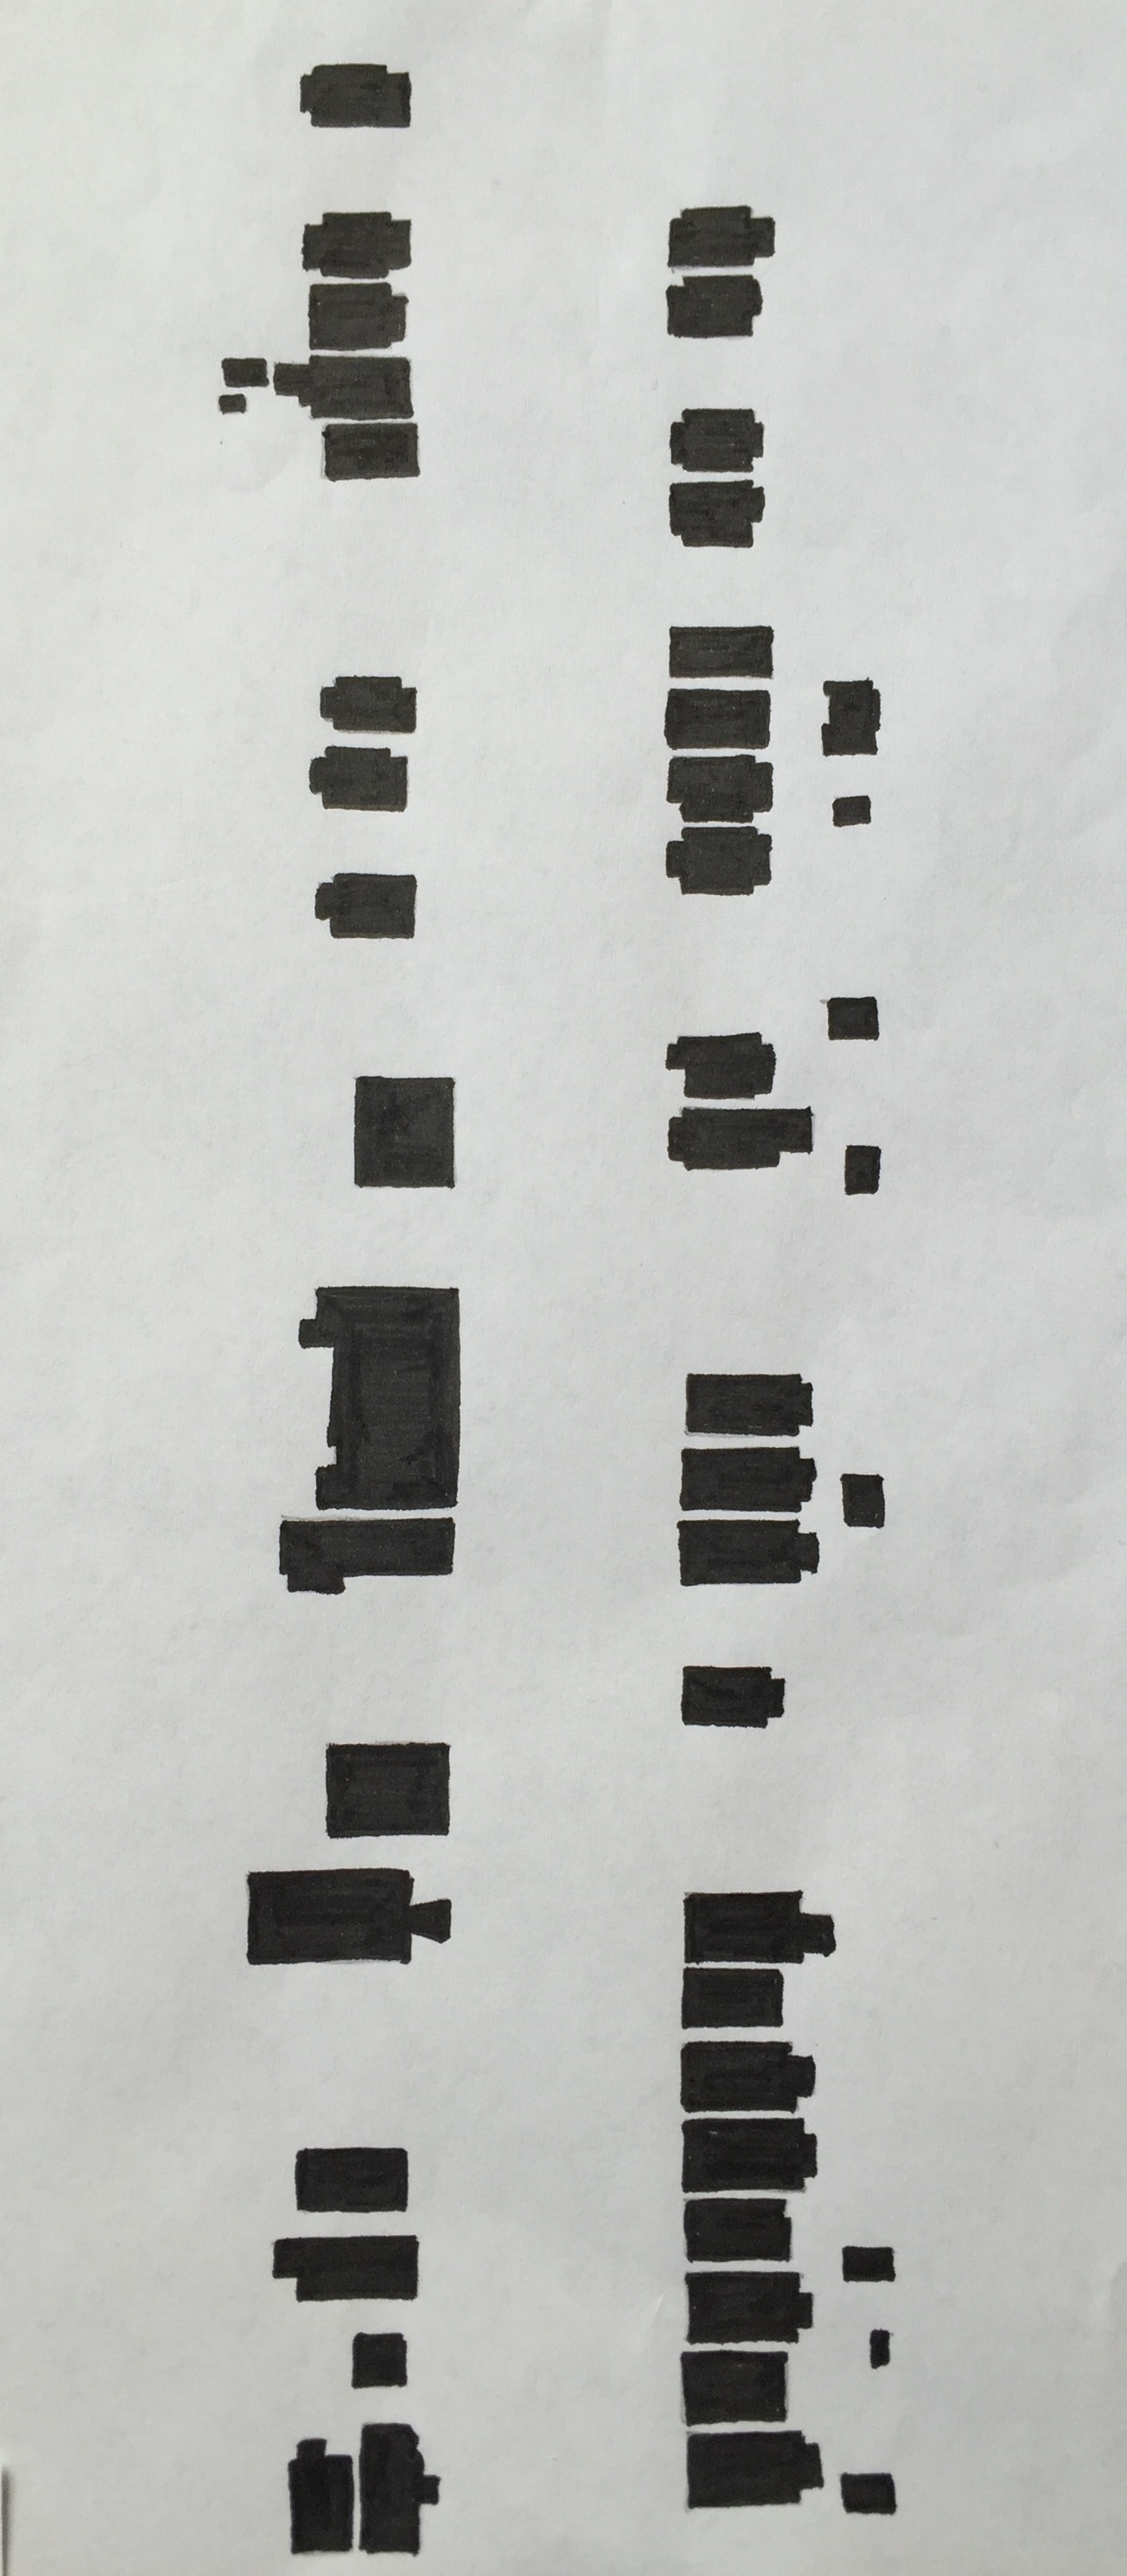
Analysis of Prospect Avenue: E 26th to E 28th
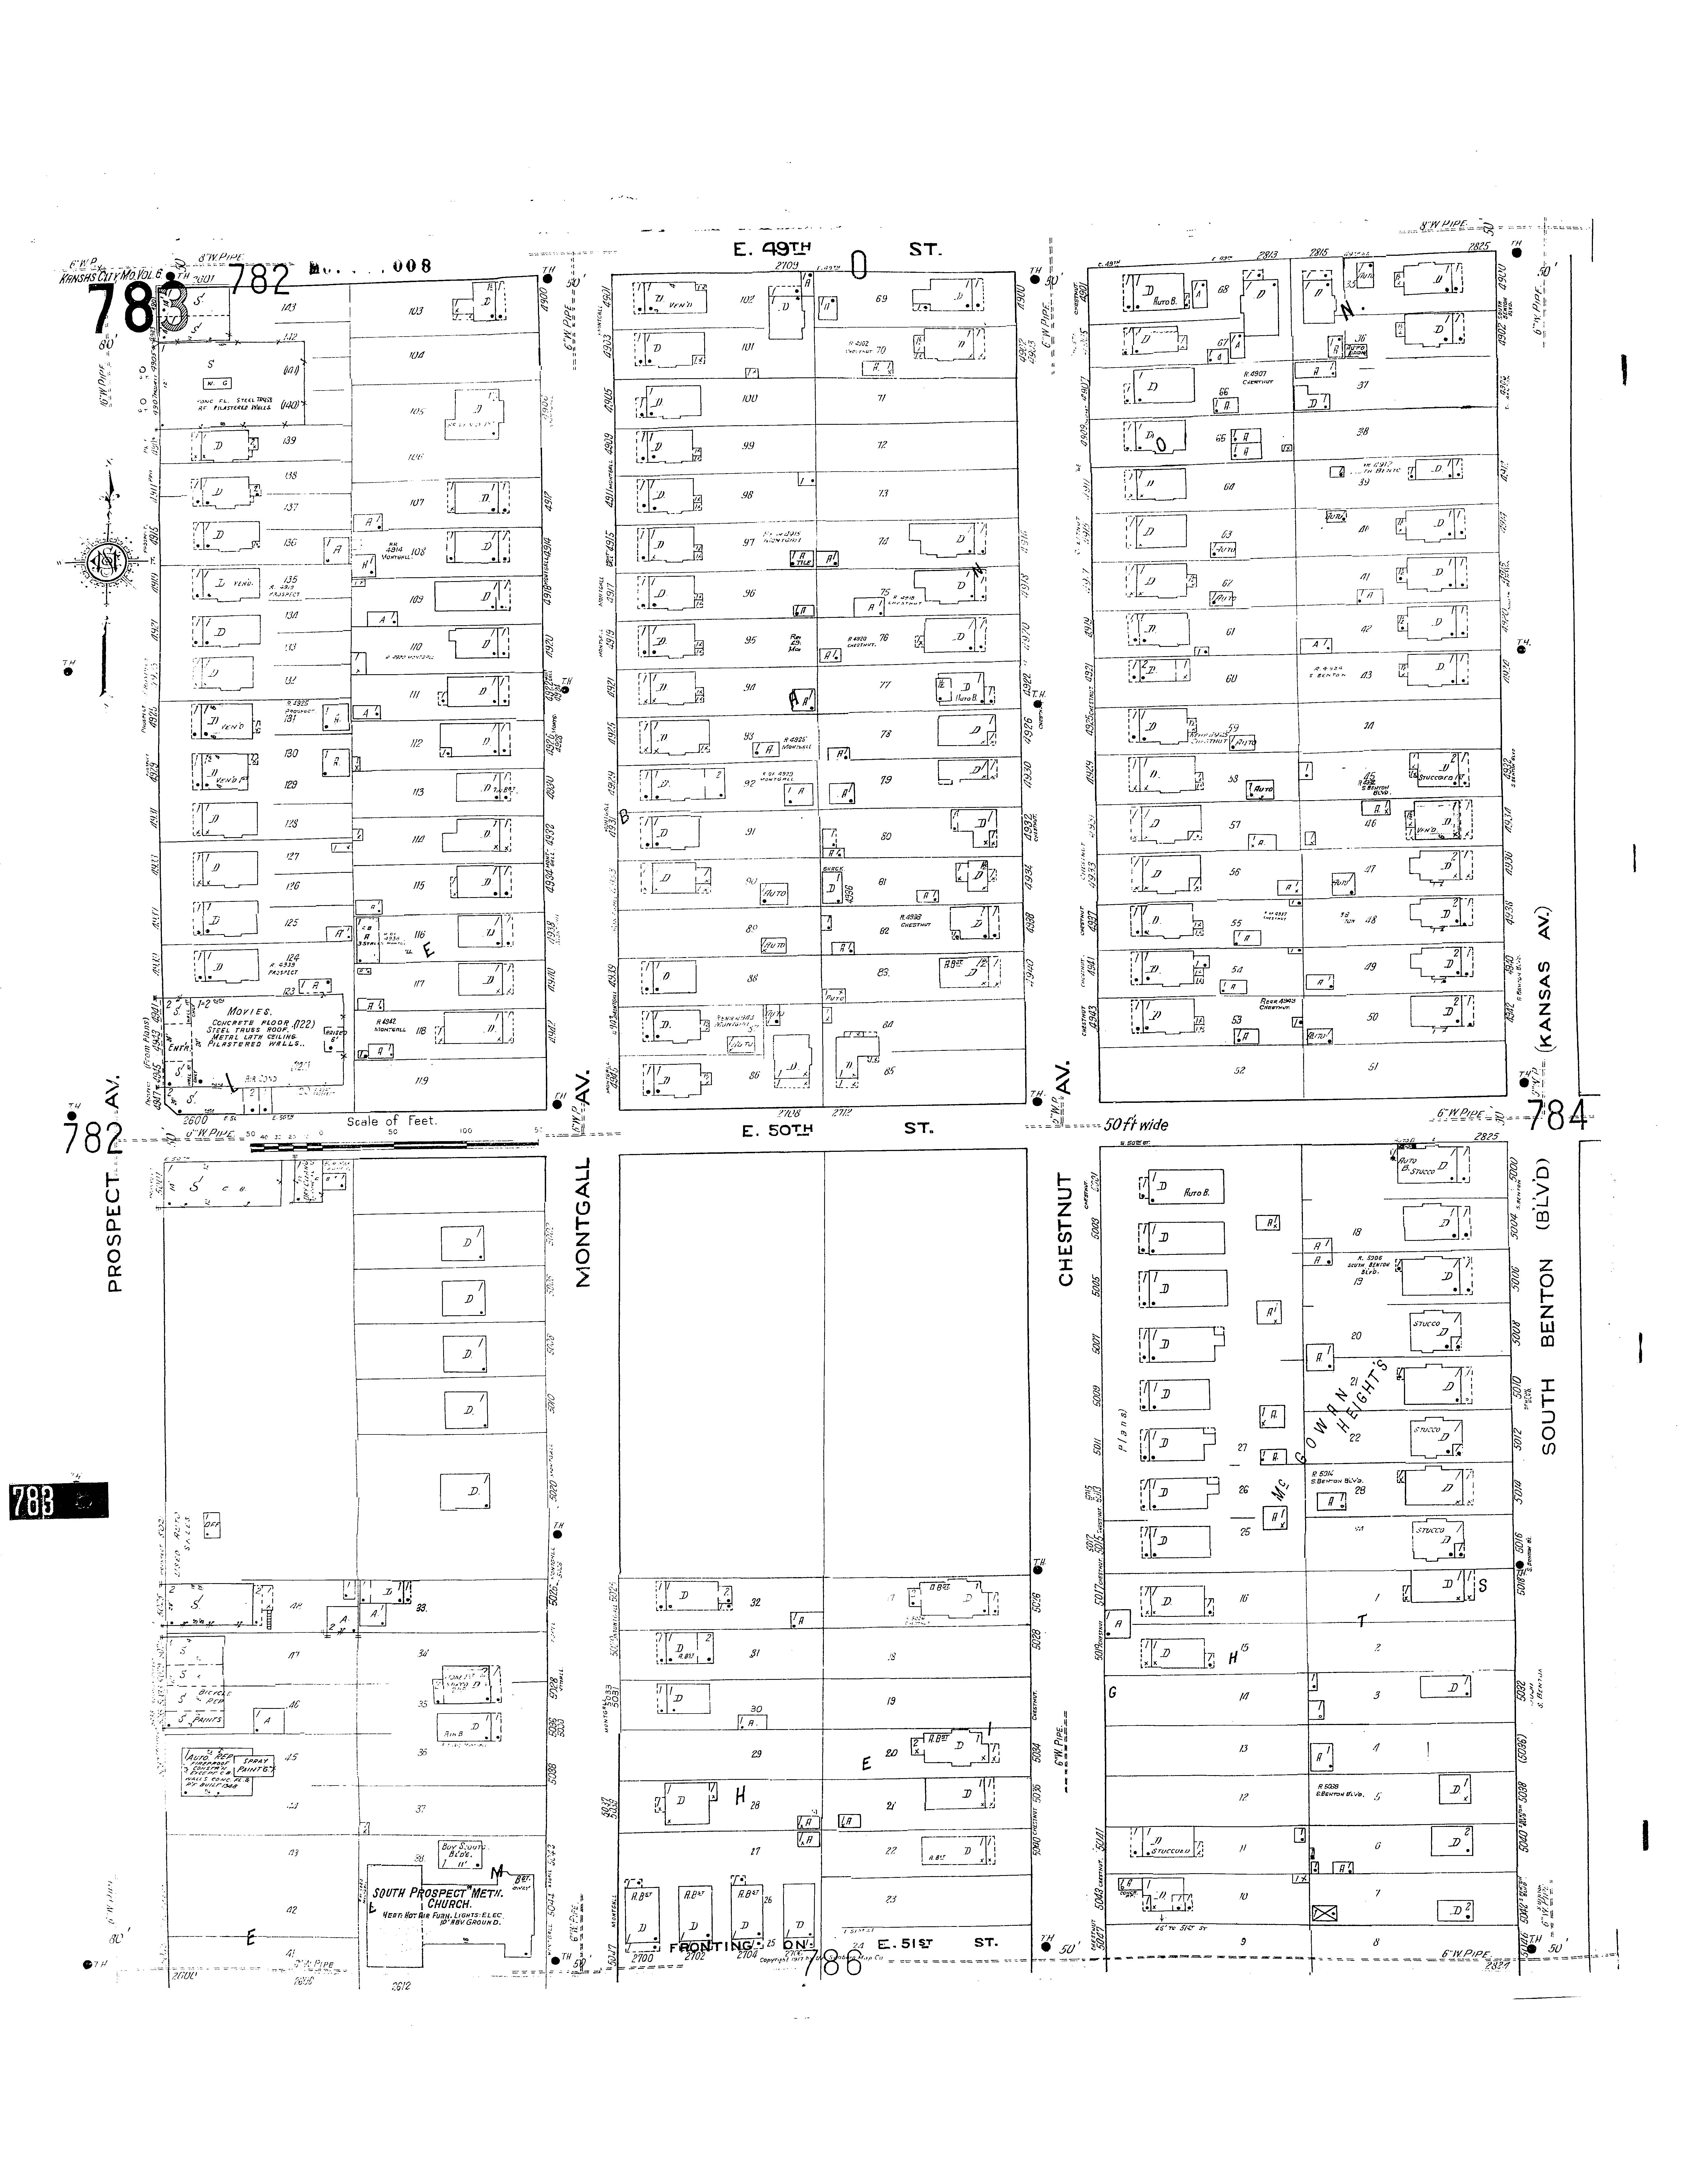
Beginning in the intersection of east 26th and Prospect Avenue, looking at the Digital Sanborn maps from 1885 to 1896, not a lot of the land was at use. In comparison to the maps from 1909, a lot of new structures were built within that time period. There appeared to be at least one structure per parcel. The buildings proximity to the street has seemed to have a decent amount of setback, possibly due to the refinishing of the roads over the years.
When looking at the figure ground diagrams, it is easy to see how much has developed over time since the late 1800’s, and as of recent years. Back when there was not a lot of land being put to use, there was less traffic around the area. And when looking at the most recent figure ground on the right, roads have been annexed in order to fit bigger buildings, like the Kansas City Police Crime Lab.
One of the buildings that has great history in the area, is The Green Duck lounge that is located on 26th and Prospect. This lounge has had made Kansas City history as it was the place in which one of Kansas City’s well known civil rights leader Leon Jordan, was murdered outside the lounge. The Green Duck has had a rough past of having numerous murders happen around the premise, and since then has closed, as the owner, Jimmy Townsend had similarly faced the same fate as what many have at the doors of his business, in late 2015.
As of recent, there has been new construction in the intersection of 27th an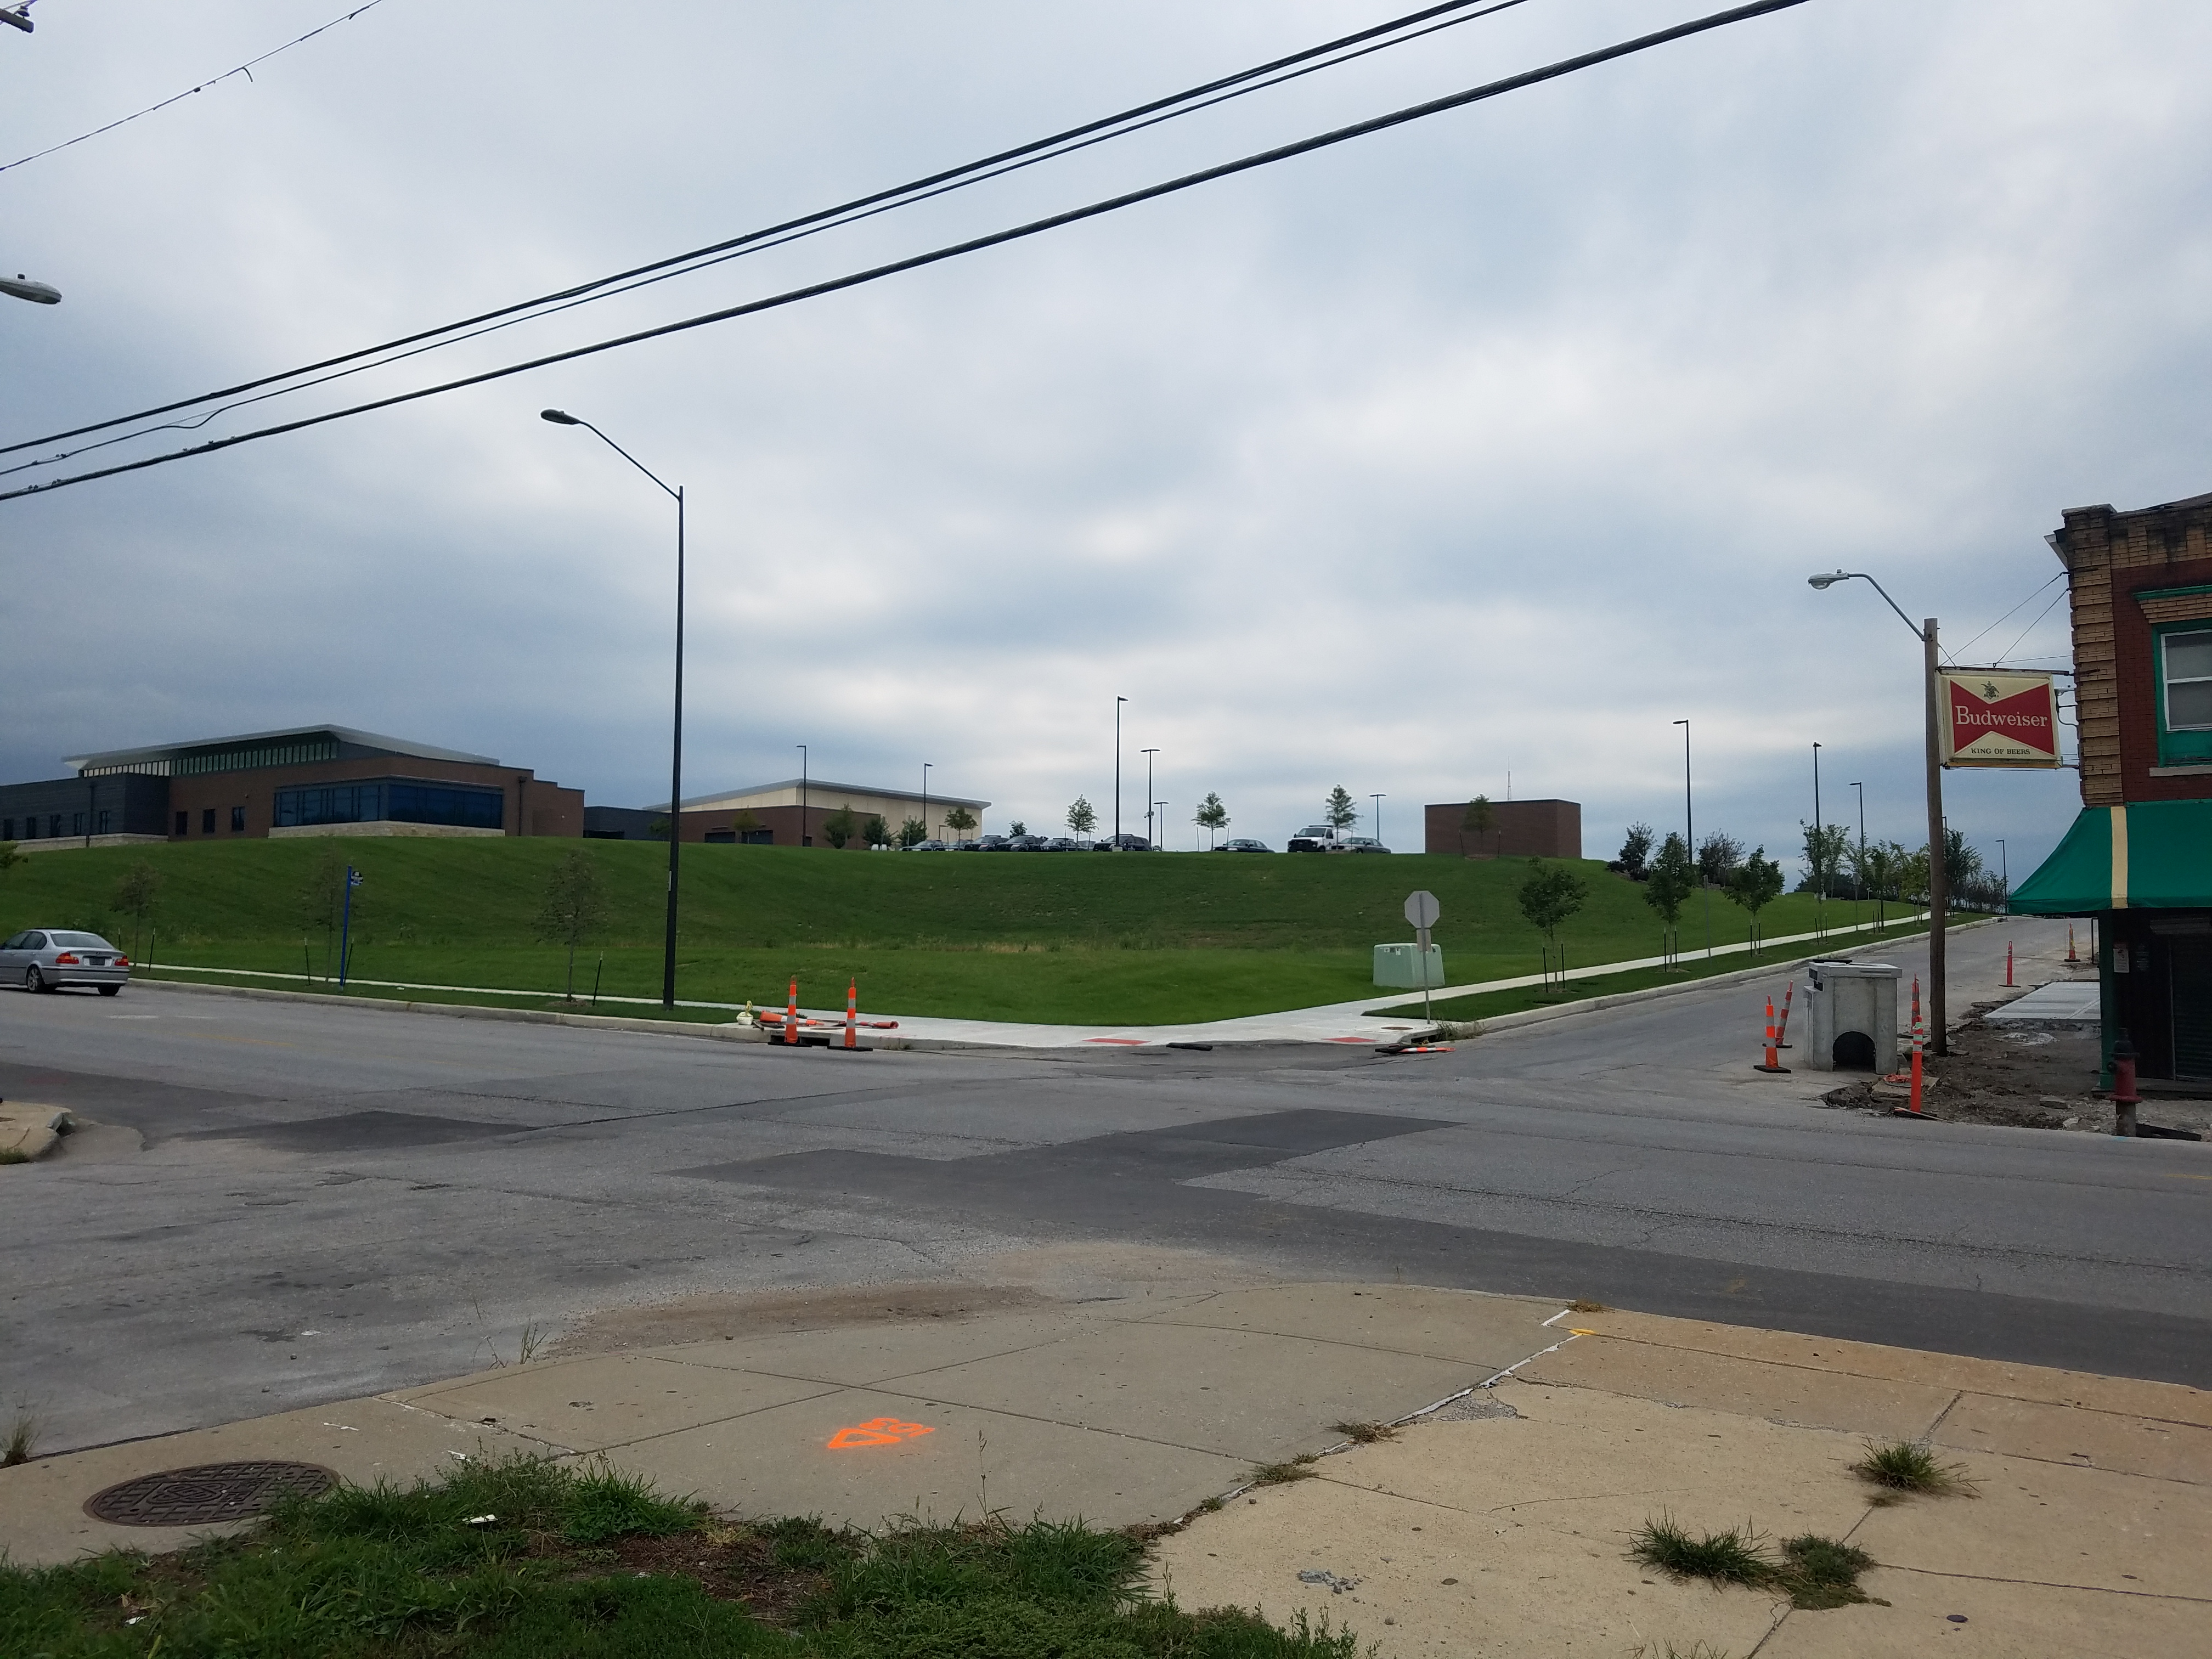 d Prospect. Two new buildings, the Kansas City Police Crime Lab, and one that is currently still being developed. When visiting this area, I was astonished by how the different this area was in comparison to the surrounding area. Of course when new construction is almost finished, there is new grass planted, as well as some greenery to help liven the area. But once you pass the area, east or west, the neighborhoods look as they need to have the same treatment.
Prospect Avenue: 40th Street Through 42nd Street
The majority of the structures on these blocks are single-family residences with a handful of stores and local businesses, including a corner convenience store and a barber shop. The area appears to have maintained its overall intended land-use structure, as shown on the 1917 Sanborn map, but has undergone drastic changes between the issue of the 1951 Sanborn Map and its current physical state.
Between these two time periods, 30 total structures have been demolished, and the lots on which these properties sat remain vacant to this day without any visible efforts in rebuilding. With the 2008 recession and the nationwide housing crisis, the countless number of foreclosures made it easy for owners to abandon neglected structures. After 5 years of tax delinquency, a property is then turned over to the city. Many of them require more repairs than the city has funds to support. Therefore, the city of Kansas City, Missouri has been working tirelessly to raiz these eyesores, which have also been known to house prostitutes, drug dens, and even dead bodies.
Working on a limited amount of funds, the progress is relatively slow given the amount of properties continually turned over to the city. The fact that these particular blocks have seen numerous single efforts to improve their integrity shows great hope for lowering crime rates and improving the livelihood of residents and prosperity of the area.
E 50th and Prospect Historical Development Analysis
E 50th and Prospect Ave
The Eastern block of Prospect Ave from Swope Parkway to 50th Street is predominately covered by Highway 71 except for the corner of Prospect Ave and Swope Parkway where a Shell gas station exist, North of the 71 Hwy overpass. This link provides a visual for comparison between 1950 and present day. 2016 KCMO. Based on the 1917 and 1950 Sanborn Maps Swope parkway to E 50th Street had a full block of commercial buildings and homes till the construction of the highway. Now the space feels mostly empty, noisy from Hwy 71 traffic, with moderately maintained green space and a bus stop. Additional lighting could be provided under the overpass to give a sense of safety to pedestrians. The Western side of Prospect Ave could be developed into urban gardens, and sound barriers can be constructed along the highway to reduce noise.
Along Prospect Avenue from Truman Road to 18th Street
Today the land from Truman road to 18th street along Prospect Avenue is an industrial business area. It is no longer a residential neighborhood as it was in 1909. Back in time this area was full of medium sized residential homes as well as Woolf Brothers Steam Laundry company . Some of the homes in this area had horse stables behind them. There were also alleys behind the buildings enabling access to the stables for the horses and carriages .The Sanborn maps in figure 1 and 2 (1909 pp. 309,322) show what the area looked like in 1909. There are 13 empty lots with the majority of structures being homes.

( 1909 Sanborn Vol. 3 pp. 309)

( 1909 Sanborn Vol. 3 pp. 322)
Today the area is much different and is composed mainly of businesses. Currently the businesses in this area are Indicia, a branding firm,Uplift, an organization that helps the homeless,Blue Valley Industries, for the mentally disabled,MCC faculty services and Heartland Department for Behavioral Change. ,The only building that is still standing from 1909 is the former Woolf Brothers Steam Laundry, today it is used by Walker Towel and Uniform Service Inc. (figure 2)
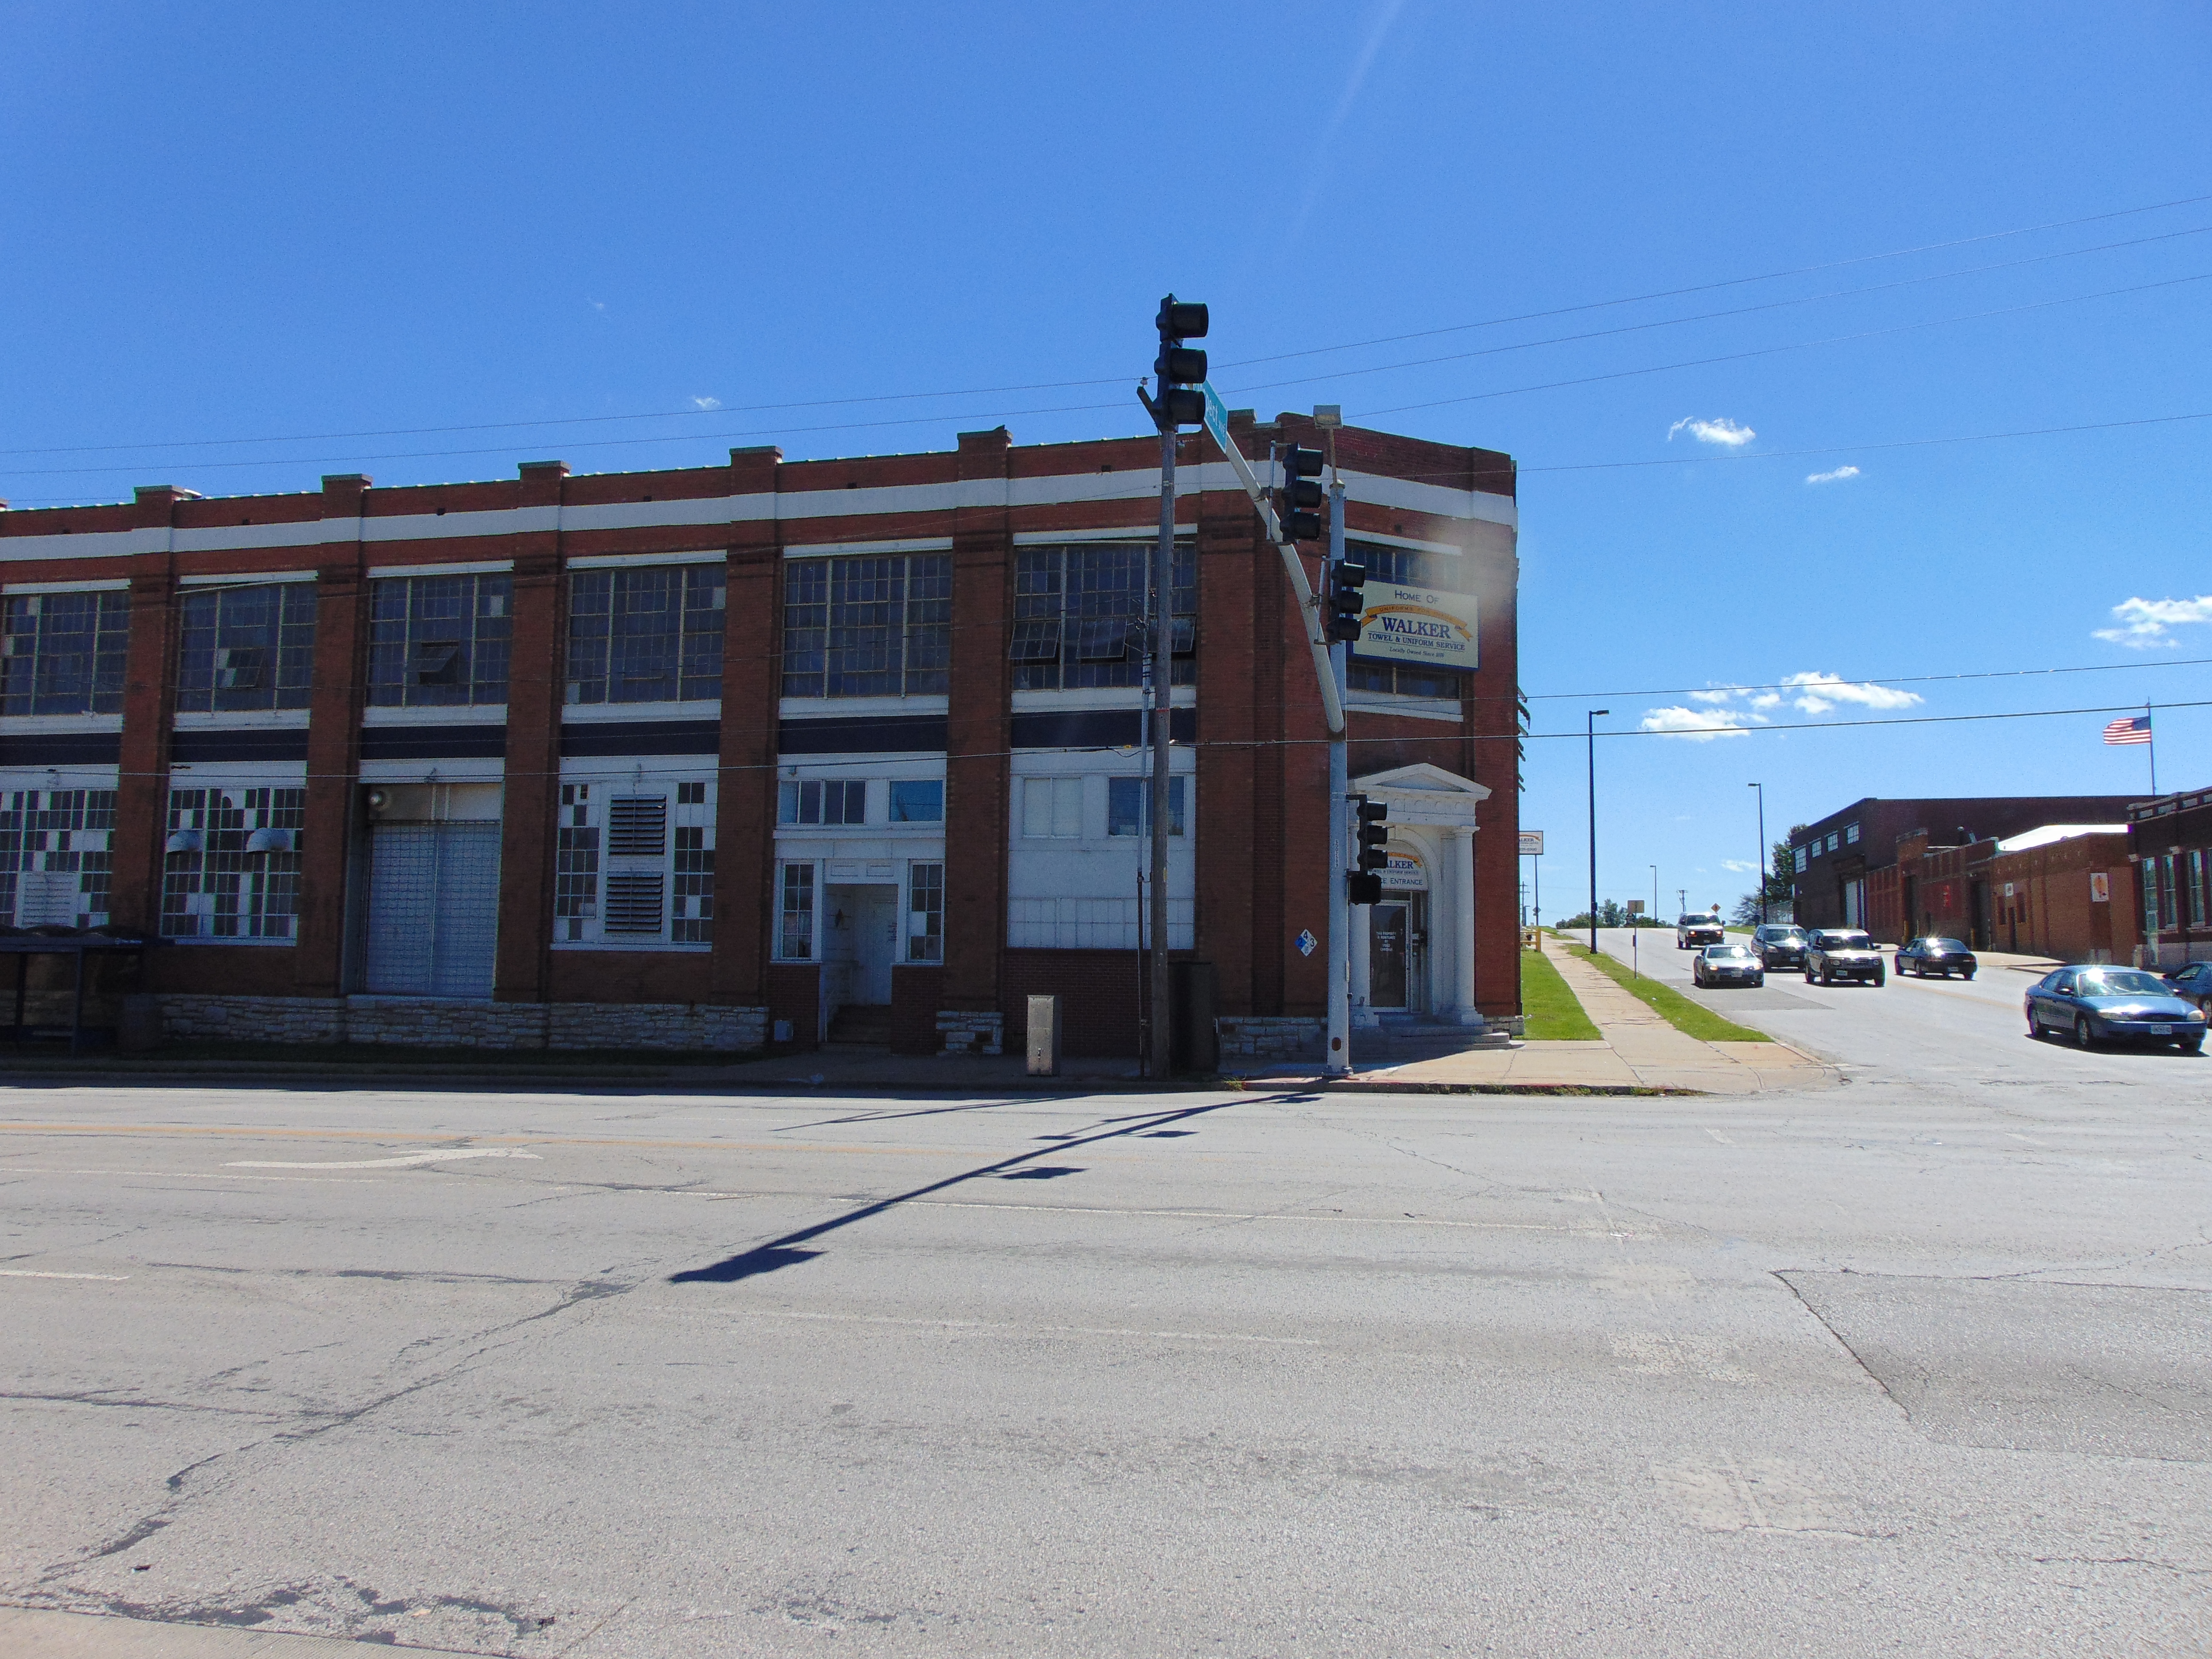
The blocks along Prospect Avenue from Truman road to 18th street have changed from a budding residential area to an industrial business section of Kansas City . After researching the history of the buildings in this area it has made me wonder what life would have been like living along Prospect in 1909.
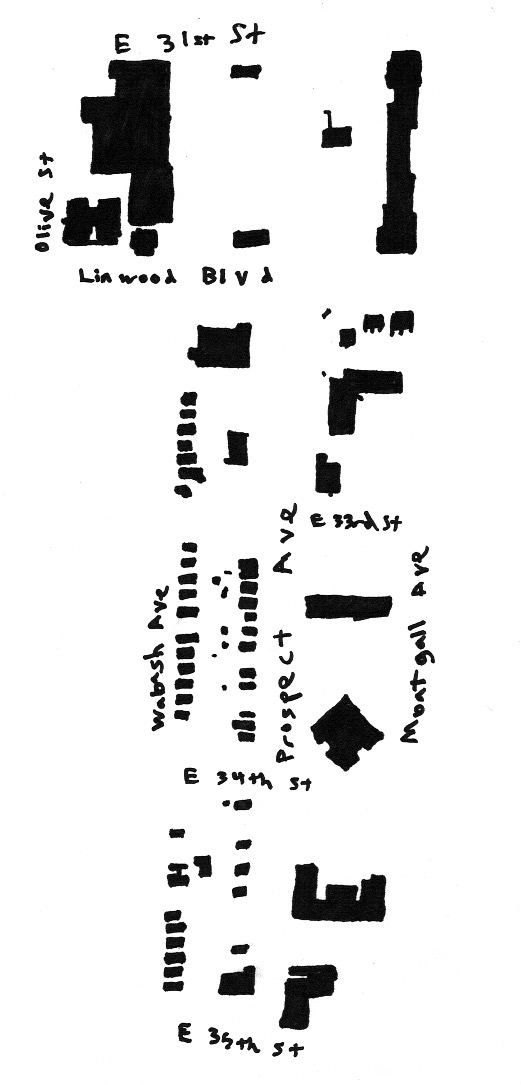
Prospect Avenue From Linwood Boulevard to E 34th Street
Prospect Avenue From Linwood Boulevard to E 34th Street
My blocks on Prospect Avenue extended from Linwood Boulevard to East 34th Street. In the present, there are many defining features that describe my blocks. There are heavy-duty metal gates that fence in large areas around apartment buildings and businesses. These buildings are concentrated on the East and West sides of Prospect Avenue from Linwood Boulevard to East 33rd Street as well as the East side of Prospect Avenue from East 33rd Street to East 34th Street. The West side of Prospect Avenue from East East 33rd Street to East 34th Street is all single family residential houses. Many of these homes are relatively close tother compared to others on the block. A couple houses were vacant, with one of the vacant buildings being labeled as a “dangerous building” A large portion of the single family homes were similar in style to a shirtwaist house.
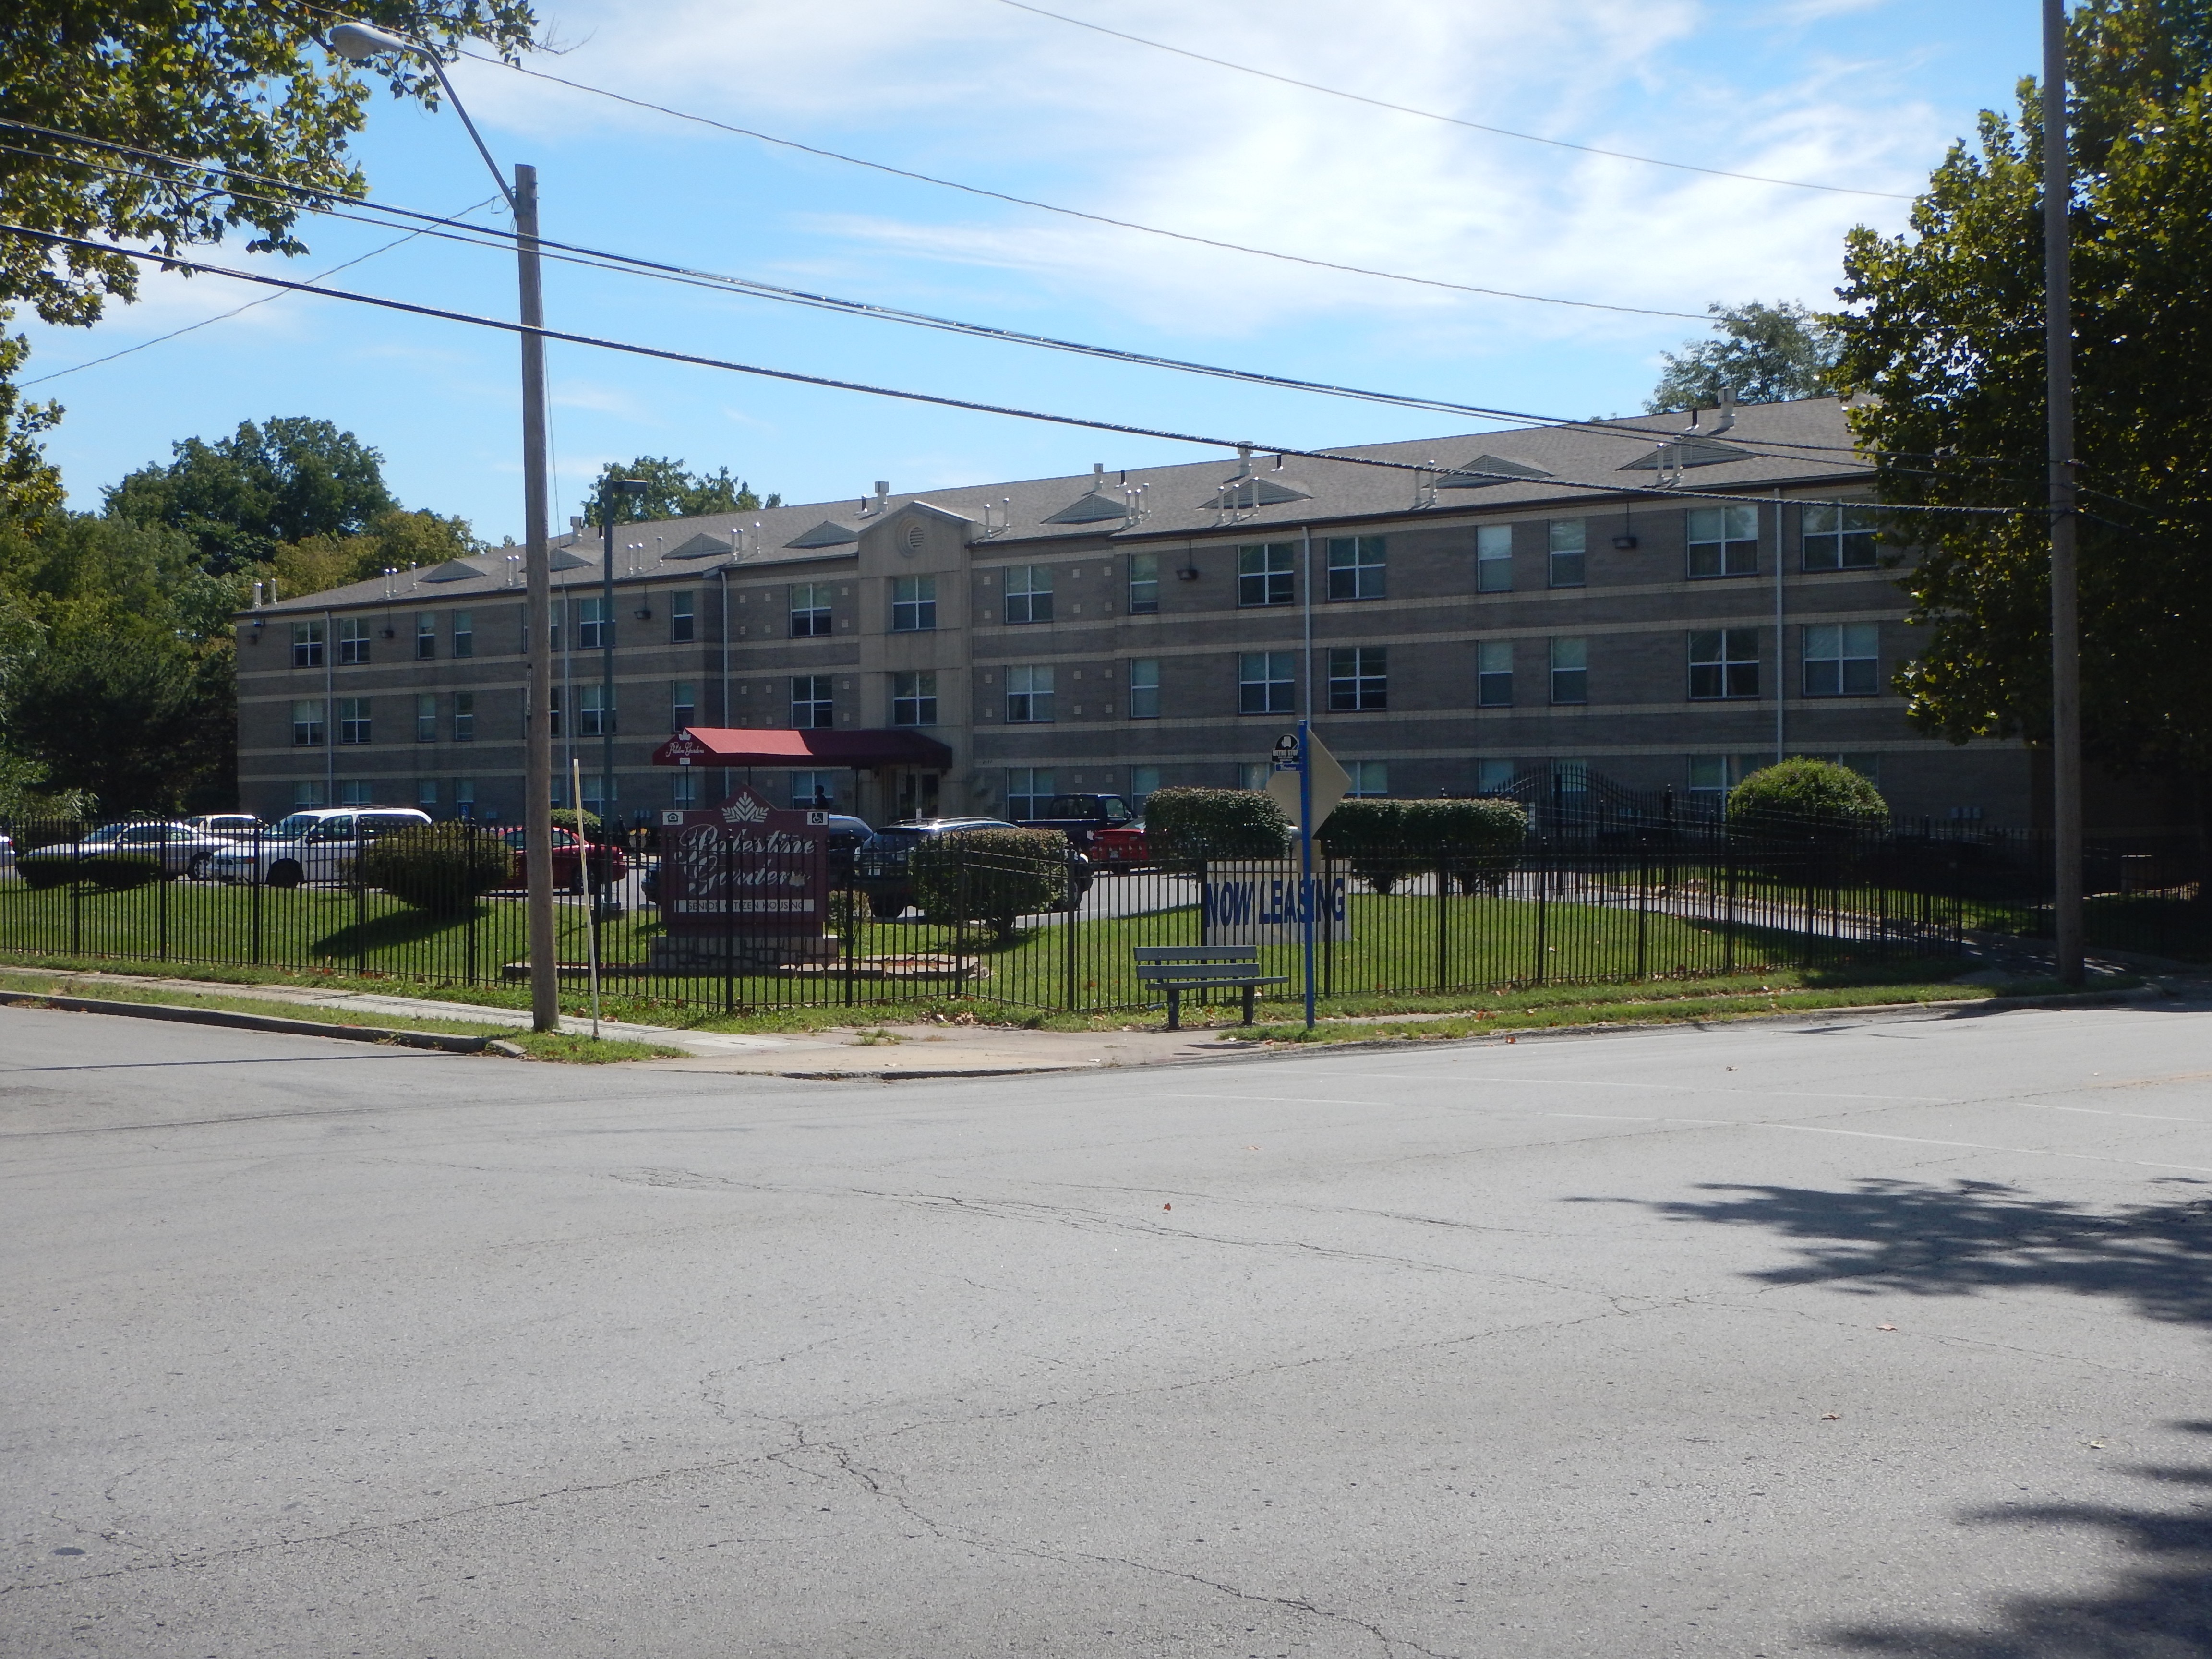
Gates Around Apartment Complex
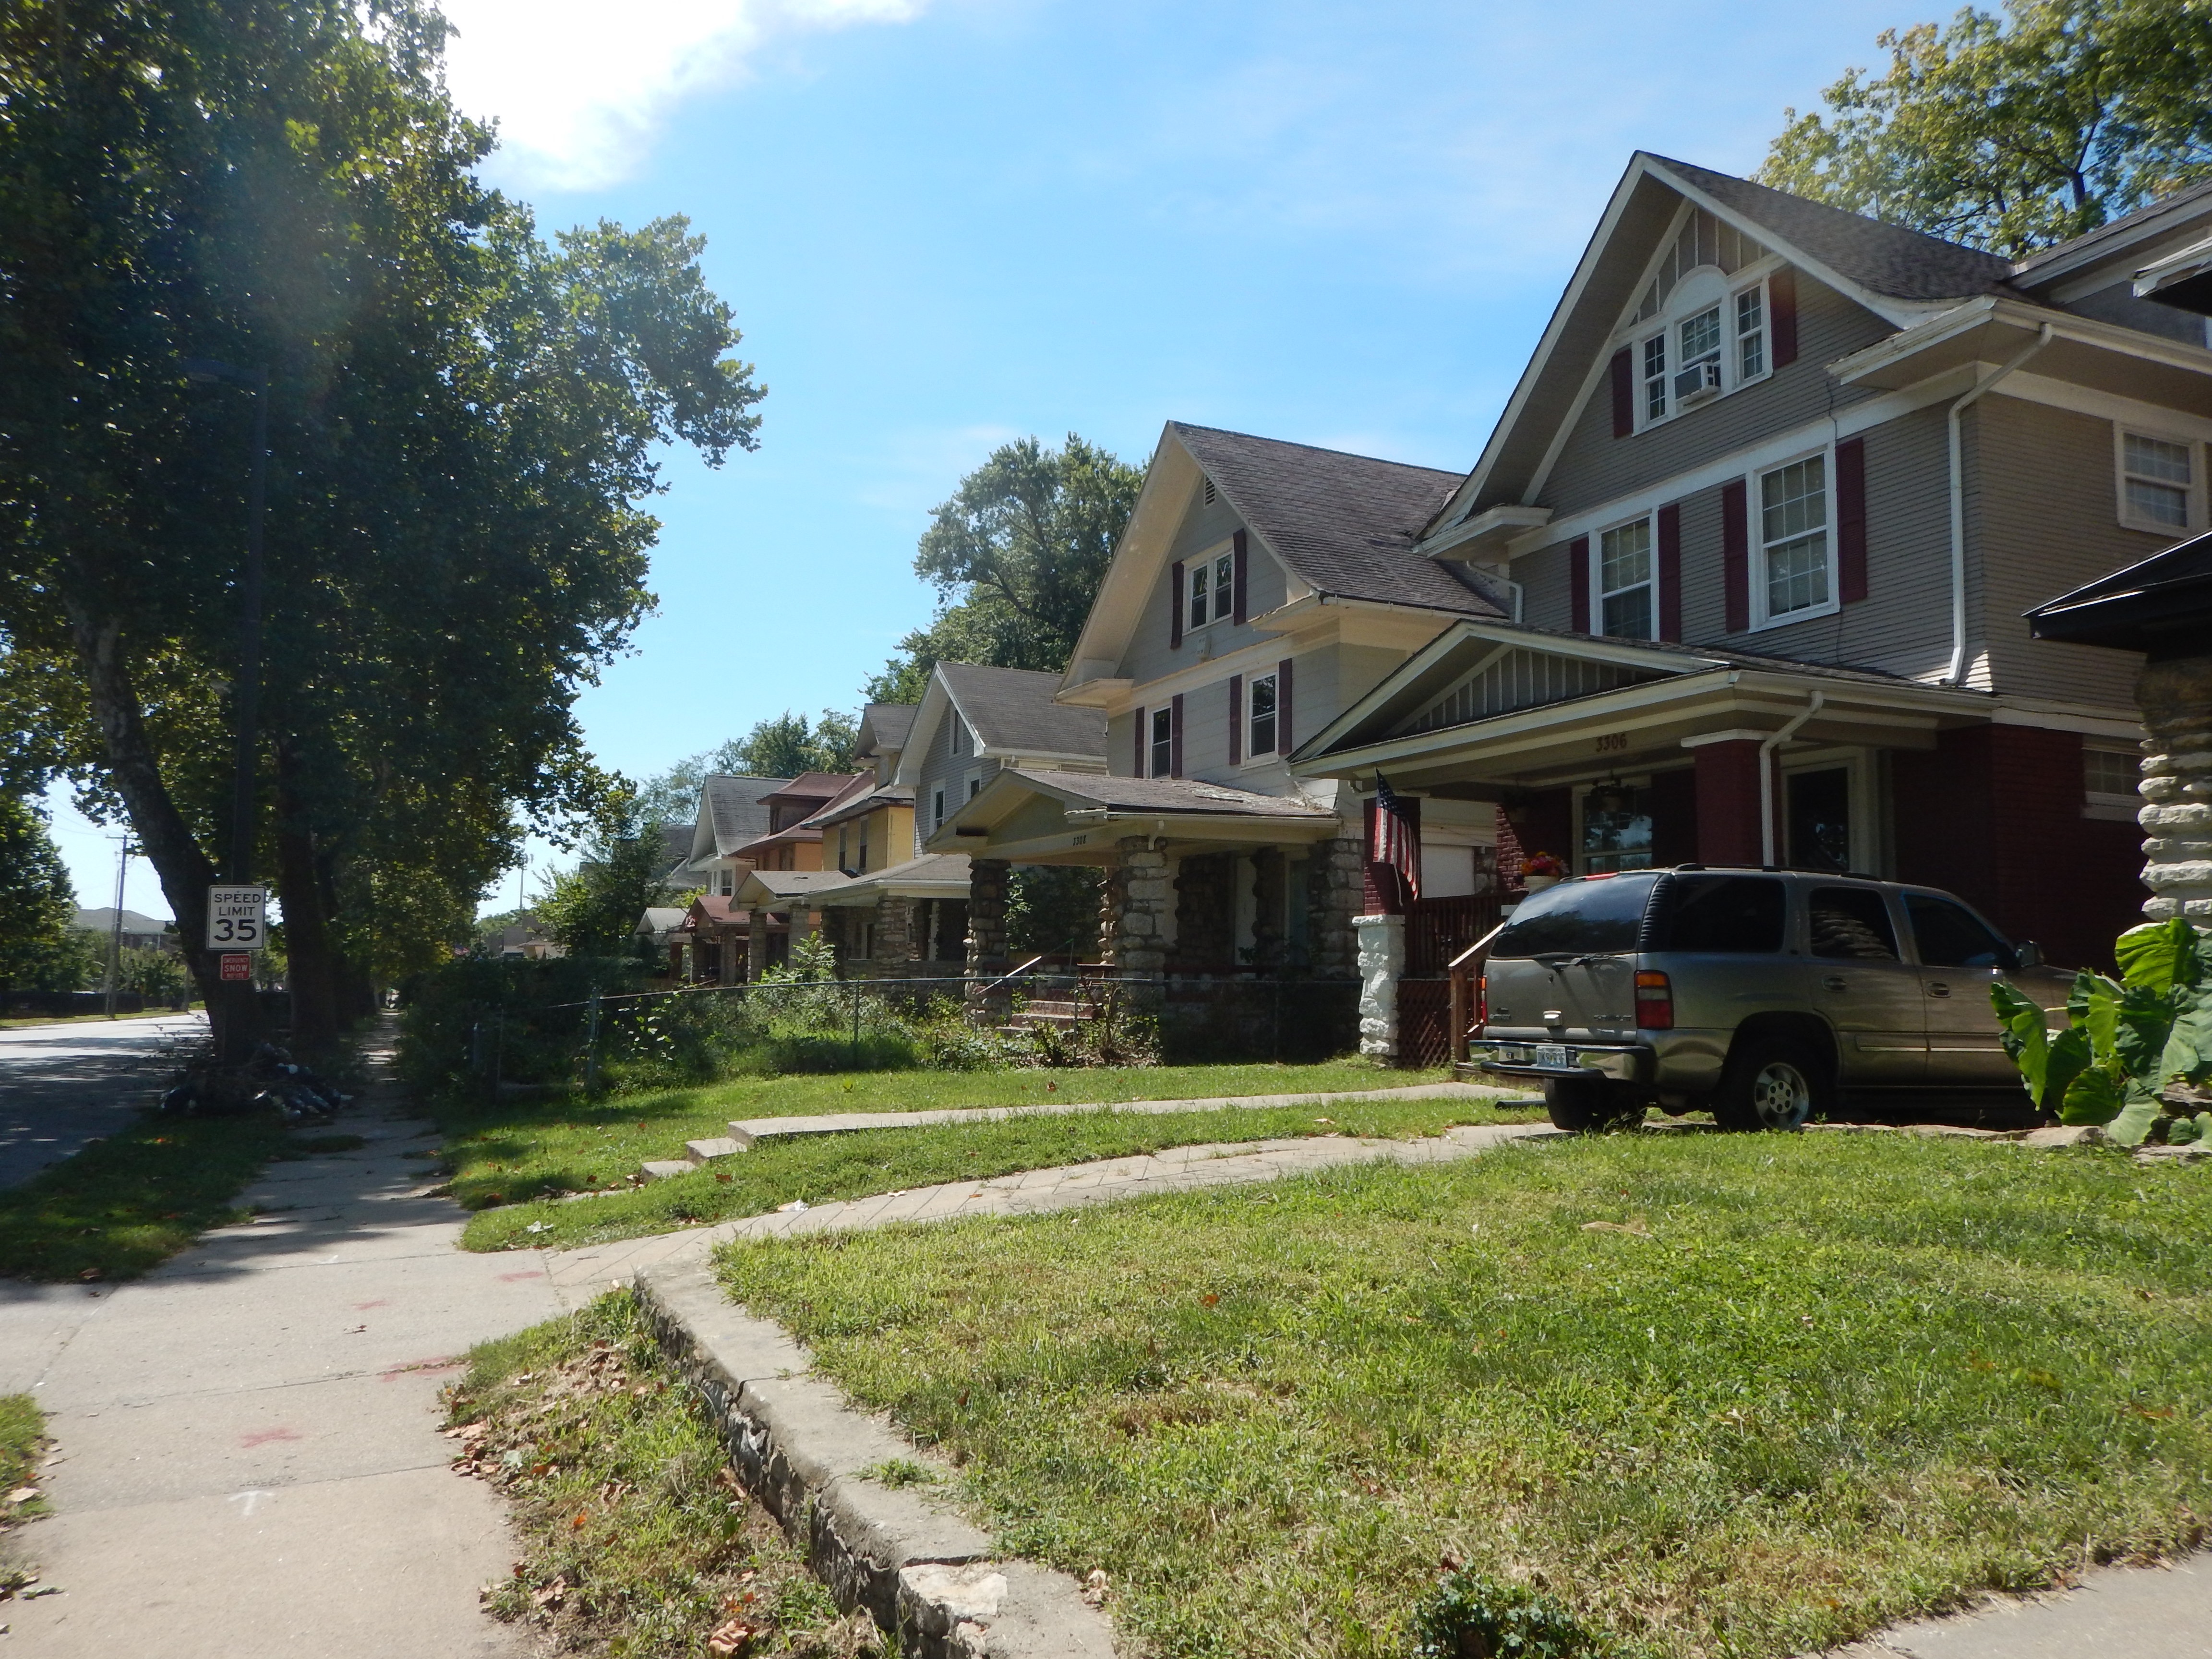
Shirtwaist Houses
Before 1895, my blocks were outside of city limits at the edge of development. By 1909, the area was filling up, primarily with residential development with the exception of two greenhouses. The residences were primarily single family dwellings and were not nearly as dense as they are today. More buildings had been built by 1925. More residences had been built as well as a few businesses. By 1951, a few more residences had been built, but this also marks the appearance of smaller secondary structures behind some of the residences. This time period is the first evidence in my blocks where structures were demolished and replaced with drastically different buildings. Namely, the two greenhouses and a few other buildings on that block were torn down and replaced. Now, in 2016, the landscape has been radically changed. The northern and eastern sections of my blocks many buildings were torn down and replaced with businesses, apartment buildings, and the non-profit Palestine Senior Activity Center. For example, most of the residences in the western portion of the block from Linwood Boulevard to East 33rd Street were torn down and replaced with a Walgreens and an Auto Zone. There are still single family dwelling on the western portion of Prospect Avenue from East 33rd Street to East 34th Street, but few of these appear to have been demolished based on comparing the figure grounds for this time period to that of previous time periods.
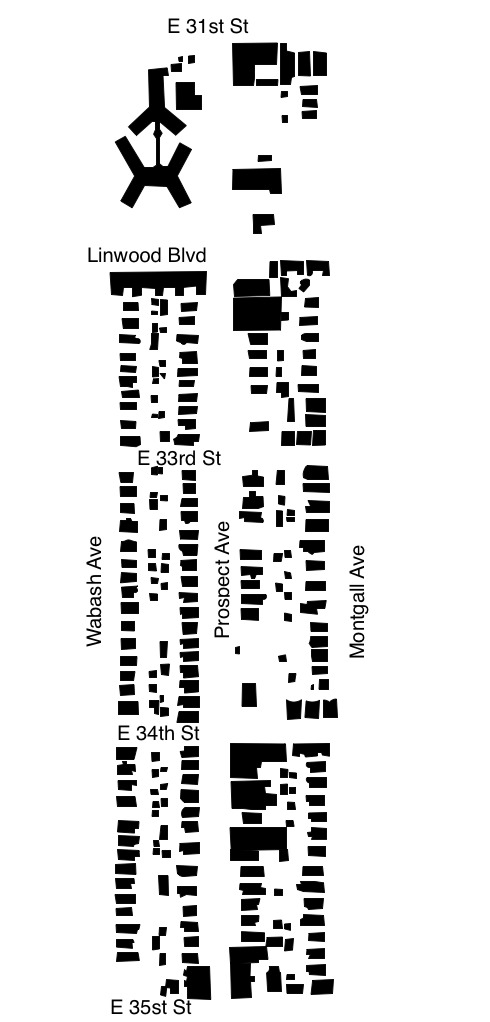
1951
2016
One of the main changes over time that I noticed in my blocks was the change from being primarily residential to being primarily business oriented. Almost all of the buildings were residential, either apartment complexes or single family dwellings when development was first noted in 1909. Now, however, the areas once dominated by residences are now replaced with business buildings. For example, the Walgreens mentioned above is in the previous location of a large apartment complex that lasted until sometime between 1951 and 2016. Thus, there have been many changes in zoning in my blocks over time.
Prospect Block Study: Amie Street to Lexington Avenue
The blocks between Amie and Lexington along Prospect are entirely residential, aside from Garfield Elementary School and a small church. Many of the original dwellings in this area were expansive single family homes, featuring Victorian architecture. The neighborhood that these blocks are contained within, Pendleton Heights, is often referred to as Kansas City’s First Suburb.
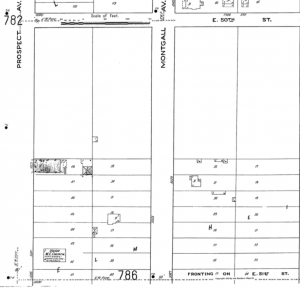
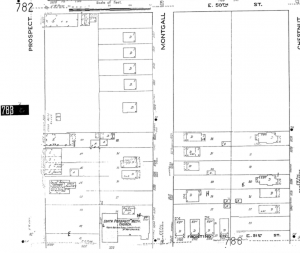
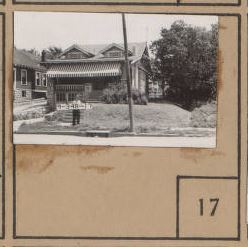
The era that saw the most structural residential change was between 1909-1925. Larger lots were divided to accommodate housing for an influx of immigrants and soldiers returning from WWI. This increase in density is reflected in the following two figures, a section of the Sanborn Map from 1909(Figure 1), and a section of the Kansas City Atlas, 1925 (Figure 2). Note the multi family structures, just south of Amie Street built on an empty expanse. This apartment complex, Amie Court remains today. (Figure 3).


Figure 3
Analysis of 36th Street to 38th Street
For some, its just a rundown, unsafe, unhealthy portion of Kansas City that most people try to avoid to the best of their abilities. To others, its a historical place that was lively, beautiful, and friendly. The difference between which is time.
What once used to be a dense, residential and small business area, is now a vacant, overgrown sector of prospect that should be highly avoided at night time. in the photos below (Left: a photo of the intersection of 37th Street and Prospect. Right: Sanborn map of 1951) you can noticeably tell the difference between the densely packed and interactive layout of 1951, and the vacant, overgrown intersection it is now. The only thing that is still functioning in the picture below on the left is the Liberty Auto Sales and repair which has stood the test of time. After glancing at these images and the amount of decay that has occurred, it leads one to wish to see this section of Prospect in its heydays.
Historical Analysis Project.
East 60th / East 62nd and Prospect
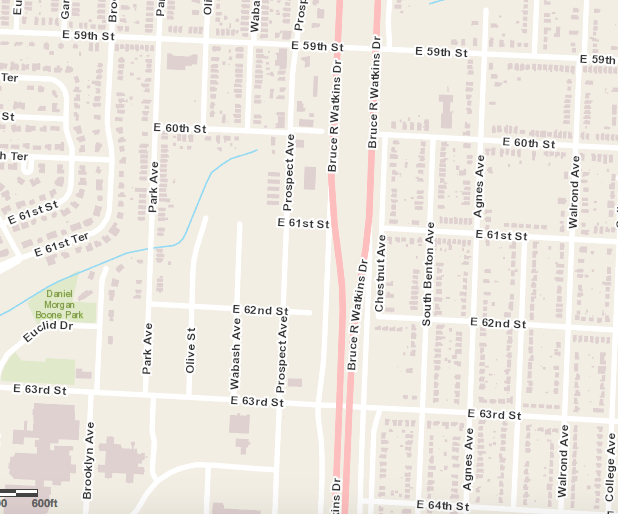
For this project we were assigned the task of analyzing historical Sanborn maps and other data sources to observe how a particular assigned area in Kansas City has progressed over the years. Our observations would include things like changes in building density, road network changes, demographic changes, and any other changes in the assigned block group’s character. The particular area in Kansas City that I was assigned was the midtown Prospect boulevard area at East 60th street and East 62nd street.
At first glance of the site my initial impression of the site was that the area has seen a huge decline in population and that the area had drastically deteriorated. I formed this assumption because of the unkempt vegetation and the closed, boarded-up commercial buildings on the corner of Prospect and East 60th street as you can see in Figure 1.
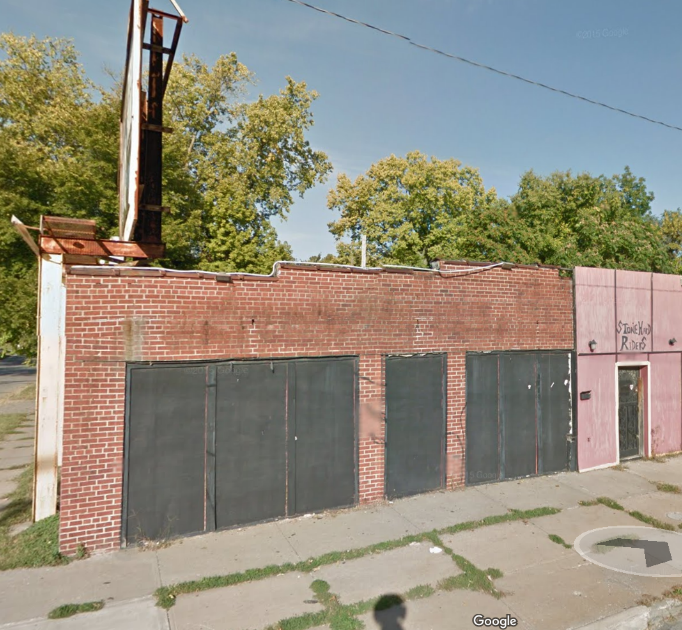
Figure 1
Another surface level observation that I made was that there must have been a huge drop in density as there were many empty residential lots that still have driveways leading to the property from the streets but with no built structures there.
Digging a little deeper beyond the surface level data, I found some Sanborn maps that confirmed that there were actually houses in those now empty lots as you see in Figure 2 which is a Sanborn map from 1939.
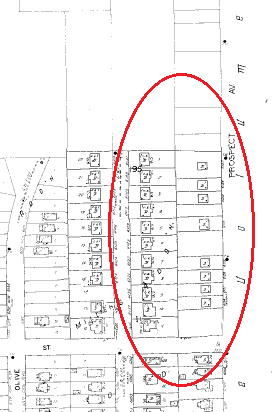
Figure 2
In addition, doing some exploring in Google Earth Pro revealed that there was density in that immediate area up to as late as 205. After that you start to notice the demolition of the neighborhood. That is strange to me as this area of Kansas City isn’t extremely old or anything. It is in fact a little newer than many of the historical areas of Kansas City closer to the urban core that still stand to this day. I found this out by the lack of Sanborn map data prior to year 1939.
The only other year I was able to find Sanborn map data for was 1950. That particular map is almost identical to the map from year 1939. I infer this is because the bulk of change in the neighborhood didn’t happen until fairly recently. Around those two years is when the neighborhood was most like still new to the metropolitan area and things were still stable.
In summation of all the interesting data that I found for my neighborhood, I found that the East 60th and East 62nd blocks of Prospect Avenue have seen a drastic decline in population since 1939 when density in the neighborhood and Kansas City in general was more prevalent. Not the area is largely vacant and conditions similar of those in poverty.
Meyer Boulevard to 68th Street
Being quite far south compared to the Kansas City Proper, these blocks lack information about development in 1895 and 1909. Sanborn maps show the intention to develop this area in 1917, and by 1925 Prospect has been zoned commercial (where is remains today) and residences are popping up in the surroundings. These blocks continue to expand and develop over the next few decades. When the automobile transitions to primary transportation, this area of Prospect accommodates by widening the road. Growth spirals downward with the implementation of 71 Highway. Throughout the 1990’s homes are demolished and replaced with the highway. Since, there has been a continuous loss of population and density, leaving these blocks as primarily vacant land, automotive shops, and fast food restaurants. A figure ground study is drawn below to depict the low density. That isn’t to imply the area isn’t charming. Quaint commercial architecture still stands off Prospect. The Meyer boulevard transforms into a well designed bridge that carries cars, pedestrians, and cyclists safely above the highway. The Research College of Nursing provides an opportunity for steady pedestrian traffic.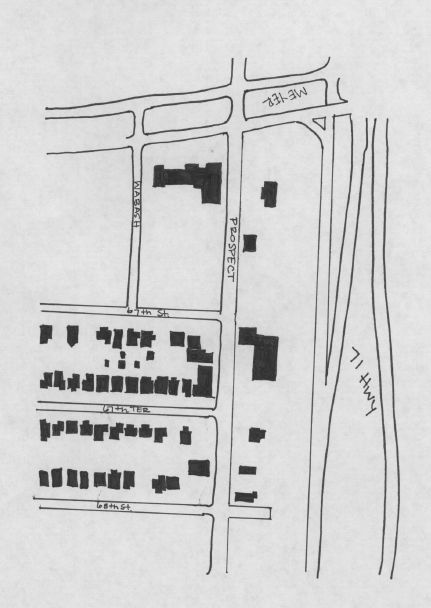
Historical Analysis of 63rd and E. Meyer Blvd
The area along Prospect that lies between 63rd and E. Meyer Blvd is dominated by the HCA Research Hospital which was established in 1963. When researching the maps and atlases it can be said that the block seemed to remain empty until the hospital was built.
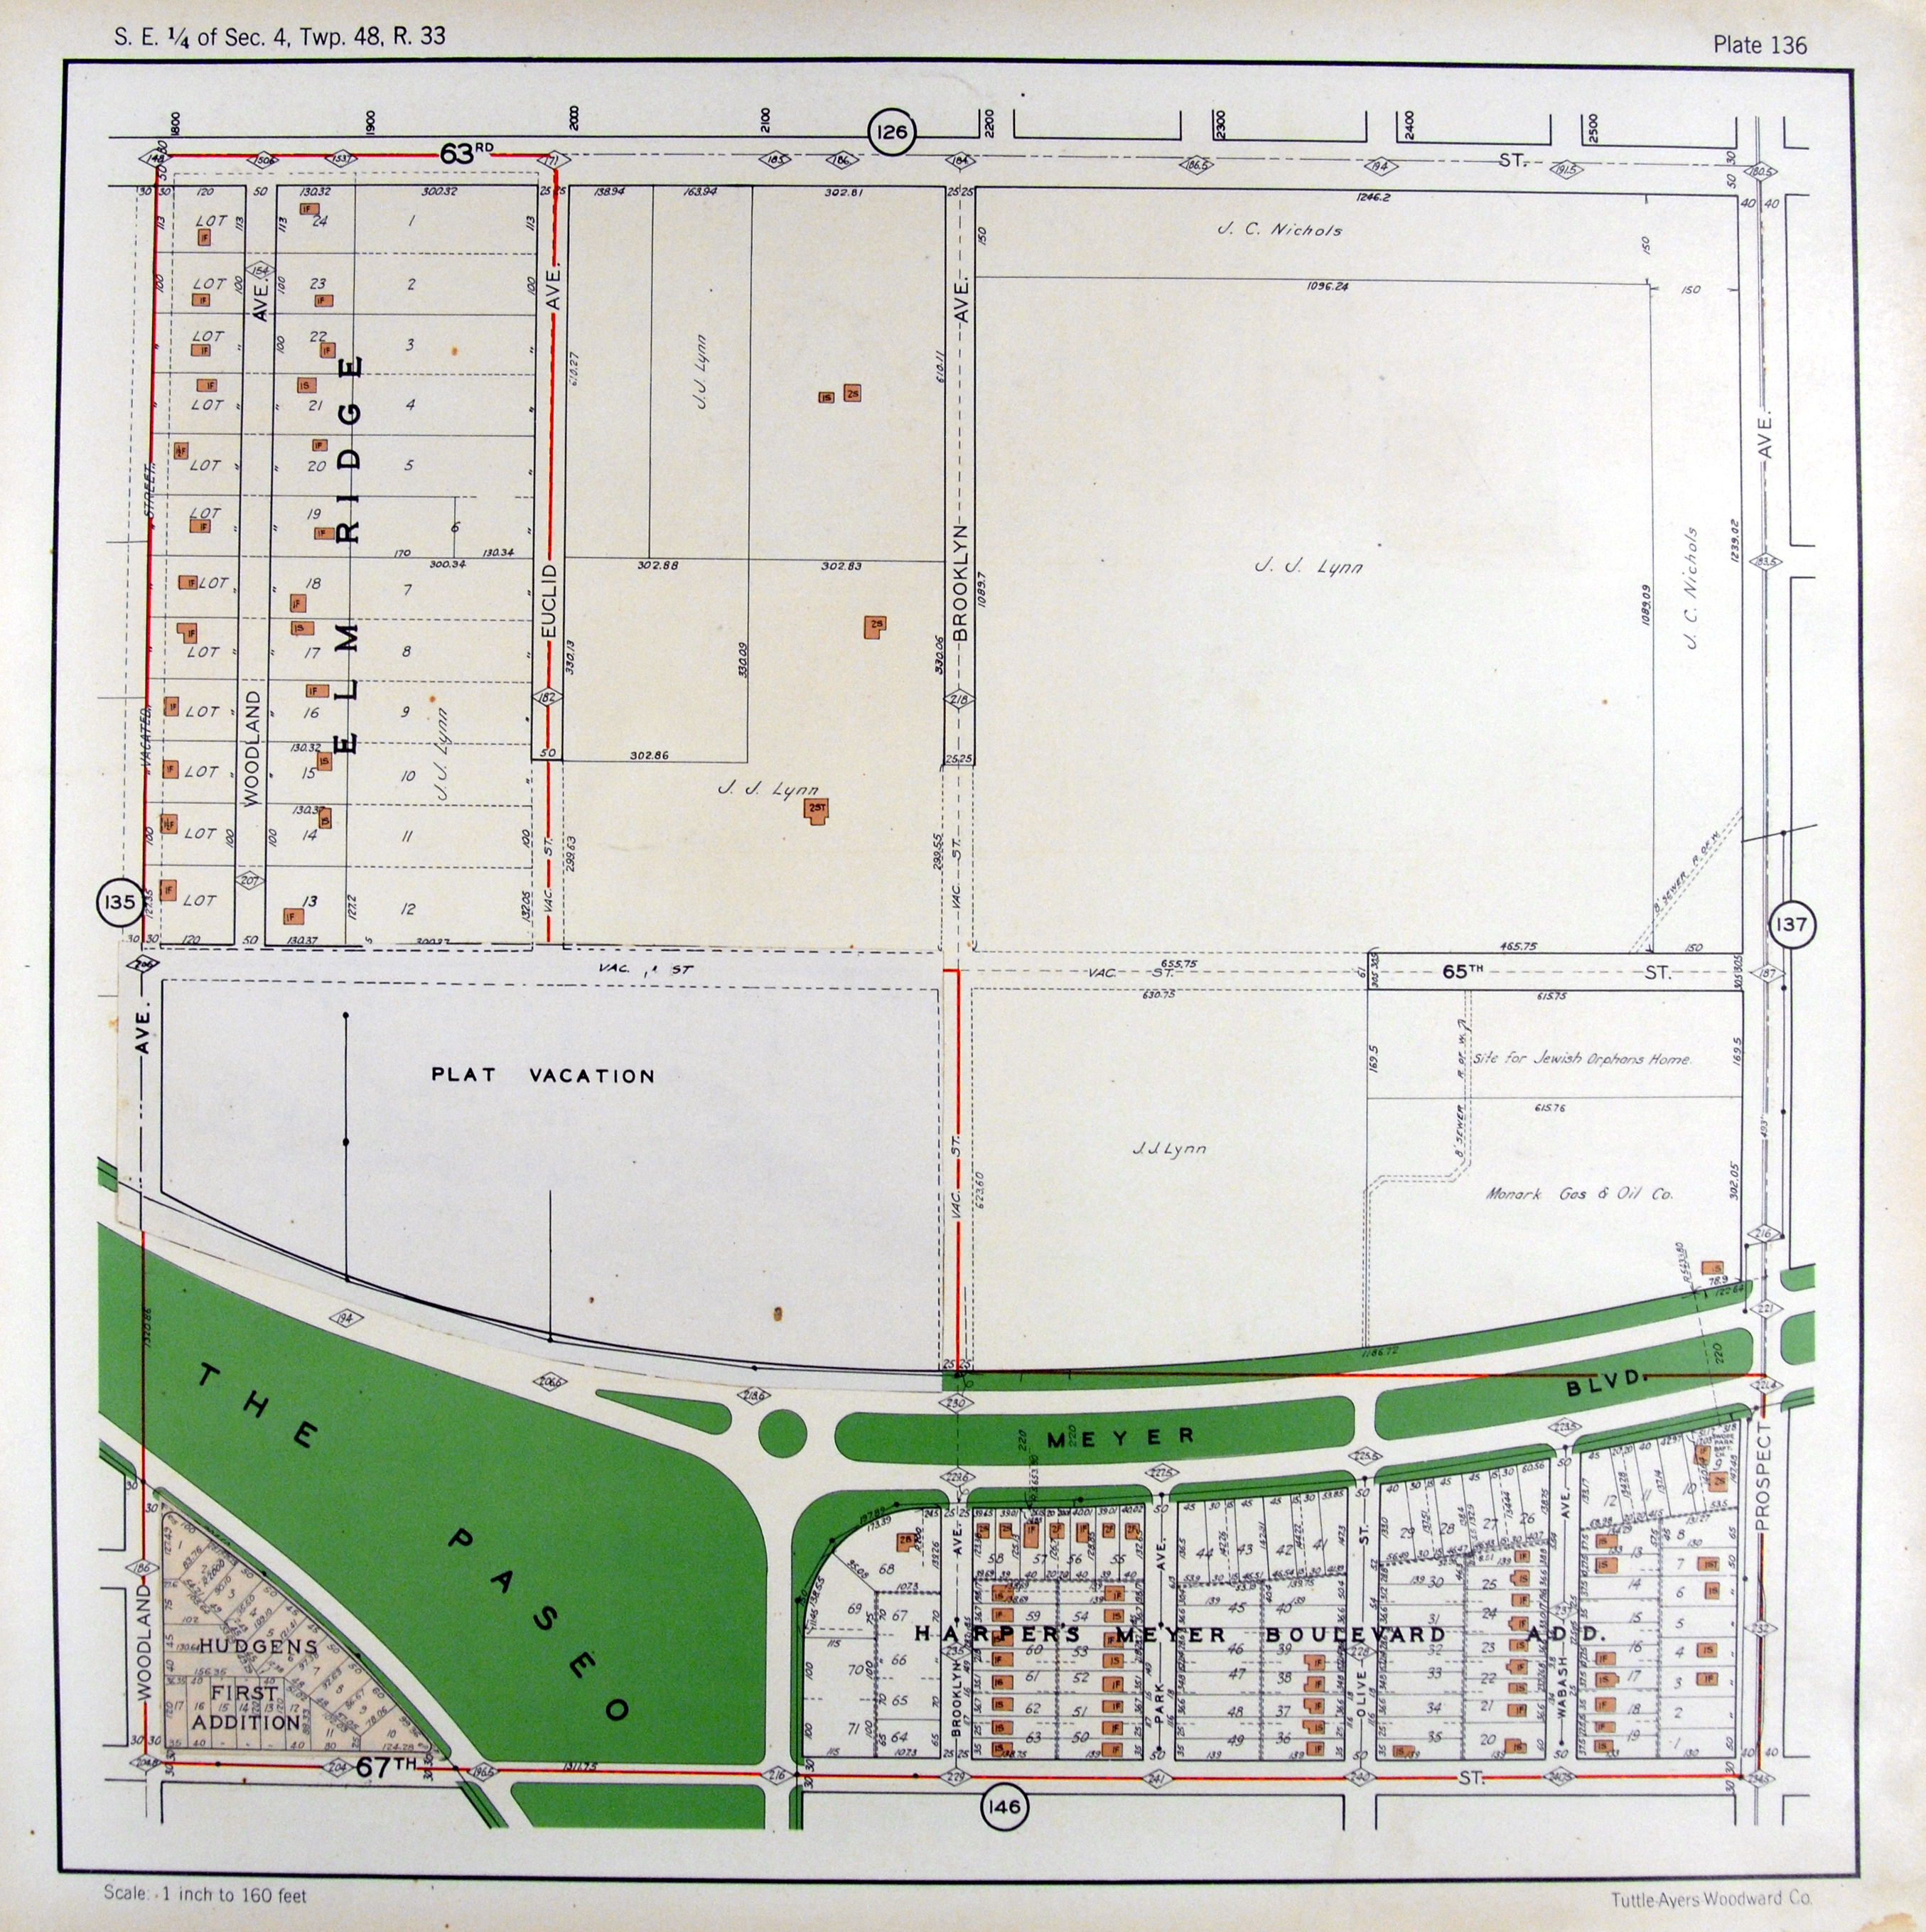
Figure 1. The 1925 Atlas of 63rd and E. Meyer Blvd
As shown in figure 1. the area in 1925 was owned by J.J. Lyon but remained undeveloped.

Figure 2. The present day Hospital
Today the HCA Research Hospital occupies the entire area to the west of Prospect with the area to the east remaining empty except for one small building that is now a dance studio.
Prospect Avenue from 50th St. to 52nd St.
My blocks on Prospect Avenue were from 50th Street to 52nd Street. 50th Street is just a couple hundred feet south of where 71 curves and then crosses over Prospect Avenue. From my two blocks, especially between 50th and 51st St,you have a very good view of the looming highway.
The earliest record of my blocks I could find was from a Sanborn Fire Insurance Company map from 1917. Not much was located in my section yet, a few buildings were dotted along the east side of Prospect. One of these buildings was church.
Overtime, my blocks developed and more buildings, residential and business, sprang up. The church located there on the corner of 51st St on the east side of Prospect built a new building farther back from Prospect’s street-front. It was larger and indicates that people were moving to the area. This is a Sanborn Fire Insurance Company map from 1950.
In 1951, Kansas City officials started planning out a north-to-south freeway and it would forever change this area of Kansas City. Bruce R. Watkins Drive forced the clearing of large areas of developed neighborhoods. This “parkway” now divided an entire community. The church that had been growing here for decades was now gone, located directly in the highways path.
Cities are always changing and because of that the surrounding areas and neighborhoods around them are forced to change. It’s like a domino effect, one change leads to ripples of change throughout a community.
PROSPECT CORRIDOR ANALYSIS E 46TH STREET TO SWOPE PARKWAY
INTRODUCTION
Prospect Avenue is a major arterial road in Kansas City, Missouri, most known for the
devastated condition of its adjacent neighborhoods. The corridor runs north to south from about 12th Street to 75th Street. The development of adjacent neighborhoods largely began at Kansas City’s core, and graduated southward. This project intends to use maps and photographs to analyze the bordering Prospect blocks between E 46th Street and Swope Parkway in order to draw conclusions about historical development along the corridor.
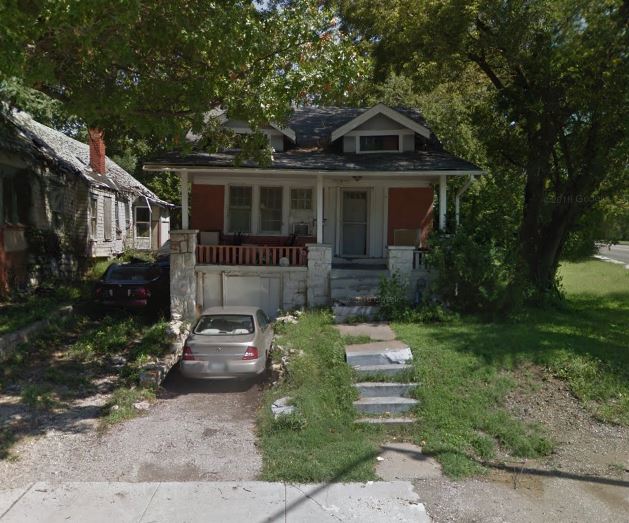
Many of these blocks contain architecture that is emblematic of the Kansas City region. Since Kansas City’s development timeline generally runs north to south, there is a gradient in housing typology. The single-family homes in the study area are quite similar to much of the residential architecture in Kansas City’s midtown region. The figures above illustrate a home that is located on the corner of Prospect and Emanuel Cleaver Boulevard that existed in 1940, during which the Kansas City’s Tax Assessment photographs were taken. Many of the homes along the prospect corridor are historic and are expressive of the 20th century, as many residencies are in the prairie (above), bungalow, or foursquare architectural style.
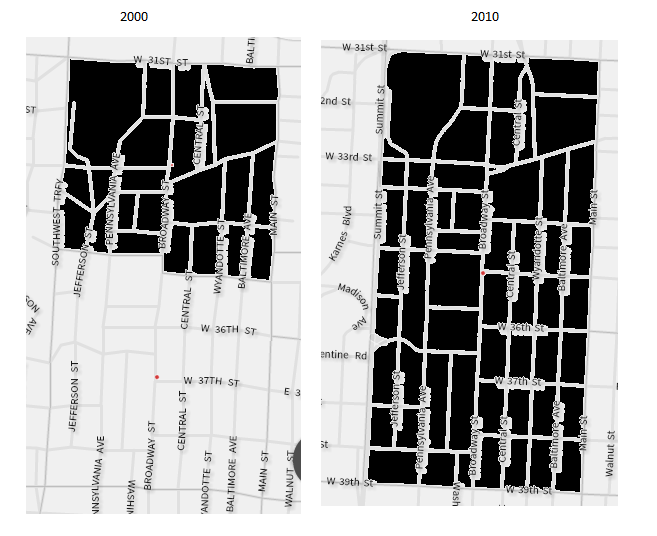
Figure Ground Study

Unsurprisingly, the lots along this region of Prospect Avenue has increased in vacancy. The residential blocks along the corridor have suffered from disinvestment and mass-demolitions, and these blocks are expressive of that. However, the lots along Swope Parkway have established reverse patterns, as the block has become denser over time. This may be due to commercial and institutional land-use patterns along Swope, as well as higherdemands for property owners to be located on Brush Creek, located in-between Swope and Emanuel Cleaver II.
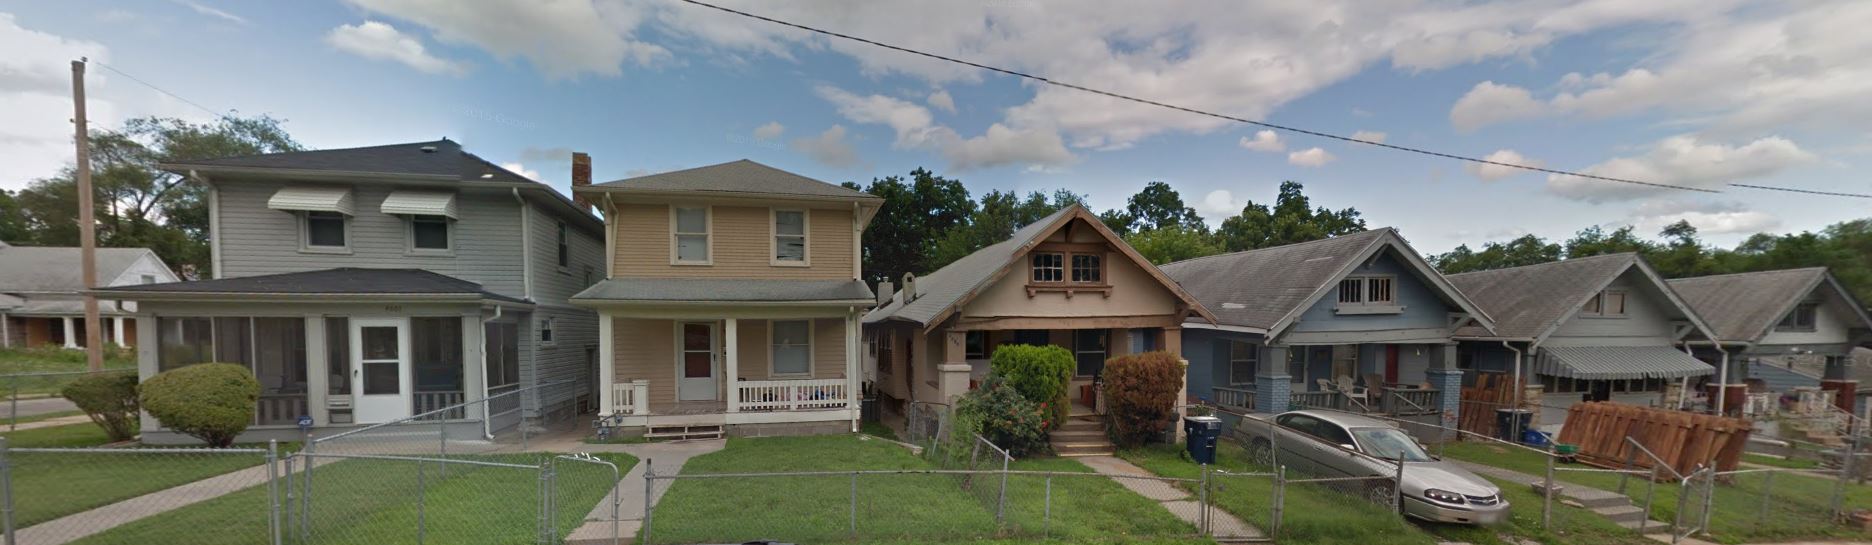

The east-side of Wabash Avenue shows a difference in density patterns. By referencing the figure-ground diagrams, we can see that the buildings on the southern part of Wabash have not been constructed yet. The homes along the north-part of Wabash Avenue have existed since the 1940s and are demonstrative in their architectural style. However, on the same street, we can see that newer development patterns are not only less dense, but contrast with the historic character of the neighborhood. It is a speculation that this type of development pattern may appear often along the corridor, as infill efforts in the blighted neighborhoods are financially challenged when constructing new homes.
Time Periods
First Record of Development (1917)
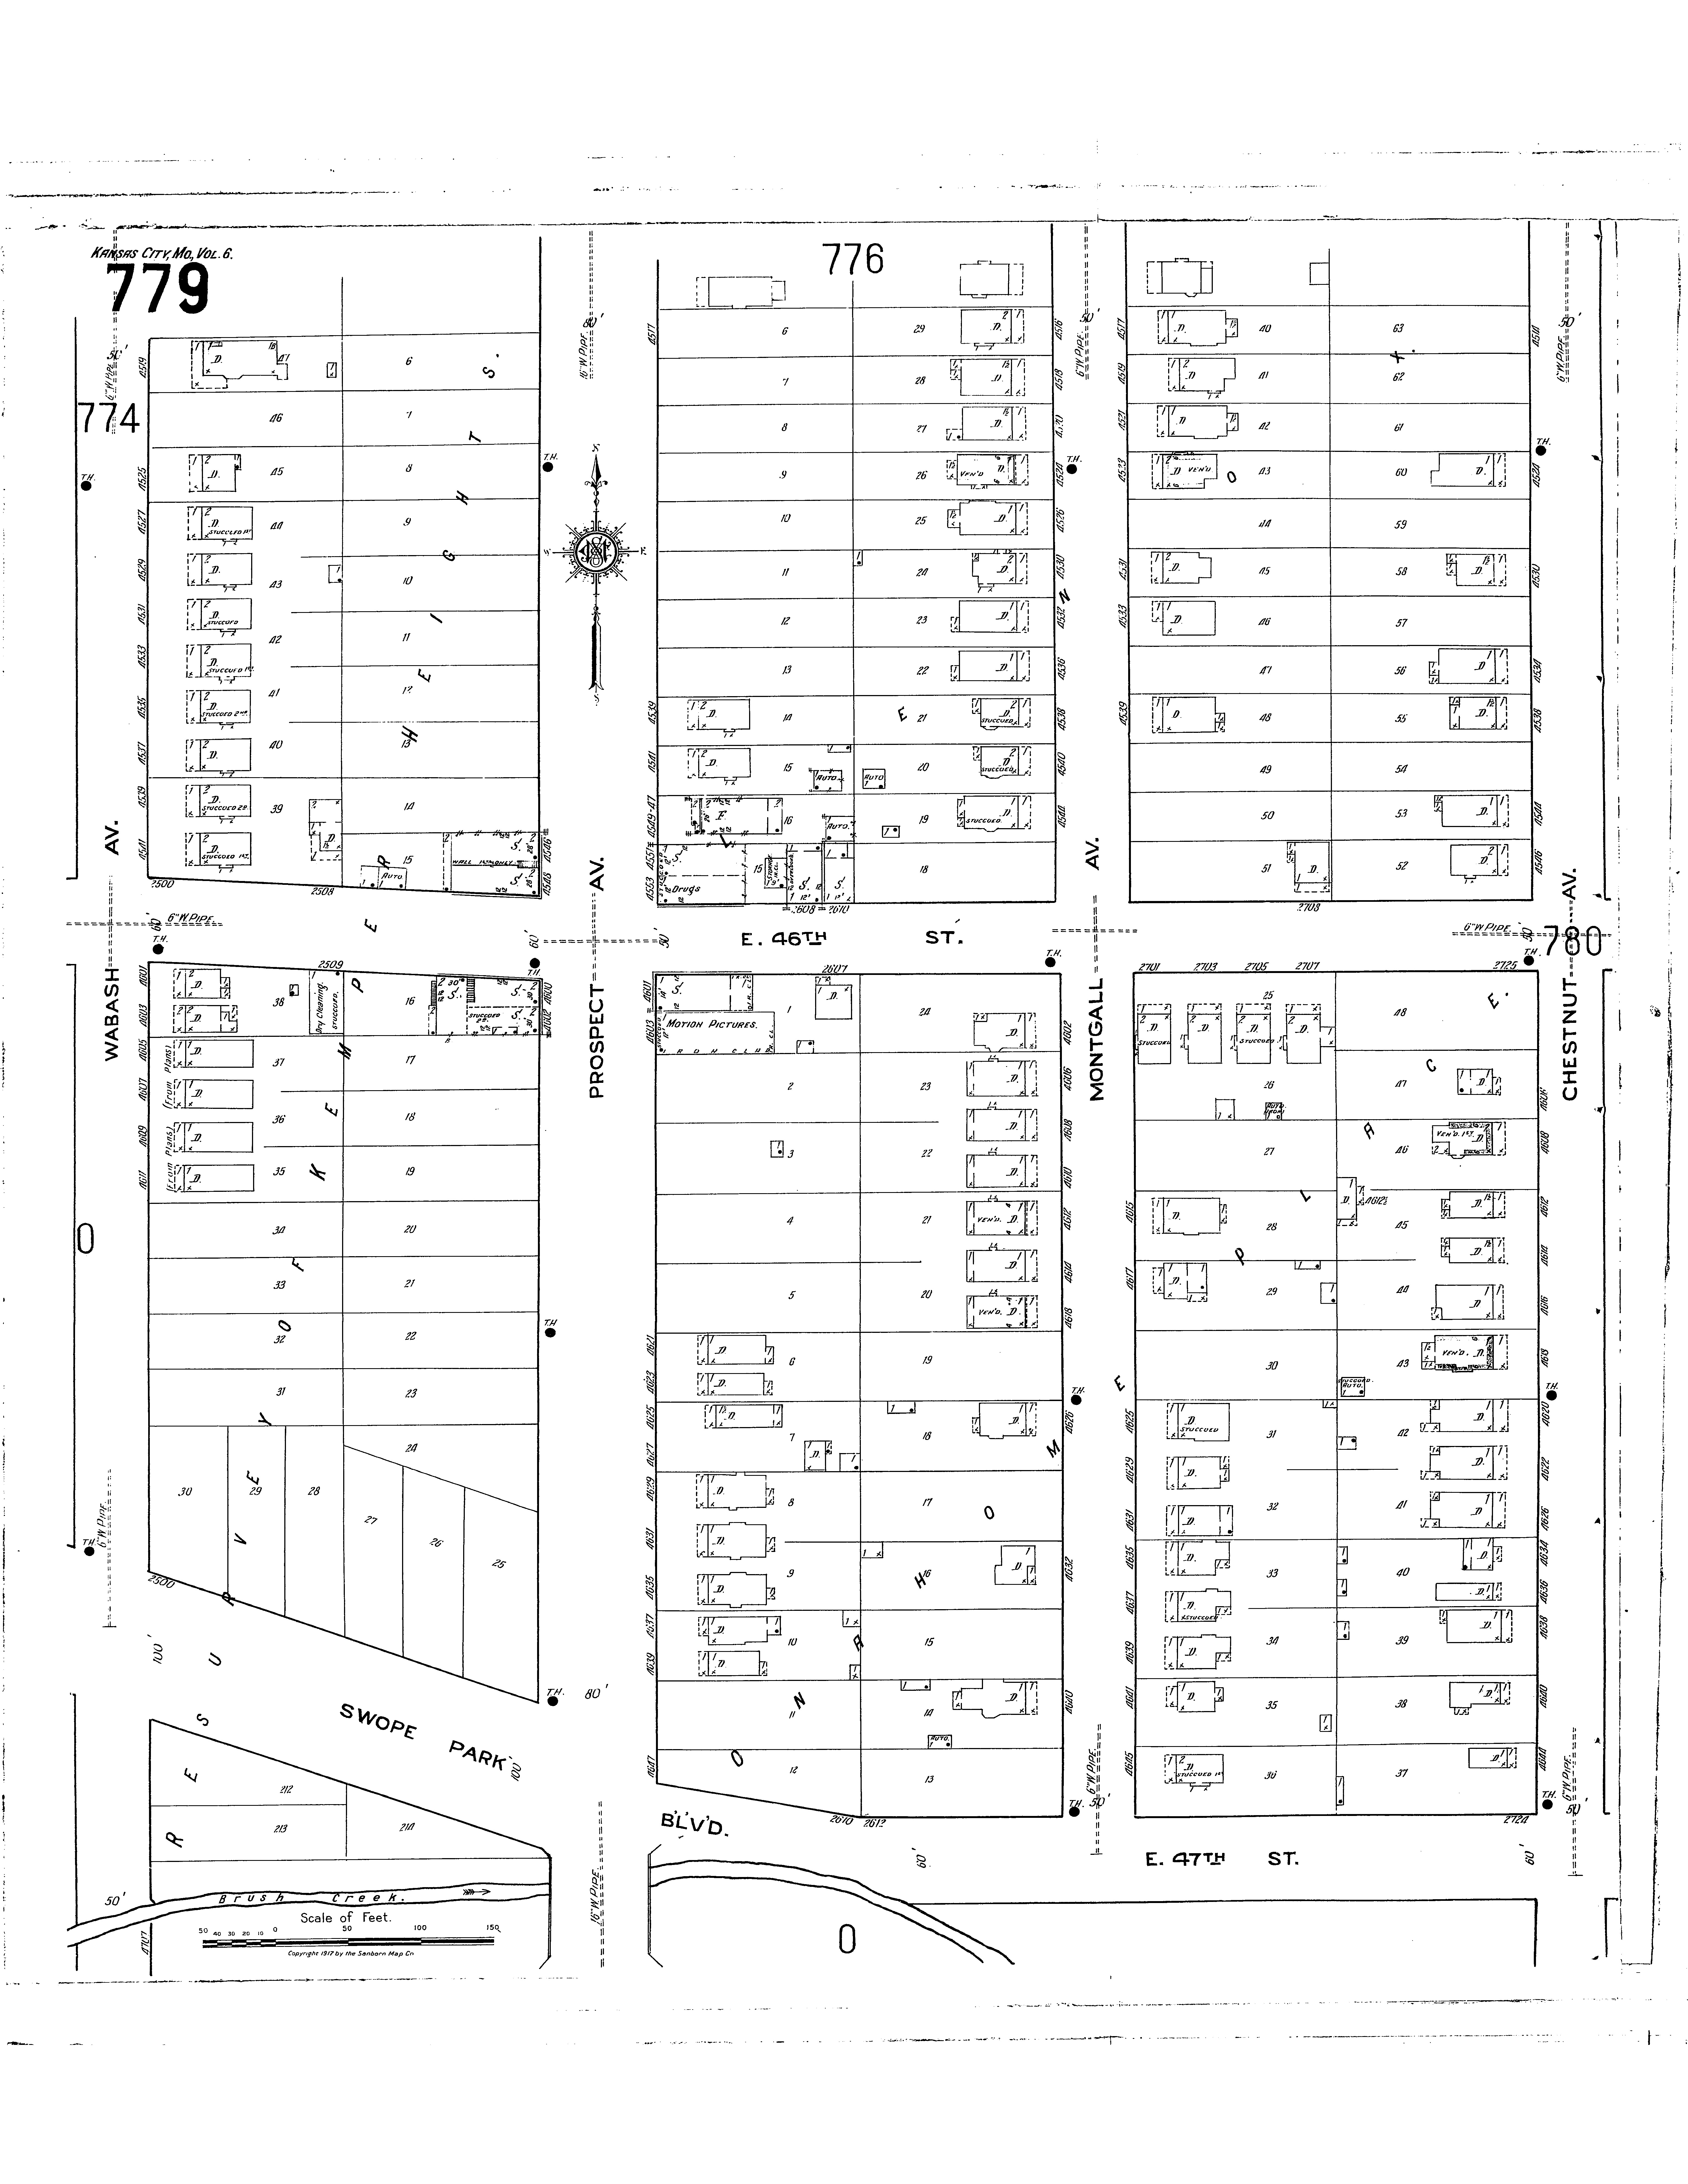
Volume 6 of the 1917 Sanborn collection
shows first signs of development on the
featured blocks. During this time, most of
the residential development was
happening along the adjacent streets,
rather than directly on Prospect. The
building footprints along Prospect show
some residential homes, but most of the
buildings are industrial land-uses centered
on intersections. The development near
Brush Creek (to the south) is very
limited, possibly due to flood hazards.
This era is characteristic of the early 1900s
during post-street car build-outs, but
pre-mail-order age.
1925 Atlas
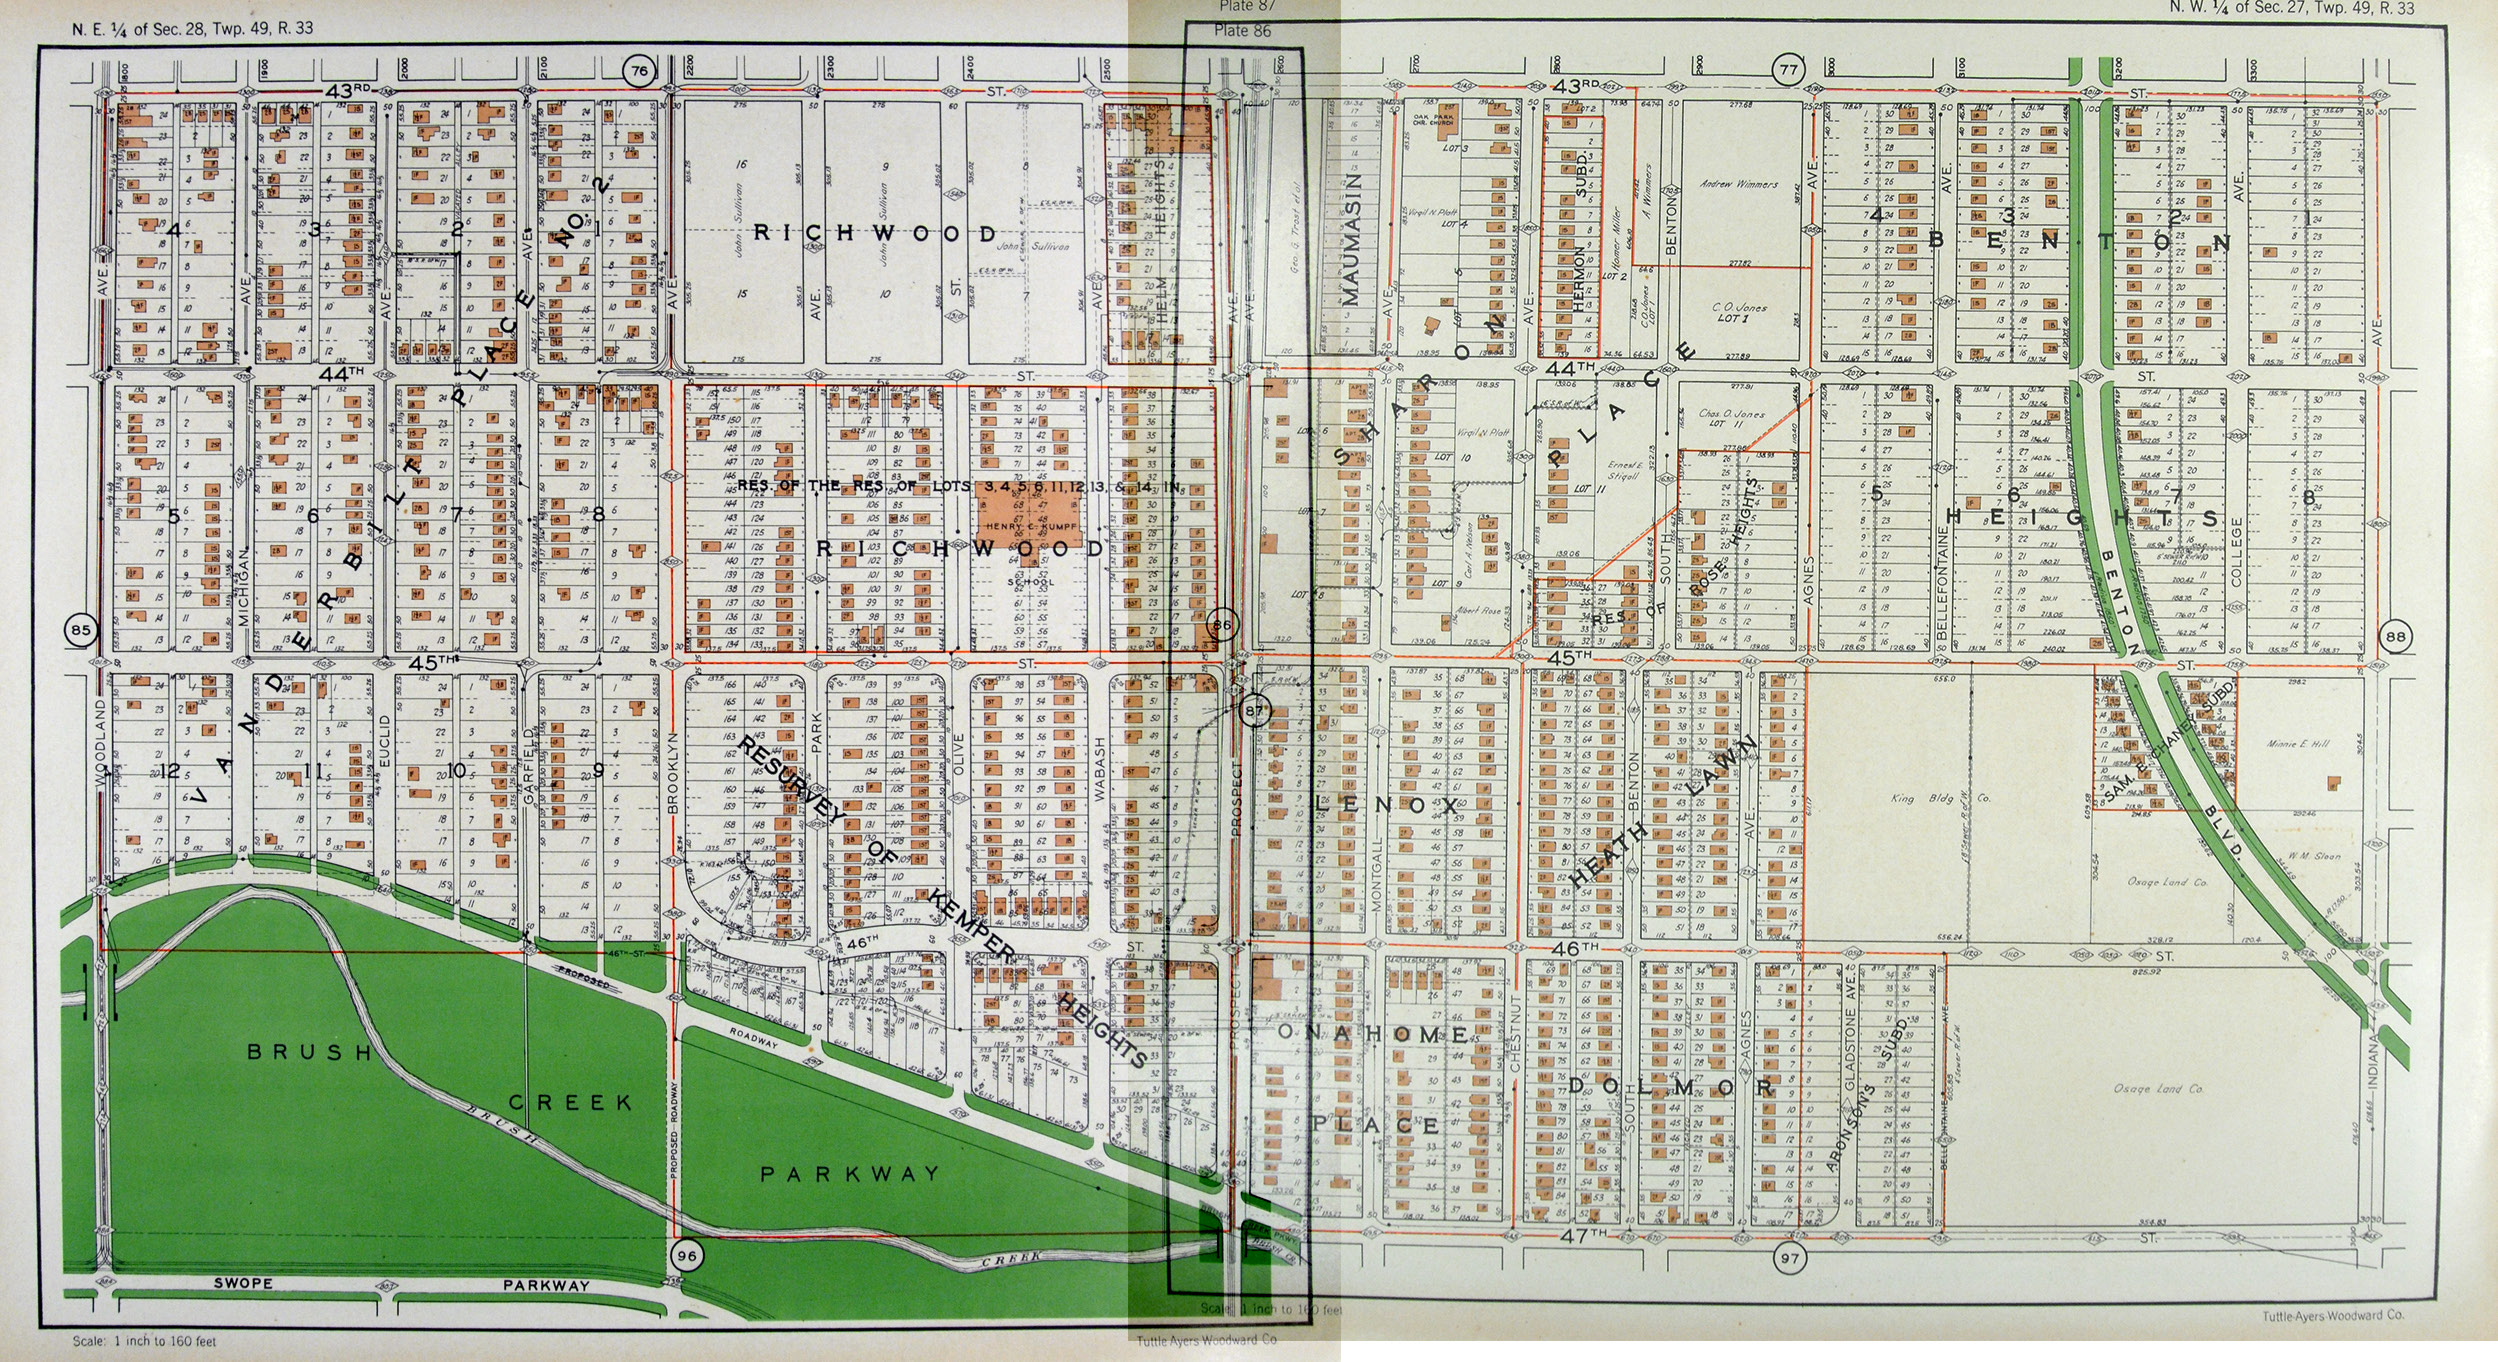
By 1925, residencial density along
Prospect has increased. The the adjacent
blocks in this area seem to increase as well.
Although this era may be the peak of
residencial density in the zone, many of
the blocks that border Brush Creek
continue to go unused. The Country Club
Plaza opened two years prior to 1925 and
Brush Creek today acts as a major
predestrian connection to the district.
However, at this time, the creek was
unpaved and parcels along the Brush
Creek near Prospect probably faced the
threat of flood.
Figure 5. Sanborn Fire Insurance Maps. (1917).
Figure
Mid Century (1950s)
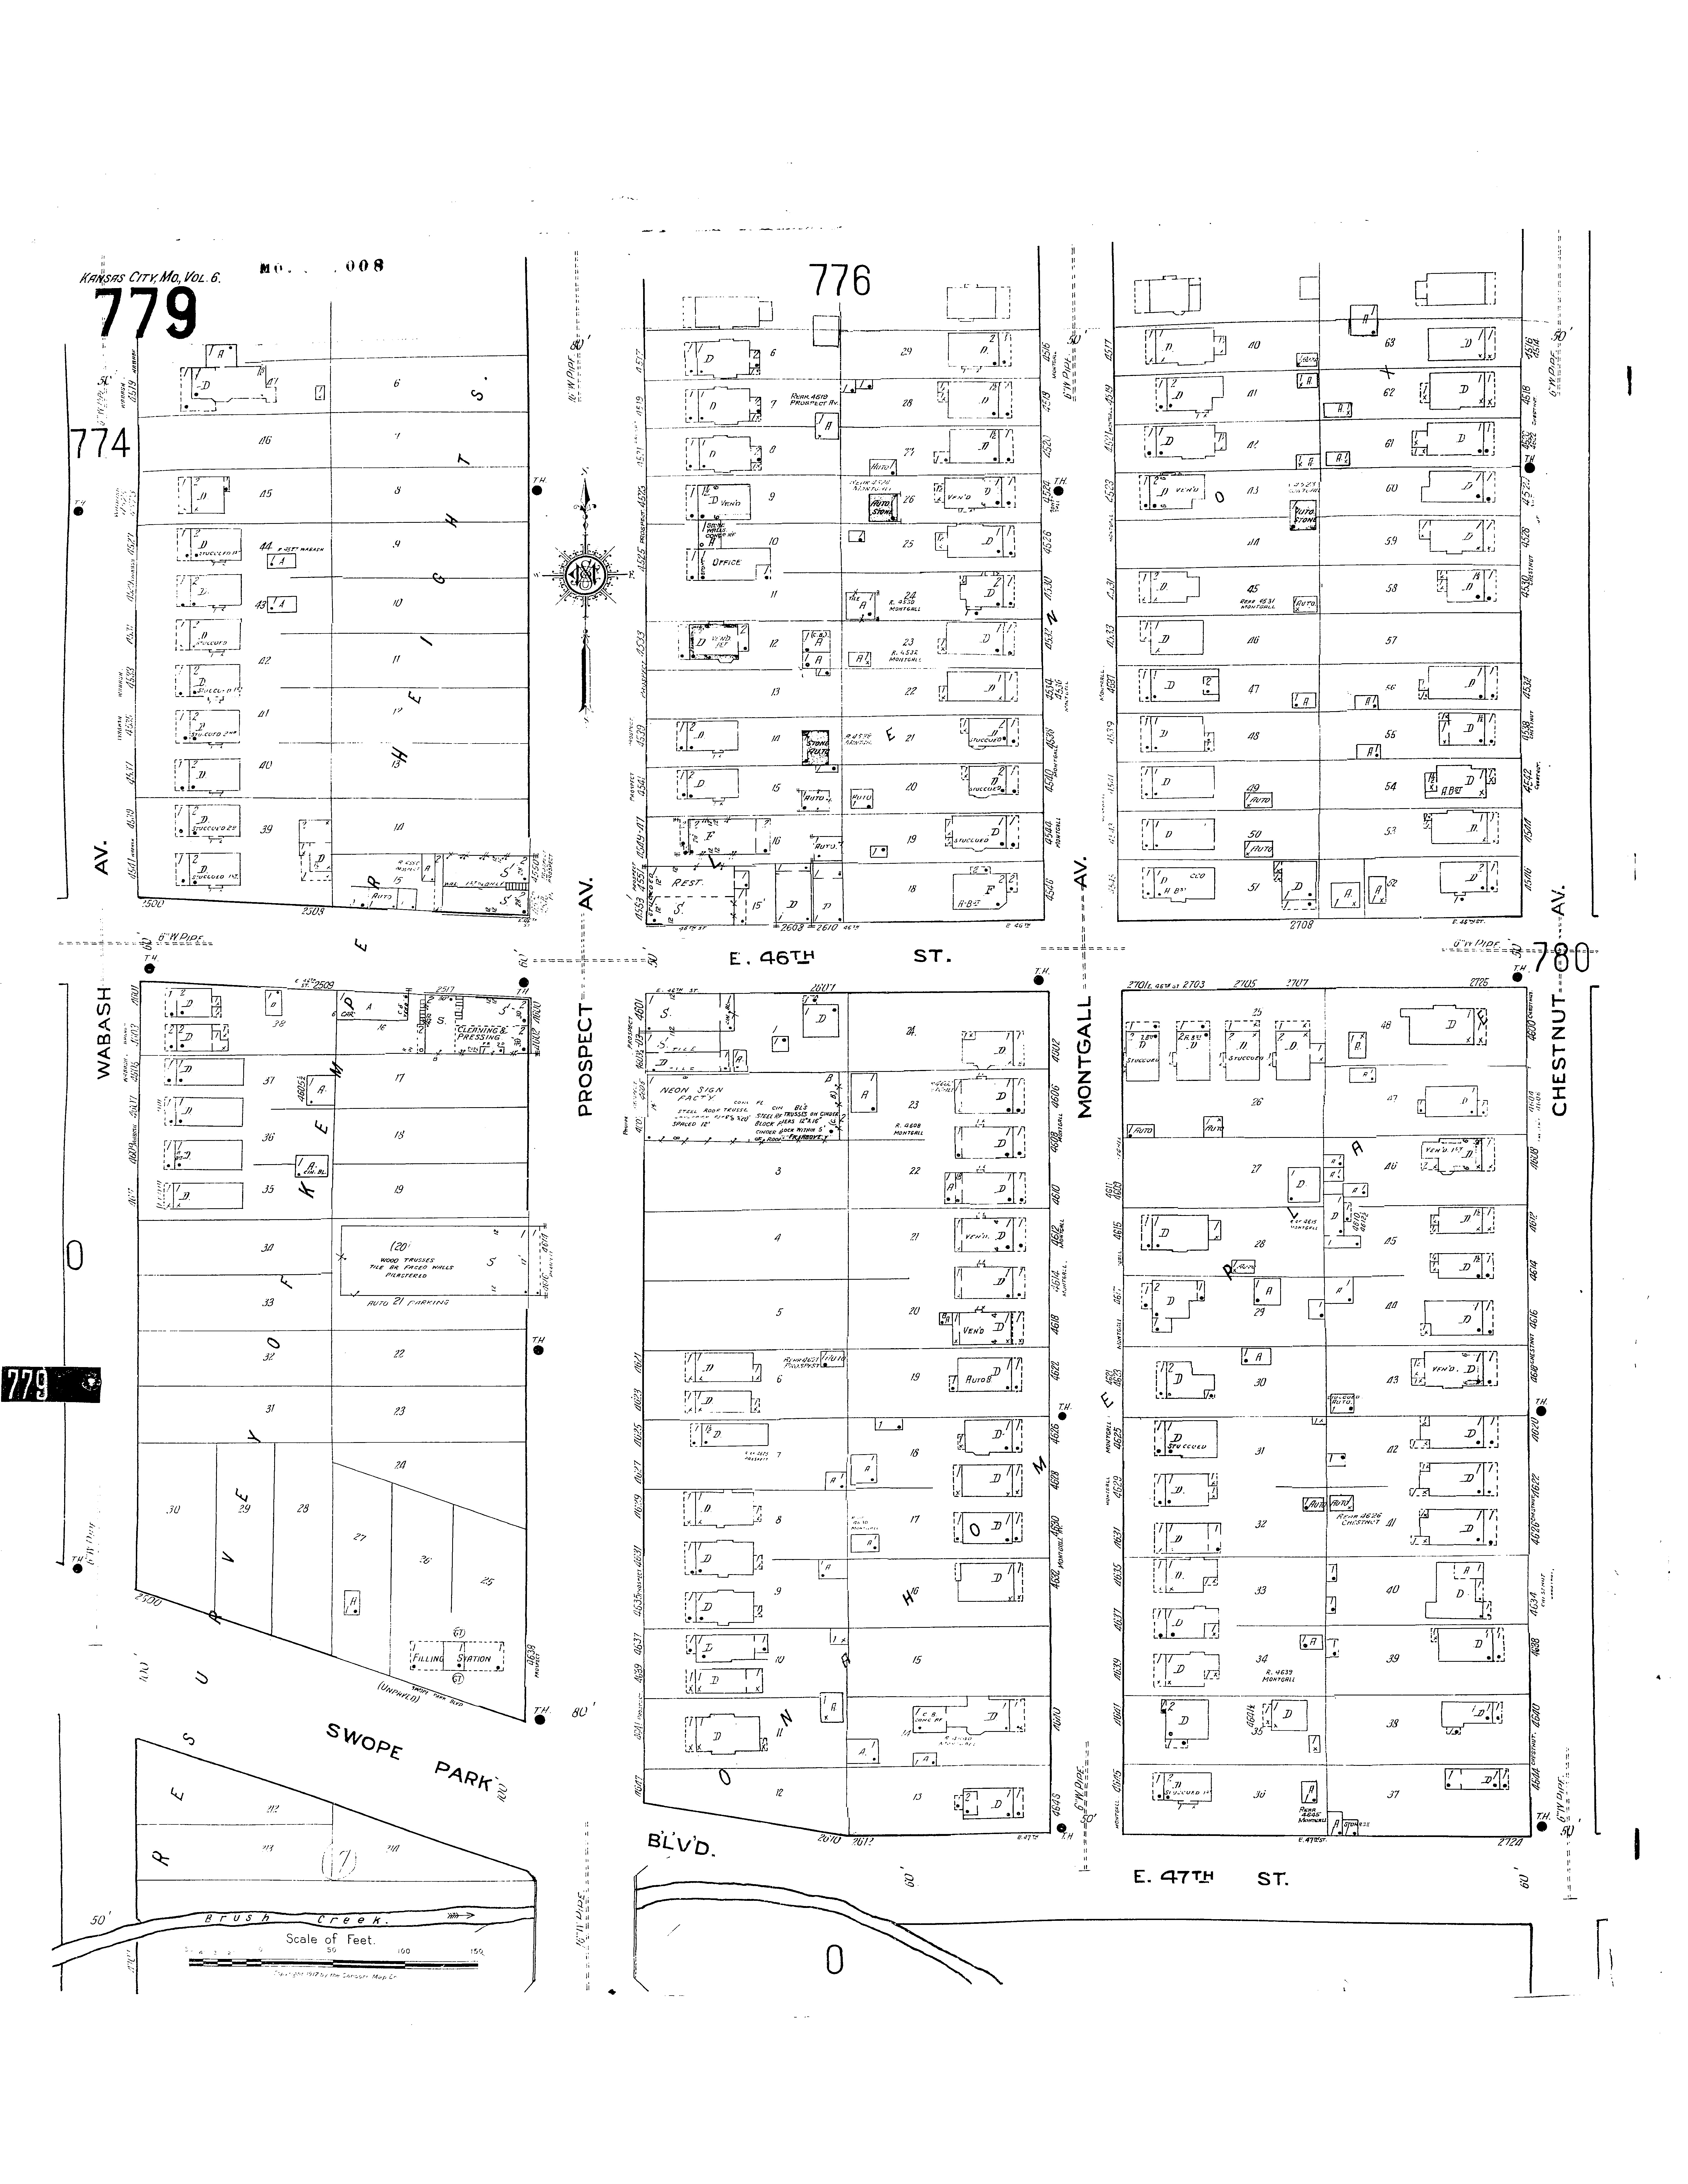
By mid-century, many of the lots adjacent to
Prospect Avenue began to fill up. Residential lots along Montgall, east of Prospect, are dense, while the western block of Wabash sees little growth. This is contrary to present-day trends, where development interests tend to shift
westward. These patterns may be explained by flooding hazards along the creek.
However, there is evidence from the Jackson County 1940s Tax Assessment photos that there was institutional development trends along the south-side of Brush Creek, just south of the study-area. This development may have been motivated by the recent paving of Brush Creek, which occured during the 1930s. Mary’s
Catholic Church (figure), which no longer
exists, was located at 2322 Swope Parkway during the 1940s.
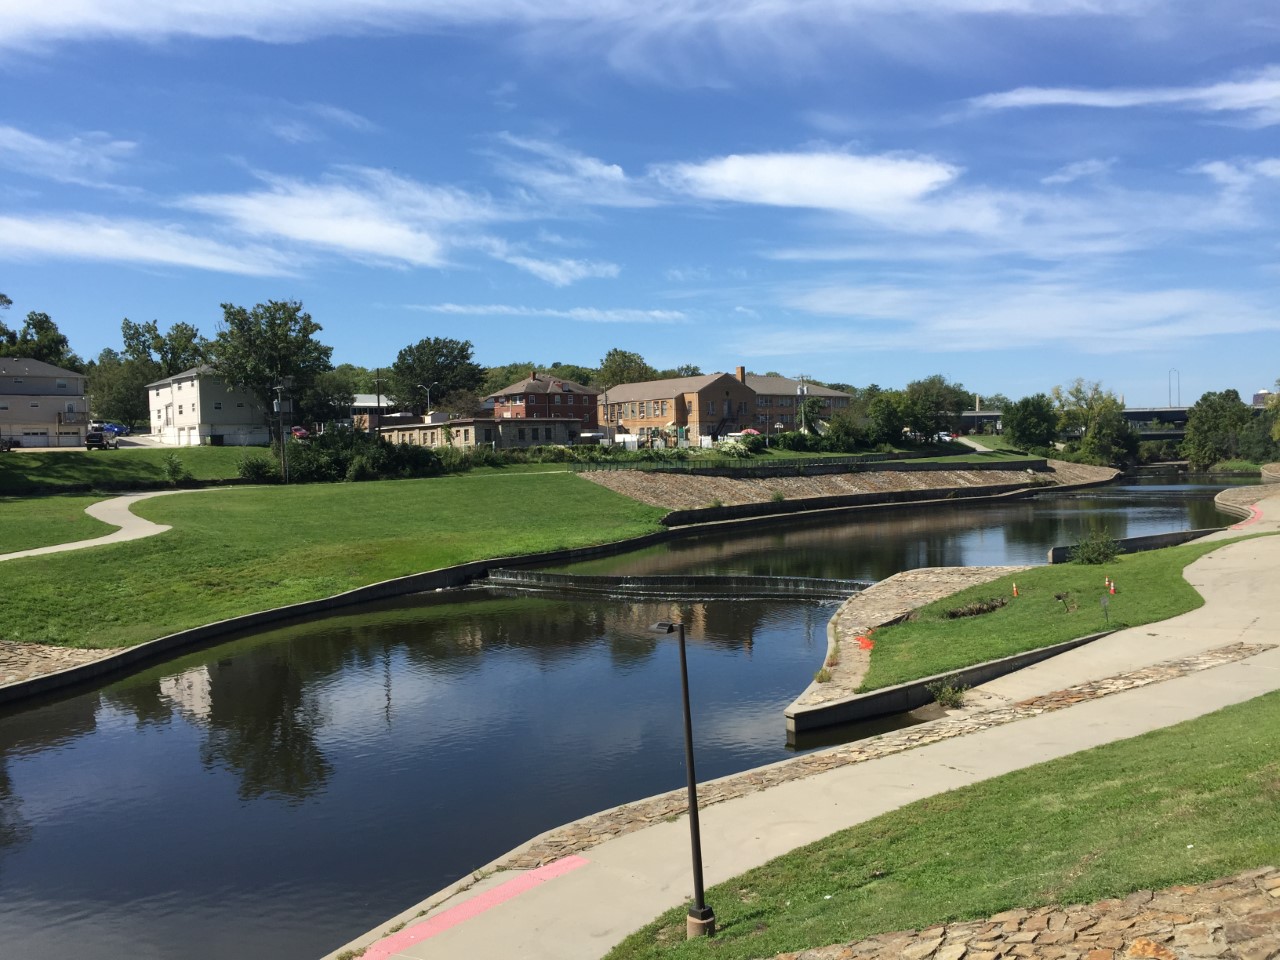
Present Day (2016)

Today, the stretch on Prospect Avenue
between 46th and Swope contains some of the only vibrant green spaces on the corridor. The trails along Brush Creek provides apedestrian connection to the West-side of town, and can be seen as a landmark on the corridor. However, the creek may indicate an edge that partners with 71-Highway individing the corridor. The neighborhoods north of the creek are dense and highly residential on both sides of the corridor. Looking south, 71-Highway abruptly crosses Prospect and runs along it, dividing the neighborhoods.The study area between 46th and Swope is not highly representative of the Prospect corridor. Emanuel Cleaver II Blvd and Swope Parkway are two major arterial roads that act as east-west connectors and run along Brush Creek, a staple of Kansas City. The east-west roads that run along Brush Creek seem to get more attention from the city in an attempt to preserve scenic views.However, many of the lots in this area remain vacant, or not taken care of well. There is also a small commercial strip that containsbuildings whose structural integrity seems to have been neglected.

E.44th St. To E.46th St.
The first map that I was able to find for my blocks was the 1909-1917 Sanborn Fire Insurance Maps. According to the map there wasn’t very much development on E. 44th Street to E. 46th Street. There was a blacksmith shop with a coal shed, a feed store, a henhouse and only nine houses on the Prospect from 44th Street to 45th Street. The blacksmith and feed store in the maps gave me the idea that cars weren’t very popular at the time due to them maybe being expensive and still a brand new inventions. kansascity1906-1917vol-61917sheet776
New Semester, New Research Area with New Researchers
Posts below date from Fall 2015’s UPD 260 class that researched Linwood Boulevard. Posts above will document Fall 2016’s UPD 260 class’s research along Prospect Avenue.
Census Project from Garfield to Park on Linwood Boulevard
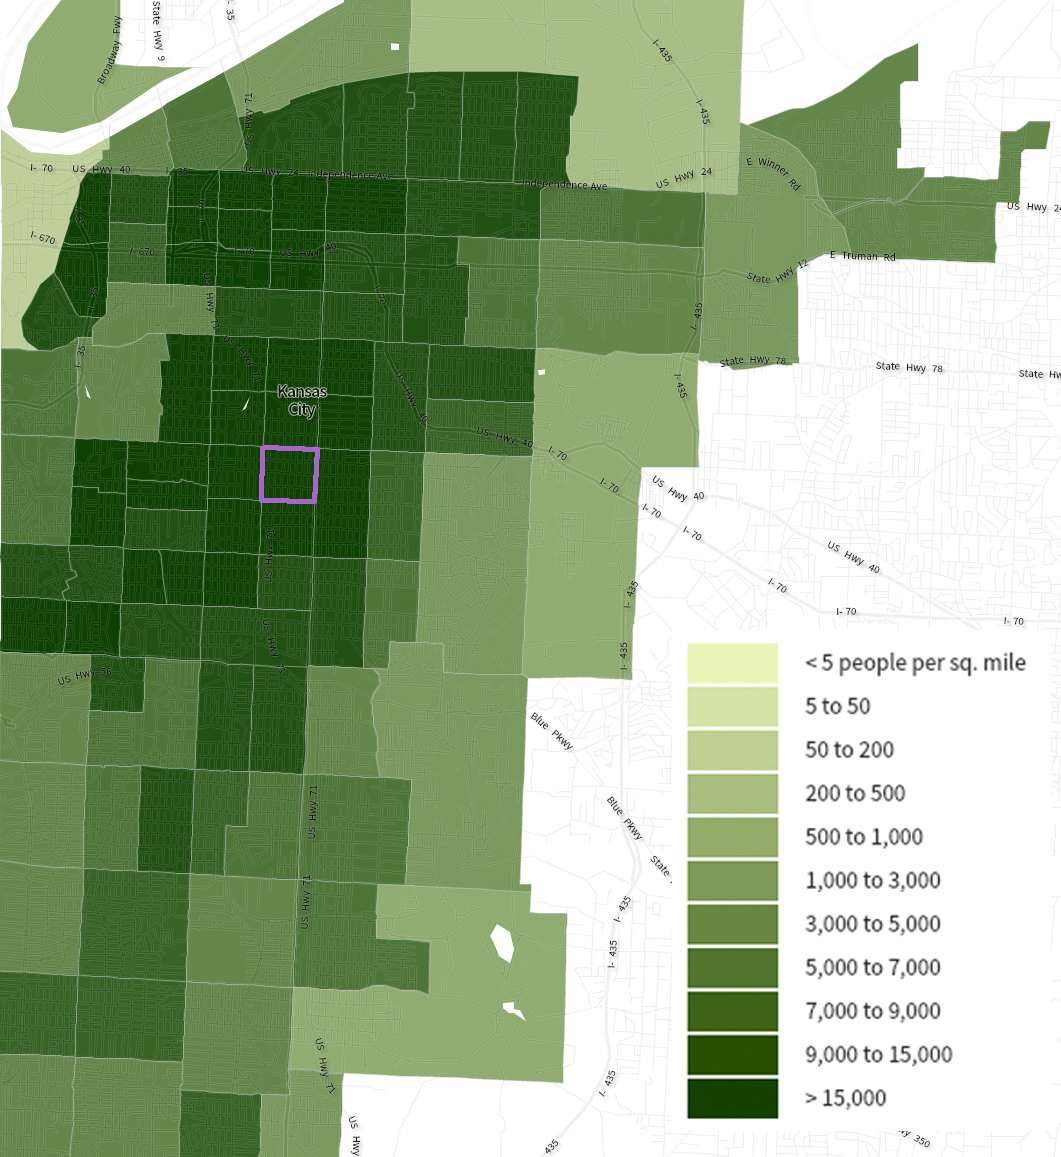
Kansas City’s census tract 54, which encompasses 31st to 35th, from Woodland to Prospect, has delineated the same boundaries from 1950 to the present. The demographic transformations of this area, however, have been far from consistent. To illustrate, in 1950, Kansas City’s urban core had experienced considerably higher population density than the present. According to figure 1, the 1950 Census recorded a total population of 5,397 (U.S. Census Bureau, 1950). Within the tract’s area of .25 square miles, this equals a population density of 22095.99 per square mile. Likewise, the racial makeup of the tract bears no resemblance to its present state. Tract 54 saw a 99.6% white population to a .4% black population (U.S. Census Bureau, 1950). Additionally, the 1,880 housing units in 1950 was far higher than ensuing decades.
When cross-referencing the 1950 census with data from 2000, the social, cultural, and political contexts readily offer perspective to the demographic shifts. For example, from 1950 to 2000, tract 54 saw total population fall to 1,230 (U.S. Census Bureau, 2000). In perspective, this reflects a drop in population density by around 23%. Seen in figure 2, the racial breakdown of the tract inverted to 95.4% black to 3.2% white (U.S. Census Bureau, 2000). From the mid-nineteenth century to the change of the millennium, the tract saw a mass exodus of the white population, along with a significant quotient of density.
Data displaying educational attainment further reflects the racial and socioeconomic rifts between those who fled to the suburbs and those who settled in tract 54. As shown in figure 2, over 41% of the overwhelmingly black population has not completed high school or equivalency (U.S. Census Bureau, 2000). Disinvestment in public resources, perhaps a function of the hemorrhaged Jackson County tax base (among many other factors) to surrounding suburban communities, has contributed to the difficulties of the area.
The 2010 census data again shows a decline in the tract’s population and density. As seen in figure 3, the total population has fallen to 903 with a population density of 3,622 per square mile (U.S. Census Bureau, 2010). Additionally, the number of housing vacancies has risen to 230, against the available 588 housing units (U.S. Census Bureau, 2010). Compared with the 2000 census, more whites and individuals self-identified as “other” or “two-or-more-races” occupy the tract.
Conversely, the inner city census tract stands in stark contrast to the Metropolitan Statistical Area. The suburban sprawl of the metro brings the total population density down to 260 per square mile. Thus, the population density of the urban tract is over 14 times denser than the MSA in aggregate. Seen in figure 4, the MSA shows a 78.5% white to 12.5% black ratio (U.S. Census Bureau, 2010). The concentration of the black community in the urban core is shocking when compared to the MSA as a whole. Also, with a median household income of over $50,000 per year, the MSA is over twice the income of the urban tract. Lastly, the MSA shows over 20% of the populating holding bachelor’s degrees, compared with the 0% of tract 54 from the 2010 census. Hence, the data show that the urban tract is denser, poorer, less educated, and more intensely racially segregated when compared to the MSA in aggregate.
2010 Census
paseo and wayne
One of the really unique and interesting things about the look and setting of this area is that it is almost entirely dominated by large apartment buildings, such as apartment complexes or high-rise apartments. Since 2010, 64 % of people pay rent. Not much has changed since the 1950s with many of the original buildings have been used as hotels and not individually owned. It has always been a low rent area with the monthly rent since 2010 being $565.00. Many of the residences in this area are relatively historic, built no later than 1939, and in some cases, quite a bit earlier.
Linwood Blvd: Elmwood Ave to Chelsea Ave
Over the 60 year span this two block stretch remained within census tract 58.01. Originally an 80% white middle class neighborhood, it is now a 90% black neighborhood that has seen consistent drops in the real median household income as well as population.

These, aside from real median household income, are opposite of the trends that the broader Kansas City and Metro statistical areas were following.
That being said, even though both areas have seen a decline in real median household income the income of census tract 58.01 is less than half that of the greater Kansas City area.
*All currency statistics have been adjusted for inflation to a base year of 2013
Linwood Benton BLVD to Benton BLVD
My census tract of study was number 56. It is situated to the East of Prospect AVE. The blocks over the last 100 years have changed dramatically. While gathering census population information, I noticed the huge difference in population from 1950 to 2000. With events such as they great migration of WWI and WWII, foolish acts of planned segregation occured. My particual census tract went from a population of 8,600 people to 1,800. This is drop in people and hurts the neighborhoods of the eastside. With little population now, it is difficult to build a tax base for essential things such as basic infrastructure. Sidewalks were cracked and dangerous to walk on. Housing was abandoned and ready to be torn down. I would assume we all experienced a similar situation in our research.
The tract that I was assigned to find the census reports was 56.01. On this tract it included my blocks: S Benton Avenue to Montgall Avenue. For the census of 1950 the tract 56.01, it included more than 90% of white people, and 50 years later these numbers decreased and only had about 5% of white people. This occured because the white people moved out to the suburbs, and the African Americans moved into houses that were affordable for them. For the census of the year 2000 African Americans were around 90% of the population. Ten years later it has not changed much. The only difference is that the number of vacant houses grew, so the population density decreased.
Tracts 47 and 167
The tract encompassing the stretch of Linwood Boulevard from Main Street to Wyandotte Street has undergone many changes over time. Census Tract 47 contained these streets in 1950 and 2000. The tract was bordered by 31st St to the north, 35th St and Armor Blvd to the south, Summit St and Southwest Trfy to the west, and Main St to east. In 2010, however, the tracts were redrawn, and Tract 47 combined with Tract 48 to the south, creating the new Tract 167. The southern border of the new tract stretched to 39th St. This was the most dramatic change that the census tracts underwent during the time, and it makes before and after comparisons difficult. The population almost tripled, and the demographic balance changed dramatically. The white population was 15% more of the population than before the redistricting, and the percentage of Hispanic/Latino population took a 18% dive. However, despite all this, there were actually more people of color after the redistricting before- the white population just tripled.
Chelsea Avenue
I chose to work on census tract 58.01 and my block is at Chelsea avenue between E 31st street and Linwood Blvd. This section of town has become a predominantly black neighborhood in a 50 year span. While analyzing the data from the 1950 census tract I also noticed that it was a period of growth among the white people that lived in this area and employment was at its highest, which is no longer the case.
Race in Census Tract 47
When reviewing Census records from 1950, 2000, and 2010, the population difference by race in census tract 47 – which contains the blocks from Jefferson Street to Broadway Boulevard along West 33rd Street – begins with a dramatic imbalance and displays the unevenness in Kansas City’s racial composition as the years go by.
In 1950, census tract 47 was a predominantly white area with 4,970 white residents and only 63 African-American residents. When viewing the numbers city-wide, Kansas City had 400,599 white residents within its city limits compared to only 55,682 African-American residents. To put these numbers into perspective, Kansas City in 1950 had over eighty percent of its population comprised of white residents.
In 2000, the great population divide between white residents and African-American residents at the census tract and city level is less drastic than in 1950. In census tract 47, there are 500 white residents and 202 African-American residents. At the city-wide level, Kansas City housed 254,471 white residents and 136,921 African-American residents. No longer are white residents eighty percent of the city’s population, but this data still displays a lack of evenness in racial composition.
In 2010, the population numbers of white and African-American residents remain unequal. At the census tract level, white residents held 1,915 spots in the population and African-Americans totaled 666 residents. City-wide, white population exceeded African-American population by over 100,000 people. However, the most sobering racial population numbers come from the metropolitan statistical area data. As can be seen in the data table below, at the MSA level, African-Americans were outnumbered by whites by over a million people – precisely 1,514,888 white residents and 250,563 African-American residents.
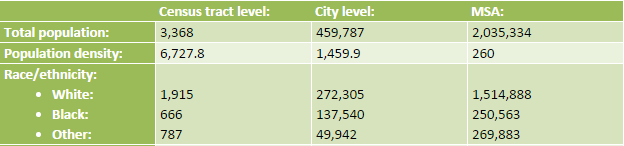 2010: Population and racial composition numbers compiled from Census data
Census Data Analysis: Linwood Boulevard in Tract 54
Census tract 54 includes the stretch of Linwood Boulevard from Park Ave to Wabash Ave. It’s bordered to the north by 31st Street, to the south by 35th Street, to the west by Woodland Avenue, and to the east by Prospect Avenue. In 1950, it was populated by residents living in both single family and multi-family dwellings. Public buildings included stately churches, apartments, and the Ivanhoe Masonic Temple, among others. Looking at Figure 1 below, you can see that this small pocket of Kansas City was a densely populated community at 22,096 people per square mile.
The above map gives us an idea of population density, but U.S. Census Bureau statistics provide more detailed data on the people inhabiting this tract. In 1950, it had 5,397 residents and was about 1% of the city as a whole. When we look at variations over the course of sixty years, there is a consistent downward trend in census tract 54’s population. The 2010 census revealed a population at only 17% of its 1950 level. In contrast there has been little change in the entire city population: the 2010 count stands at 99% of its 1950 level. See Figure 2, below:
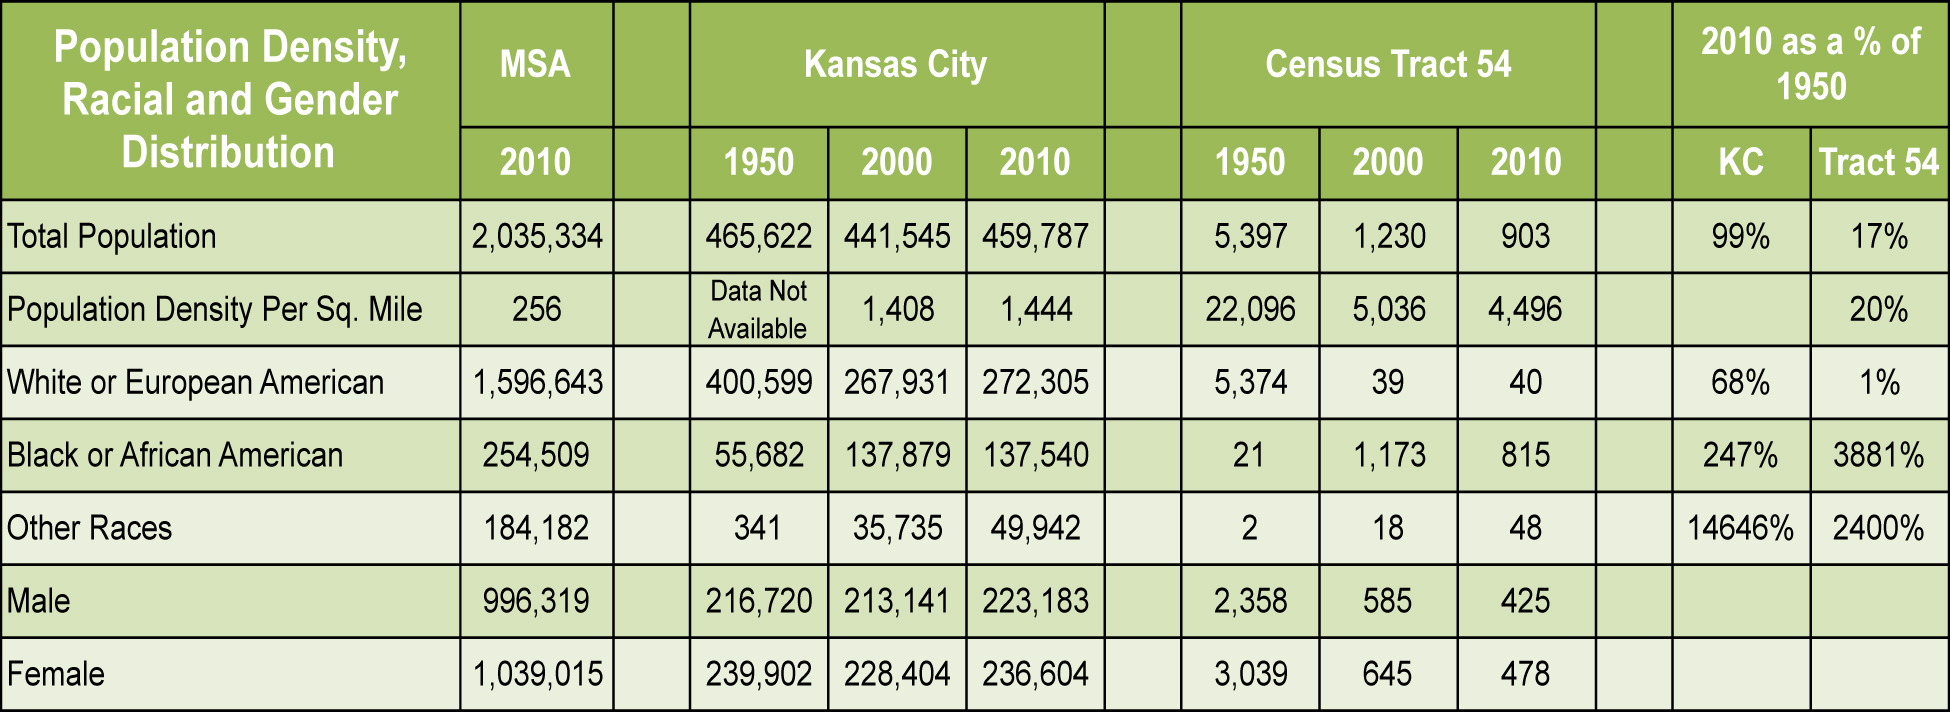
As Figure 2 shows, census tract 54 was racially homogeneous in 1950, with 99% of the population identifying as white and less than 1% black. This trend of a white majority and a black minority is completely reversed by 2010, with the white population reduced to 1% of its 1950 level and the black population increased almost forty-fold of its 1950 level.
Since the entire city’s white population in 2010 is 68% of its 1950 level, and in the metropolitan statistical area whites outnumber blacks more than 6 to 1, we can conclude that the changes in census tract 54 are not aligned with the shift in the racial makeup of Kansas City as a whole or the surrounding MSA. With such a sharp turnaround in both population and racial makeup, we must look at historical events to gain insight into what led to these changes.
Racist housing policies began to take shape prior to the 1950’s with the use of block busting, threats of violence toward blacks, developers and community builders constructing suburban subdivisions with racially restrictive covenants, and redlining. Race relations in Kansas City were tumultuous in the 1960’s and continued to be tense throughout the rest of the twentieth century.
A second factor that may have contributed to the decline of neighborhoods and thus the population was the 1968 riots following the death of Dr. Martin Luther King. Portions of Prospect Avenue, which runs along the eastern border of census tract 54, suffered property damage during the riots. This led to deteriorated homes and businesses that have never recovered.
The controversy surrounding the new “Southern Midtown Freeway” was a third factor that affected tract 54. The SMF project threatened to displace thousands of residents and businesses. It was eventually built as a smaller, parkway-style system that we know in its current form as Highway 71 / Bruce R. Watkins Drive. Highway 71 cuts directly through tract 54.
Broadway to Wyandotte
In comparing the data for the tract/s to the data found for Kansas City, Missouri as a whole, I feel that the year 2000 had the most significant differences. First, the data shows that the population density per square mile is much lower for the entirety of Kansas City compared to tracts 47 and 48. The proximity of tracts 47 and 48 to the urban center is important in this comparison, as it can be noted that they are in a very central location. Second, the average household income appears to be notably higher for the whole city than the two noted tracts, with about $32,000 averaged between the tracts and $49,194 for Kansas City. And third, the percentage of renter-occupied housing for the whole of Kansas City is about half, comparatively, of that found in tracts 47 and 48.
From this collective data, I believe it can be rationally determined that suburbanization has had a strong impact on Kansas City and its urban core. From studying tracts in a centralized location and comparing them to the much larger city, we can clearly see the effects of urban sprawl.
Big Changes in Tract #57
The aspect of the area of tract 57 (containing the Linwood blocks from Cleveland Avenue to Indiana Avenue) that shows the most change is the race/ethnicity range. In 1950, according to the U.S. Census, the area was entirely an all-white community. There were no reported non-white persons. Of the white persons, 134 were foreign-born, but all from predominately white countries. This reflected the city-wide statistics, though a bit more to the extreme side. In the overall Kansas City Census, the total number of white persons was 400,599, while only 56,023 non-white persons were reported. Fifty years later, the total population of Kansas City showed 267,931 white persons, 137,879 black or African American persons, and 10,780 persons of other races. The 2010 census reflected similar numbers.
In tract 57, however, the most drastic change is shown in regards to the white and nonwhite populations. As previously stated, the area in 1950 was completely white, with absolutely nonwhite persons living in the area. In just 50 years, the whole area switched from entirely white to predominately Black and African American. By 2000, there were only 35 white persons living in the area, and over 2,500 nonwhite persons in the tract.
As I’ve shown in the graph below, this change continued into 2010, with no white persons reported to be living in the tract. Around 98% of inhabitants were reported as Black or African American, and 42 persons (less than 2%) were reported as other races.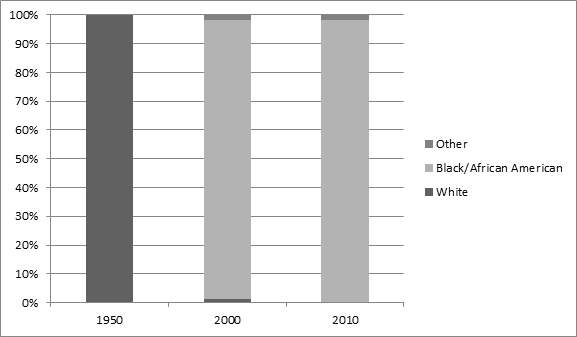
Kensington Ave to Elmwood Ave Demographic and Income Change
I found Social Explorer very interesting in how it compiled data over the years. I was especially interested in how my census tract has changed over the course of 60 years. What used to be a mostly all white middle class suburb of Kansas City, Missouri evolved into a mostly all African American community who are struggling to make it financially. In 1950, most families lived on $3,500 income in this census tract. Most, if not all were white, and had middle income jobs. The rest were the working class, mostly black, and made half as much as the middle income occupants. In 1950, there were 1200 households which were occupied and most of the occupants had owned their homes. We see a dramatic change in the 2000 census. Most of the population in this census tract were African American. Although the population had gradually declined since the 1950’s, African Americans represented over 90% of the population. However, their incomes did no better and most residents were living in poverty. In 1950, a middle income would equate to $35,000 per household in this census tract. In 2000, the average household income in this census tract was only $17,500, half the value 50 years ago. Economically, things did not go better off for the residents living in this census tract. Home ownership fell and residents relied more on renting month per month. In 2010, the population continued to decline and with that more homes were becoming vacant. Occupied housing fell from 1,040 to 849 in a matter of ten years. Home ownership fell as well from 476 homes to 356 in ten years. Overall, housing continued to decline in this census tract as more residents continued to move out in this area. It seems that it is a continuing trend not only in this census tract but also in the surrounding city.
Interesting how time changes things…
It was interesting to see how time had changed the face of the block, and the dominant race changed over 50 Years. The population density seemed to be at its height in 1950. The census tract had a population of 6,353, giving a population density of 23,435 per square mile. In the following years the residents of the block definitely started to change, and the density decreased majorly. In 2000, the population had fallen to 1,258. I’m assuming there must have been some sort of White Flight because the block went from being 99.3% white and 0.5% black in 1950, to 47.4% white and 41.2% black in 2010 and finally 46.1% black and 43.2% white.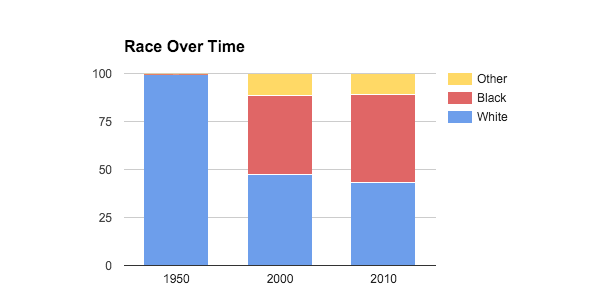
It’s interesting to note that the amount of people who had attained a bachelor’s degree increased from 2000 to 2010, but this didn’t not affect the overall median income, and it actually decreased. The median income in 1950 was $20,653, $35,693 in 2000, and $26,646 in 2010.The value of the houses seemed to change drastically yet the median rent remained more constant. In 1950 the median housing value was $49,121 and rent was $341. Then in 2000 the value increased quite a bit with the house values averaging at $101,416 and rent of $582. Then as the median house value rose to $155,800 in 2010, the average rent actually decreased to $539.
Cleveland to Myrtle Avenue
The racial make up of the avenue changed dramatically in the area, as was probably the case for most of the block groups. In 1950, 100% of my block group was white. By 2010, 100% were black. It is a dramatic statement on the intense segregation still affecting Kansas City today.
There was a large increase in vacant housing in the area. There was some in 1950, but I would argue that housing had just not been sold yet. The large number of vacant homes in 2010 are much more than just unsold homes. These are abandoned homes, condemned homes, homes for sale, homes for rent, etc. It still speaks to the issue of decreasing population coupled with an increasing vacant housing stock.
Karnes Blvd to Jefferson St.
The blocks from Karnes Blvd to Jefferson St. were located in two different census tracts. Karnes Blvd to Summit St is located in census tract 46, and Summit St. to Jefferson St. is located in census tract 47 which later changed to 167. The population of this area has greatly decreased from 1950 to 2010, which my be partially due to the building of the Metropolitian Community College at Penn Valley campus. The area remained predominantly white with small increases of blacks and other races throughout the years. Also, blacks and whites reiding in these areas earned a higher median income than whites in Census Tract 46 in 2000.
Population by Race and Gender
| 1950 | Census Tract 46 | Census Tract 47 | Total |
| Total Population | 4,266 | 5,034 | 9,300 |
| Population Density | 6,452.20 | 21,782.32 | 10,422.80 |
| Male | 1,899 | 2,151 | 4,050 |
| Female | 2,367 | 2,883 | 5,250 |
| White Alone | 4,117 | 4,796 | 8,913 |
| Black Alone | 23 | 63 | 86 |
| Other Alone | 1 | 1 | 2 |
| 2000 | Census Tract 46 | Census Tract 47 | Total |
| Total Population | 2,645 | 1,071 | 3,536 |
| Population Density | 3,728.3 | 4,634.3 | 3,963.0 |
| Male | 1,280 | 630 | 1,910 |
| Female | 1,185 | 441 | 1,626 |
| White Alone | 1,912 | 618 | 2,530 |
| Black Alone | 212 | 210 | 422 |
| Other Alone | 254 | 141 | 395 |
| 2010 | Census Tract 46 | Census Tract 167 | Total |
| Total Population | 2,501 | 3,368 | 5,869 |
| Population Density | 3,779.7 | 6,727.8 | 5,049.5 |
| Male | 1,267 | 2,008 | 3,275 |
| Female | 1,234 | 1,360 | 2,594 |
| White Alone | 1,901 | 2,122 | 4,023 |
| Black Alone | 361 | 682 | 1,043 |
| Other Alone | 119 | 346 | 465 |
*Social Explorer; 1950, 2000, 2010 Census Tracts
Median household income in 1999 Dollars
| 2000 | Census Tract 46 | Census Tract 47 | Total |
| All Households | $33,500 | $20,701 | $29,134 |
| White Alone Household | $31,867 | $21,836 | $29,368 |
| Black Alone Household | $56,094 | $11,912 | $15,797 |
| Other Alone Household | $50,781 | $20,729 | $34,111 |
*Social Explorer, 2000 Census Tract
Michigan Avenue to Garfield Avenue (Tract 54)
In 1950 the total population was 5,397 with a population density of 22,095. Out of those 5,397 people, about 99.574% were white, 0.389% were black, and only 0.037% were other races/ethnicities. Out of all of these people, 43.691%, or 2,358 were male, while 56.309%, or 3,039 were female. Looking at the population as a whole, the median income was $2,641, with majority only attaining a high school diploma. Looking at the population as a whole, the median income was $2,641, with majority only attaining a high school diploma.
In 2000 there was a noticeably large drop in population from 1950, with total population being 1,230 with a density of 5,039.9. Out of the 1,230 people who lived in the area, 1,173 were black, or 95.366%, leaving only 39 white (3.171%) and 7 of other ethnicities (0.005%). Out of the residents, 585 (47.561%) were males averaging about 34 years in age, and 645 (52.439%) were female averaging about 35 in age. This area had 620 housing units, which is a pretty large drop from 1950, but still has a large renter occupation, with 302 being rented out with a $387 median rent, but there are more housing units owned (207).
In 2010 there was a decrease in total population from 2000 with there now being 1,120 with a density of 4,496.4. The majority is still black, with 901 (80.375%), leaving only 220 white (19.625%). There is a slight change in the gender average, with the males growing about 2% from 2000, but still with a fairly even split with 557 males and 564 females. The median income inflated slightly, with it now being $24,464, but the majority still only attained a college degree.
Linwood Census Analysis
There was a lot of interesting information from the different census years. The things that I found most dramatic was the change in racial makeup and the changes in educational attainment.
Over 11,000 white citizens left my area between 1950 and 2000, over 97% of the white population. In 1950, white citizens made up over 98% of the population in the area. In 2010 they were less than 11%.
Overall educational attainment has increased with the greatest increases coming from those who attended college less than 4 years. Although the status doesn’t indicate whether they graduated from a 2-year program or dropped out before obtaining their degree, this trend is very positive for the area. The increase has been over 10% from 1950 to 2010.
W. 33rd St. to Karnes Blvd. Census Analysis
W. 33rd Street to Karnes Boulevard is analyzed through the United States Census Tract 46. This tract extends east to Summit Street and west to State Line Road. The southern border is at 39th Street while the northern border is at 31st street. One substantial statistic to note is that in 1950, 99.5% of the area’s population was white. Only 0.4% of the population was black which showed the extreme segregation in the city at this time. Thankfully, when we hit the year 2010, the numbers have become more acceptable with over 14% of the population being black and 76% white. I believe that the influx of minorities probably happened due to “white flight” in the 1950s and 1960s.
Flora to Highland
One thing struck me more than anything else during this project.
In 1950, the US census recorded one person in all of tract 52 was neither white or black. One single person was different from anyone else in the area. 99.25% of his or her neighbors were white, another 0.73% of people were black, and there is one Other. What this project has taught me that these aren’t just numbers on a website or maps in a library, they’re people and places, these blocks have stories. So much of Urban Planning seems to be about the big picture, but it’s important to be reminded of the importance of one: one block in one year to one person whose name I’ll never know.
Tracy to Flora (KCMO), Tract 52
Tract 52, as identified by the United States Census Bureau, in Kansas City Missouri is approximately a 42-block radius situated on the southern side of historical Linwood Boulevard. Over the past 50 years this tract has experienced intense change.
In 1950 the population in Tract 52 exceeded 6,500 people and consisted of 99% whites and .98% African Americans (Figure 3, Table 2). Within only about 50 years the population became completely inverted. Figure 1, Table 2 shows that in 2010 the population was 87% African American and only 6% white.
The average tenant in Tract 52 could expect to pay about $46 per month for rent in 1950 (or $454.57, 2015 Dollars), about $4 above the city average (Figure 3, Table 3). The average rental price was $281 in 2000 (or $31.06, 1950 Dollars) (Figure 2, Table 3) and fell to $263 in 2010 (Figure 1, Table 3).
Approximately 54% of the residents in Tract 52 own their home in 2010(Figure 1, Table 3), in comparison to about 26% of residents in 1950 (Figure 3, Table 3).
Only 54% of Tract 52 had earned their high school diploma in 1950 (Figure 3, Table 2); that is in comparison to 77% of the 2010 population (Figure 1, Table 2).
The median household income in Kansas City, according to the Metropolitan Statistical Area, is $45,656 but only $23,047 for Tract 52.
Figure 1 – 2010
Table 1 – General Population
| Total Population: | 1221 |
| Population Density: | 4901.1 |
Table 2 – Demographics
| Race/Ethnicity: | |
| Gender: | 493 Males, 728 Females |
| Average Age: | 35.1 years old |
| Average Income: | $25,130 |
| Highest Level Education: | Considering only the 729 persons over the age of 25.
Less than high school diploma: 166 High school graduate: 563 Completed some college: 323 Earned Bachelors Degrees: 68 Earned Masters or Doctorate: 0 |
Table 3 – Housing
| # of Housing Units: | 726 |
| Occupancy Status: | Vacant: 171
Owner Occupied: 195 Tenant Occupied: 360 |
| Median Home Value: | Rental Rate: $263 Sales Price: $72,200 |
| GINI Index: | .53 |
| Median Household Income: | $23,047 |
Figure 2 – 2000
Table 1 – General Population
| Total Population: | 1483 |
| Population Density: | 5977.6 |
Table 2 – Demographics
| Race/Ethnicity: | |
| Gender: | 798 Males, 685 Females |
| Average Age: | 35.5 years old |
| Average Income: | $32,116 |
| Highest Level Education: | Considering only the 947 persons over the age of 25.
Less than high school diploma: 390 High school graduate: 557 Completed some college: 244 Earned Bachelors Degrees: 29 Earned Masters Degree: 218 Earned Doctorate Degree: 6
*Please note I am aware these numbers do not add up but these ARE the figured given by the Census Bureau. |
Table 3 – Housing
| # of Housing Units: | 641 |
| Occupancy Status: | Vacant: 131
Owner Occupied: 171 Tenant Occupied: 357 |
| Median Home Value: | Rental Rate: $281 Sales Price: $62,100 |
Figure 3 – 1950
Table 1 – General Population
| Total Population: | 6,531 |
| Population Density: | 26,323.96 |
Table 2 – Demographics
| Race/Ethnicity: | |
| Gender: | 2,869 Males, 3662 Females |
| Median Age: | 35-64 years old |
| Median Household Income: | $2,705 |
| Highest Level Education: | Considering only the 4,785 persons over the age of 25.
No education: 35 Attended Elementary & Middle School only: 1,305 Attended some high school: 3,320 High School graduate: 2,585 Completed some college: 930 Earned Bachelors Degrees or more: 350 Not reported: 160 |
Table 3 – Housing
| # of Housing Units: | 2,604 |
| Occupancy Status: | Vacant: 116
Owner Occupied: 542 Tenant Occupied: 1,946 |
| Median Home Value: | Rental Rate: $46.89 Sales Price: $6,308 |
| Homes w/o Refrigeration Systems: | 10% |
| Homes w/o Efficient Heat Source: | 5% |
| Homes w/o bathroom: | 627 |
| Median Household Income: | $2,705 |
Info Source: (Social Explorer)
Wyandotte St to Main St
There has been quite a bit of change in this part of Linwood Boulevard over the years. In 1895 it was not even a part of the city of Kansas City proper, and was still referred to as Grand Boulevard. It was acquired by the growing city of Kansas City in 1897. At the time it was mostly residential, but by 1909 the Main Street side of the block was lined with shops. A streetcar stop was also constructed at Main and Linwood in 1899. Between then and 1925 the section of street was declared to be part of Hunter Avenue. While there were plenty of shops on Main Street, the area off Main Street was all residential still- although with a few houses replaced with apartment buildings. This changed by 1950, when many commercial buildings opened along Linwood. Today, there are still many shops on both Main and Linwood, although there are a number of surprisingly empty lots given how busy the streets are. Over the years this section has played host to a number of fascinating locations. Drexel Hall, the oldest continuously-running ballroom in Kansas City, is in this location. The Pink Garter and the Jewel Box, two burlesque entertainment venues of some historical significance, were also located on this block (although the Jewel Box was moved from Troost). Milton’s Tap Room, a famous jazz establishment, was also located on this block.
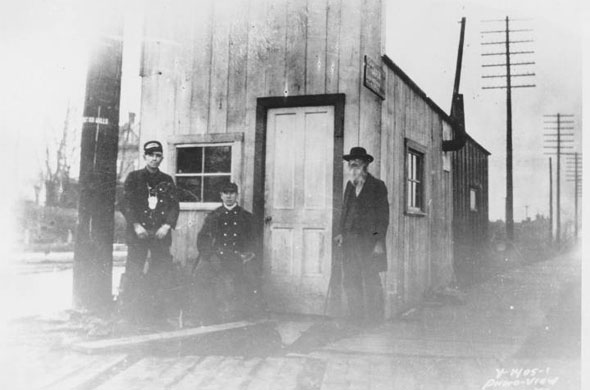
Linwood: Broadway to Wyandotte
The majority of the block of Linwood from Broadway to Wyandotte has changed relatively little. The Redemptorist Catholic Church and its older buildings have taken up the large southern block since before 1895. Central Street was added on the northern block between Broadway and Wyandotte by 1909. This led to development of residences, including several apartment buildings in this area which still exist today. There are now a small college and some businesses in place of many of those residences.
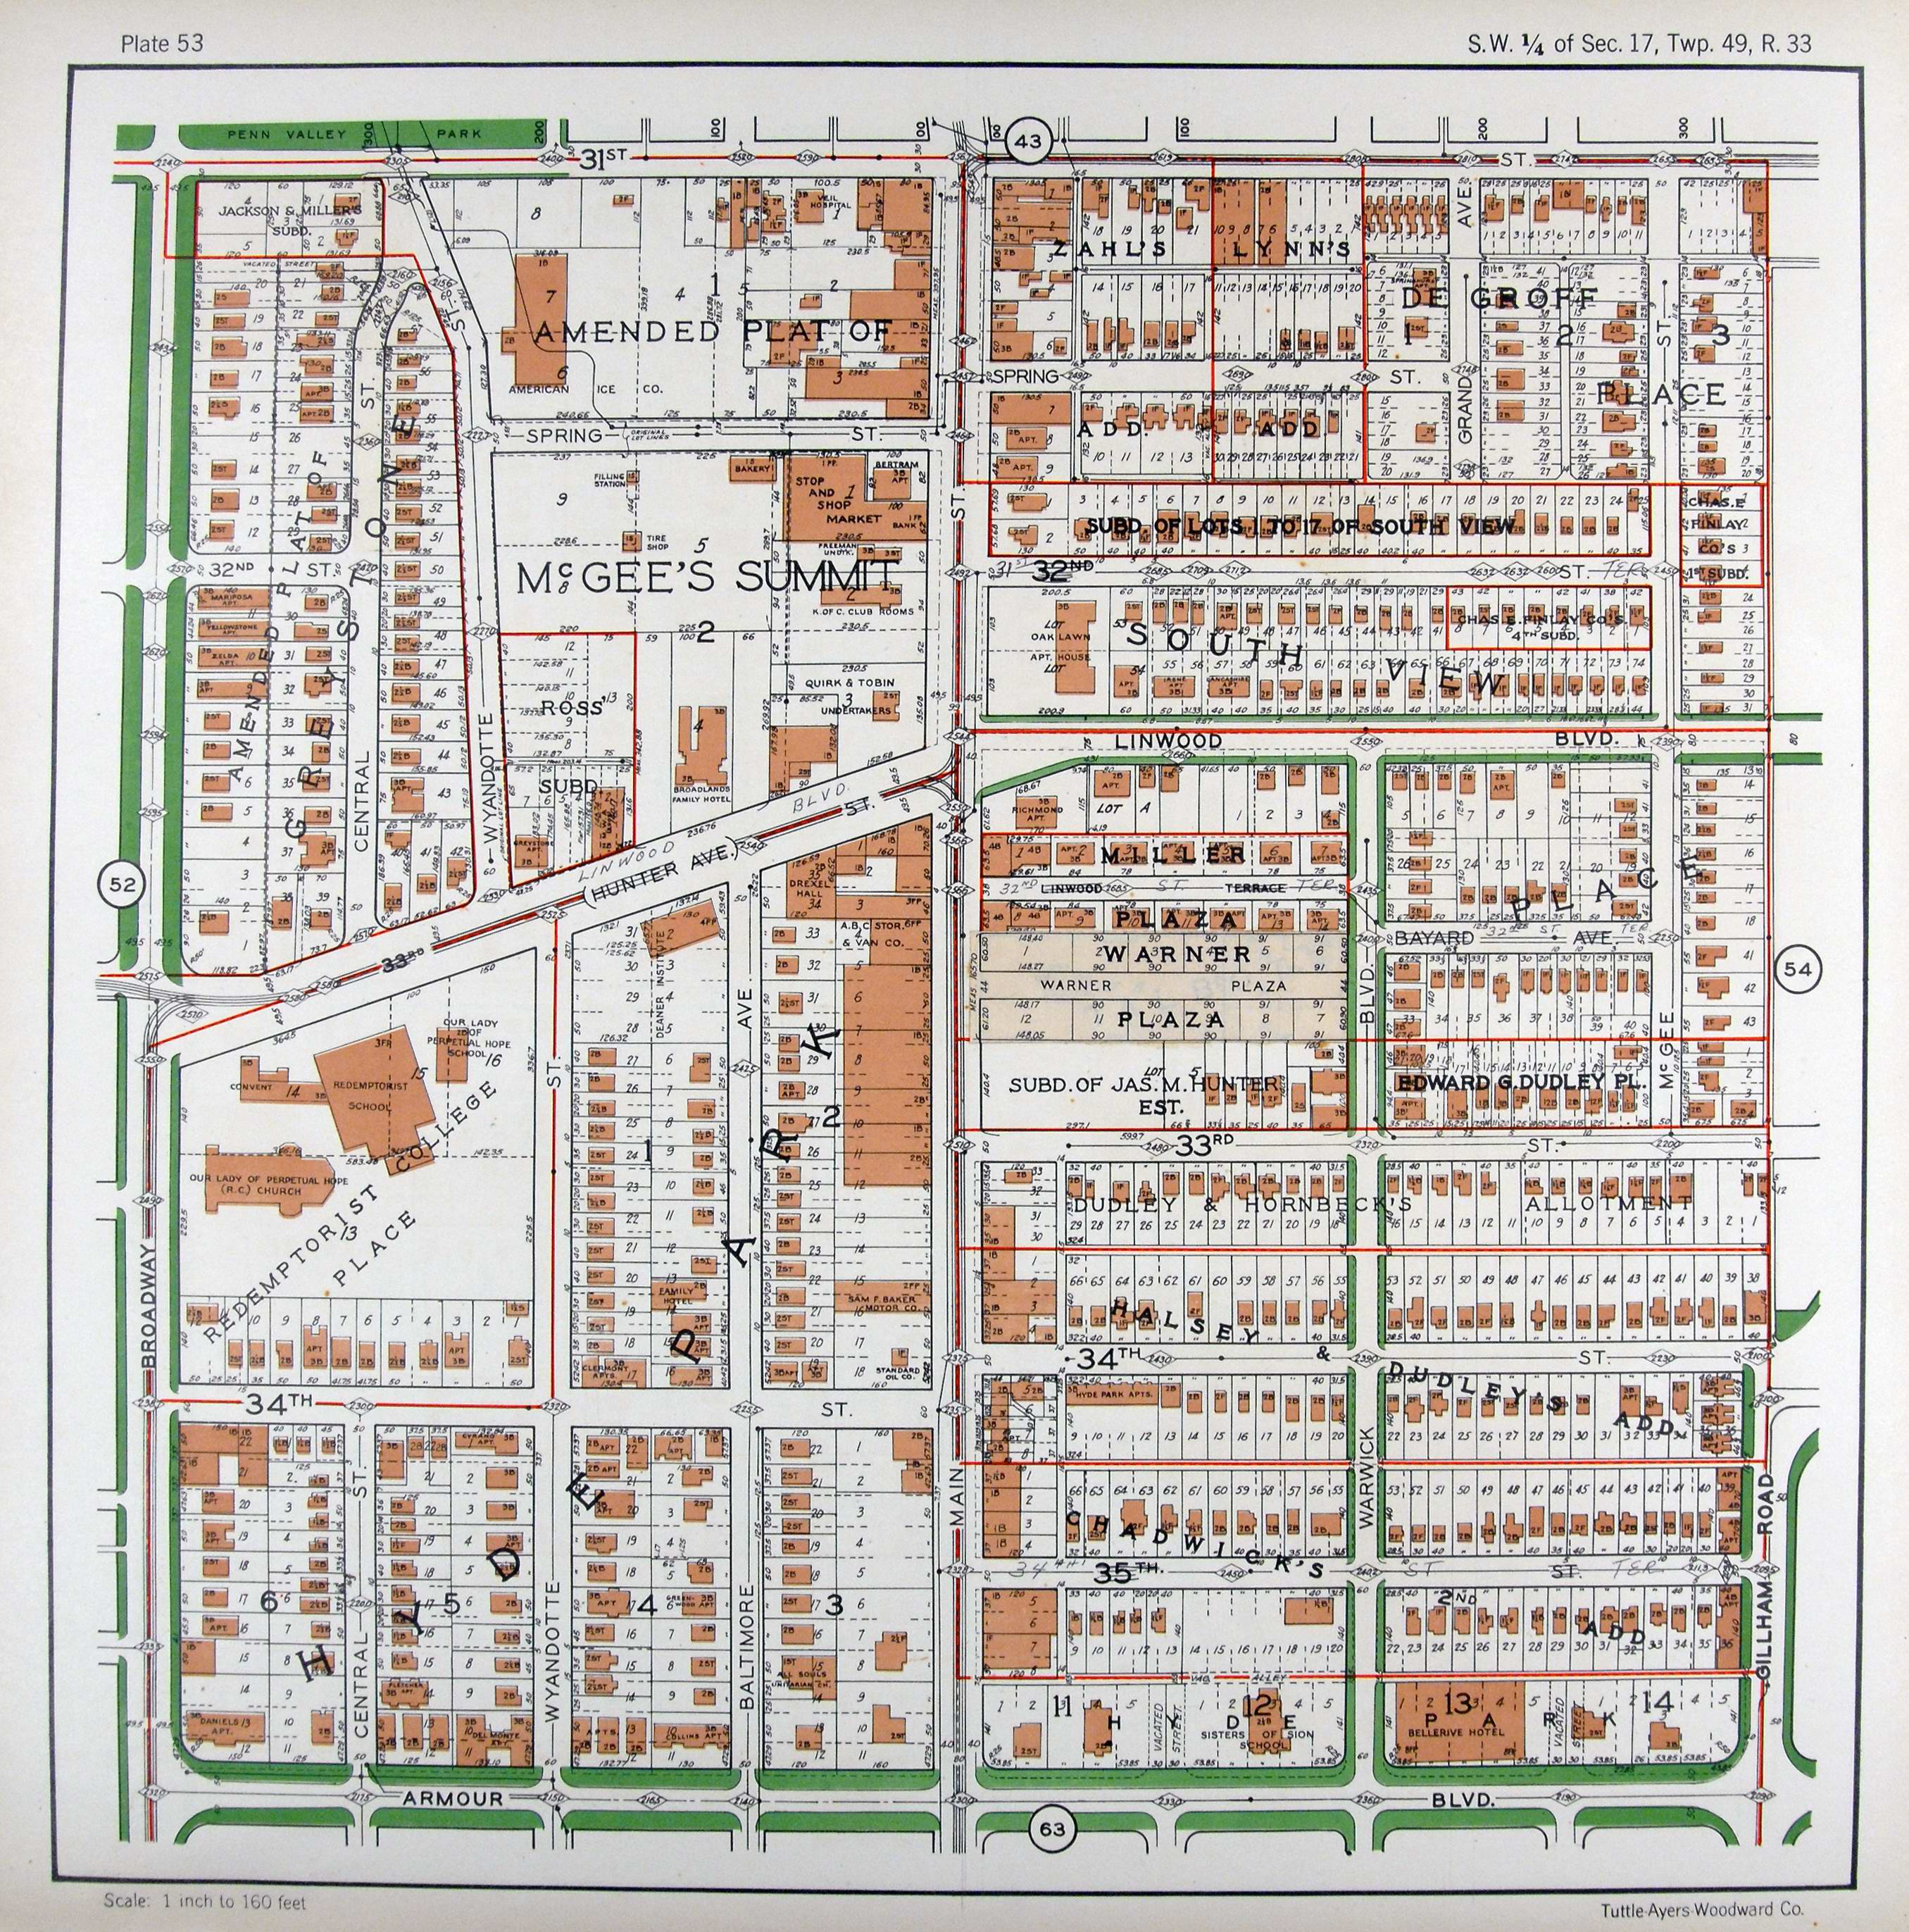
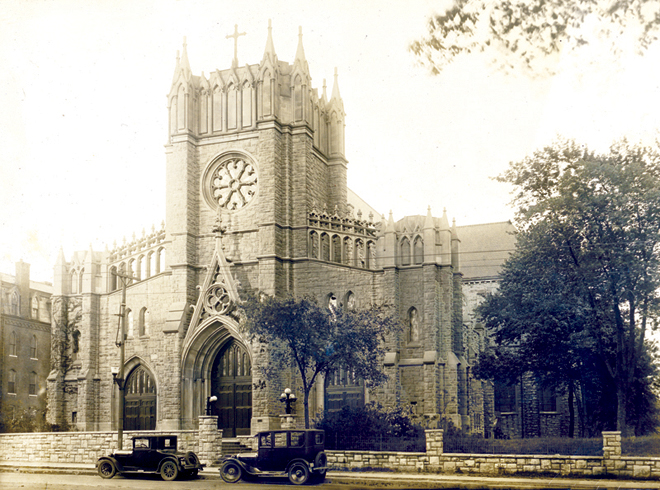
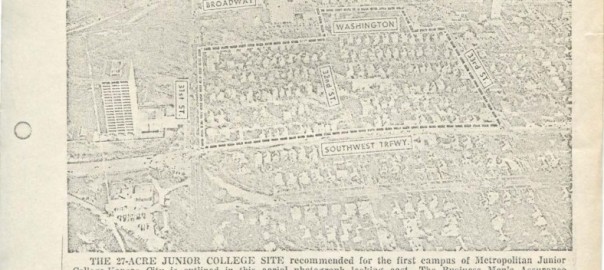
33rd St.: Karnes Blvd to Jefferson St.
This photo was published in The Kansas City Times in February of 1968. It shows the plans for the Penn Valley campus before development began. MCC- Penn Valley open in 1969 and was the site for the first MCC campus. The campus is about the 27-acres. Before Penn Valley was built, this space was occupied with businesses and housing. MCC Penn Valley extends from 33rd St. to 31st St. and Southwest Trafficway (Summit St.) to a little past Washington St.
From researching using different maps, I notice the differences of changes among residential areas and businesses. Businesses are more likely to be torn down and rebuilt, whereas residential areas usually remain the same for years once all the space is taken.

Paseo.Boulevard to Wayne.Ave
The history of Paseo Boulevard and Wayne Avenue have changed gradually through time and Linwood Boulevard is their intersection that gives a contrast of the many changes they have encountered. For example Paseo parkway was laid out in the early 1900s by George Kessler under the direction of August Robert Meyer, first president of the Commission of Parks. It did not exist before that and Wayne Avenue was part of Vine Street and was not called that until 1909 according to the institute of Museum and Library services (1950). Sanborn Map, Kansas City, vol 4 1909-1950 [photograph]. The landmarks that surround the area have changed purposes and many have been redesigned.
In conclusion the Paseo Boulevard and Wayne Avenue area has a history of ever changing demographics from the early 1920s luxurious fashionable apartments and white residences to its current status of government assisted housing of prominent African American residents. The area of Linwood Boulevard has a diverse quantity of unique new and old buildings and the setting of the boulevard has changed considerable. Increased traffic has brought an influx of overhead signals, signs, and modern street lights. At the western end, newer commercial enterprises have replaced older residential buildings, curbside trees have been lost, and sidewalks have been extended to the curb.
| A portion of Kansas City from E. 42nd Street south to E. 43rd Street and from Tracy Avenue east to Wayne Avenue, showing buildings, streets, and additions. Large numbers at edges of page refer to page with adjoin |

A traffic signal at Linwood and The Paseo in 1932 and (inset) 2000.
Indiana Ave to Cleveland Ave
This area has, for the most part, remained the same over the years. The two biggest landmarks in the area are a park on the north side of Linwood, and a high school on the south side. Smaller buildings around the edges of the blocks have come and gone as the years have gone by.
What I found most interesting about the area changing was the fact that, around 1925, when a street was added in the middle area. Monroe Avenue was extended from 31st street (where it originally ended) to Linwood Blvd. What makes this development even more interesting? The street was gone again by 1958! I thought it was fascinating that something as major as a street lasted less than forty years.
1917:
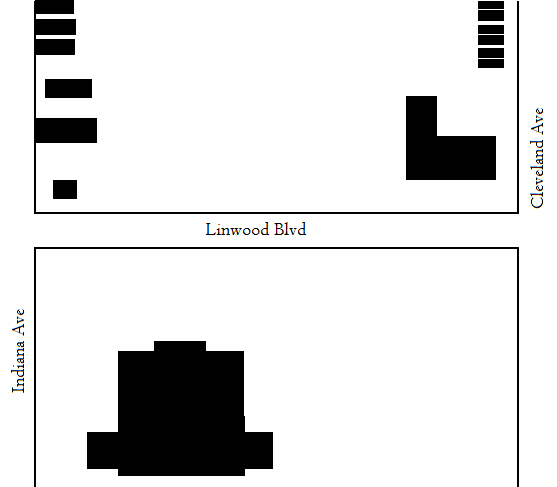
1925:
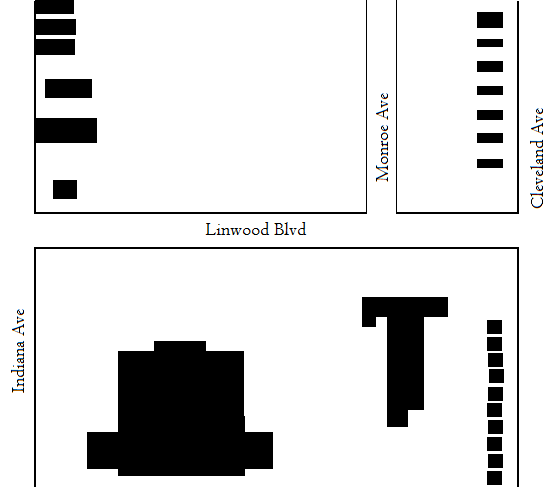
1958:
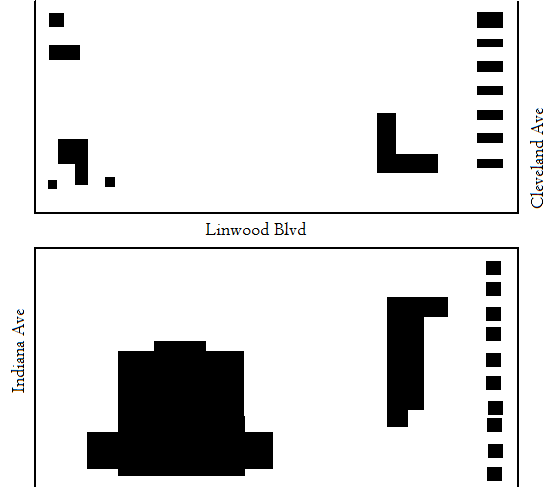
Linwood: Cleveland to Myrtle
I was assigned the area between Cleveland Avenue and Myrtle Avenue.
The area is so far East that the block wasn’t available for the earliest Sanborn maps of Linwood Blvd.
By 1925, the area was still pretty devoid of any major development. 1950 saw significant growth and the addition of a church and row housing on the southern edge of Linwood between the two blocks.
The built environment has changed little since the 1950s, save the addition of a YMCA. It is currently getting renovated and until than is located in a local school nearby.
Michigan Avenue to Garfield Avenue
Linwood Boulevard runs east to west between Broadway Boulevard and Van Brunt Boulevard in downtown Kansas City, Missouri. I examined the development of the stretch between Michigan Avenue and Garfield Avenue from 1896 to the present using Sanborn Maps and the 1925 Atlas of Kansas City Missouri and Environs. Today these blocks have changed quite drastically compared to how they were from 1895-1950. The area between Michigan Ave. and Euclid Ave. is now the six-lane Highway 71. Looking south of Linwood Blvd., between Euclid and Garfield, there is only one building, the Emerson Manor senior facility. Taking its name from the Emerson Apartments that were present in the 1925 Sanborn Map. North of Linwood Blvd., Between Euclid Ave. and Garfield Ave. there are no buildings, but a little grassy area being used as an orchard. The orchard is maintained by The Giving Grove organization (a program of the Kansas City Community Garden). The uses of this land now are residential and for public uses. How this two-block stretch changed from a quiet, nearly empty, piece of land to being a bridge over a loud, speeding highway is eye-opening to how drastically the use of land develops over time. In 1896 Lindwood Blvd. didn’t even exist, but over time we were able to see how the indention of Lindwood Ave. decreased and was slowly replaced with grass and was eventually completely taken out. You could never imagine the drastic changes the land around you has gone through.
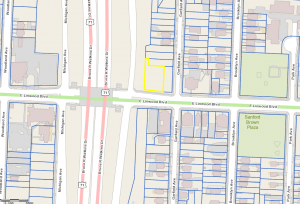
Linwood: Flora to Highland
My section of Linwood was incredibly interesting to me, as my own families history was woven into the story of the street. When I first went down to the street I was disheartened by the state of the street, all overgrown with three abandoned lots; but knowing what I know now about the what the street used to hold, it’s even more disappointing. My section of Linwood used to hold the first Reform Jewish Synagogue on the street, along with the first Jewish Community Center in the city. Linwood and the surrounding streets held Kansas Cities Jewish Community during the interwar years and up until the 1960’s. My grandfather fondly recalls the many hours he spent at the old Jewish Community Center, and the Synagogue right around the corner is where he met my grandmother for the first time. This street is part of my own personal history, and I had never been there until this project took me to it!
Linwood: Kensington Ave to Elmwood Ave
The area that I was assigned to was a little old neighborhood called Knoches Park. It was located east of The Paseo and the way I got there was by using The Metro. Getting there was a bit of a challenge because I was unfamiliar with the area. My assigned block looked like any suburban block around the Kansas City Metropolitan Area. However, when I was doing some research I found out that it looked a lot more different than it is now. The area was pretty much no man’s land prior to the 1890’s. It wasn’t around 1895 that the city limits started to expand and make it’s way past Paseo Drive. Although some housing was incorporated into the area most of the roads were unpaved and the main mode of transportation was by foot. It wasn’t until the 1920’s that paved roads started to accommodate pedestrians, horse and trollies, and a few automobiles. The area was beginning to expand with housing as the population grew around the city limits. By the 1950’s, Kansas City was beginning to sprawl outward with more roads and houses to accommodate the growing population. The automobile began to shape the suburbs and that allowed for more business districts to come into the suburbs. The area between Kensington Ave and Elmwood Ave saw mostly changes in residential development. SInce 1925, it has expanded in mostly housing. New additions since 1950 include newer homes on the south side on Linwood Blvd, a new church on the corner of Kensington Ave, and metro bus lines that run on Linwood Ave. Milton Moore highschool was built around the 1900’s right on the corner of Linwood Blvd and Elmwood Ave. It has stood there over the years with a few minor additions. The building never expanded and was eventually turned into an elementary school. It still surprises me how a small highschool at the turn of a centrury still stands today to serve elementary students in that area.


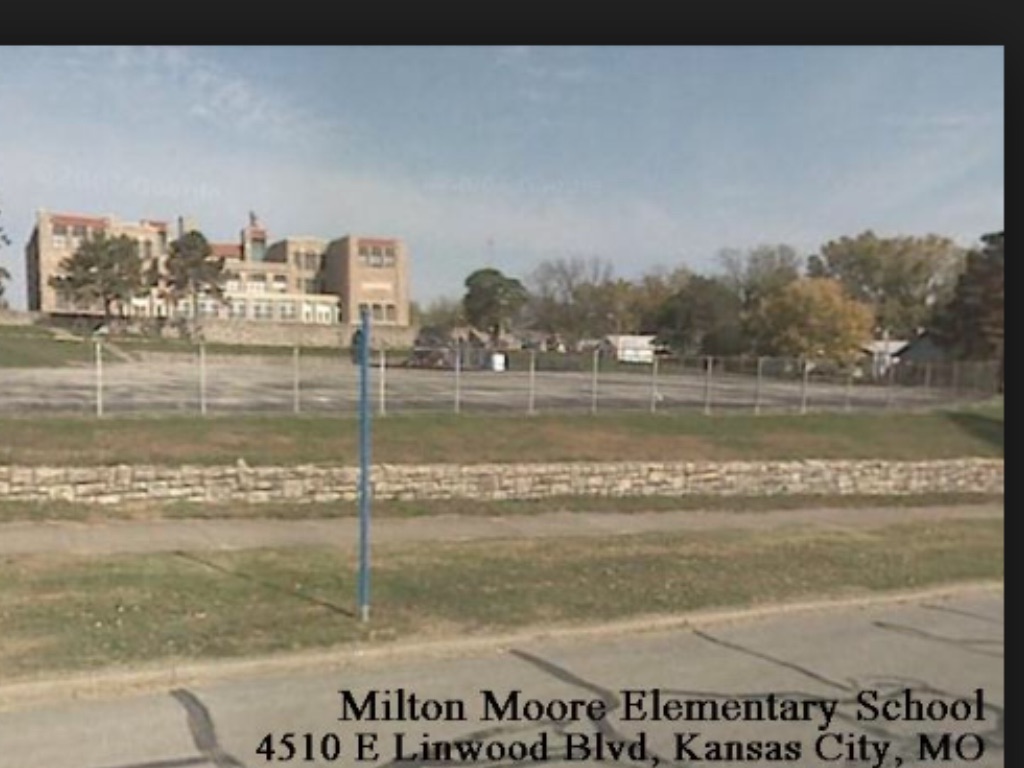
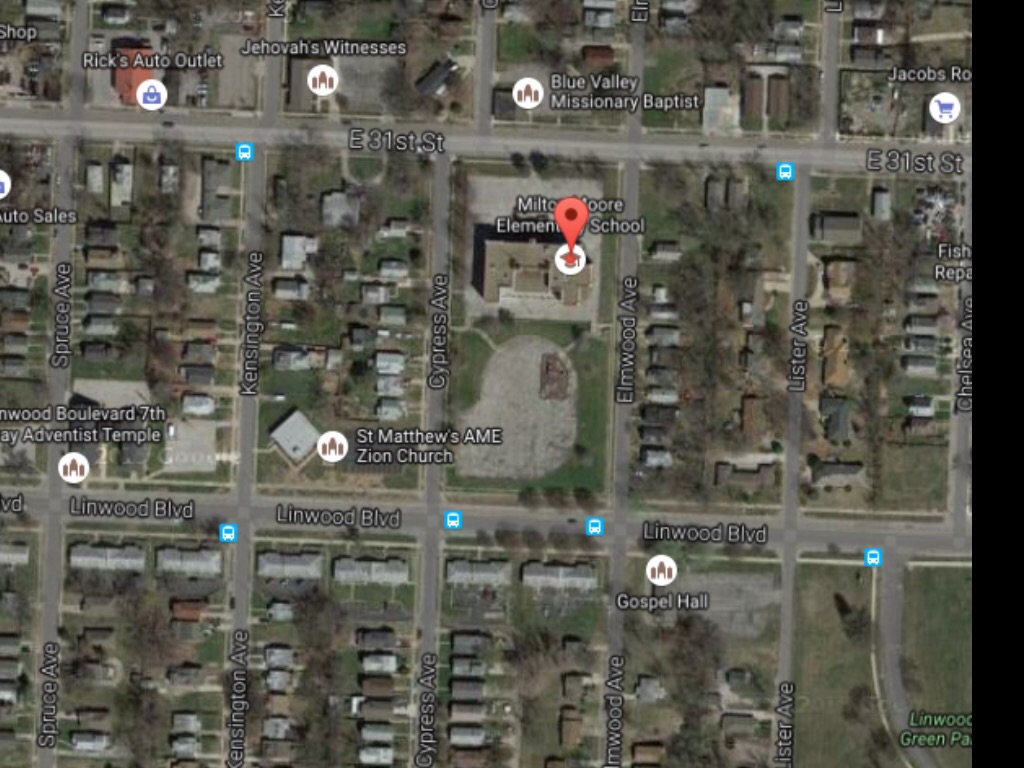
W. 33rd St. from W. Coleman Rd. to Kearnes Blvd.
This area has largely been used for residential purposes. Back in 1896, the area was just undocumented green space and it remained that way till the early 20th century. In 1907, there was a declaration (pictured below) signed to establish the Coleman Highlands neighborhood. This brought many new homes around this segment of W. 33rd street between 1910 and 1925. By 1950, the majority of the houses present today were already built around this block. Today, this segment of W. 33rd street is a quiet, peaceful neighborhood in the heart of Kansas City.
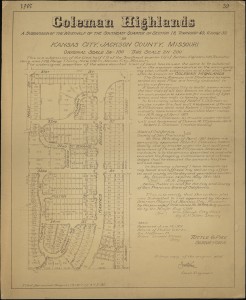
Linwood BLVD- Benton BLVD to Benton BLVD
Visiting these blocks and doing research was very interesting to me. The blocks had a sense of being unfinished. Parcels of land either empty or containing a house were typically over grown and falling apart. I found that many properties that had major issues typically were owned by out of town developers or private individuals. This raised many questions for me. Although it was very rough on the edges you could see the beauty of the boulevards with wide roads lined with wide green buffers and large sidewalks. Overall its a area that I would love to see come back. It will take the right people to work on a project of this size with the right intentions.

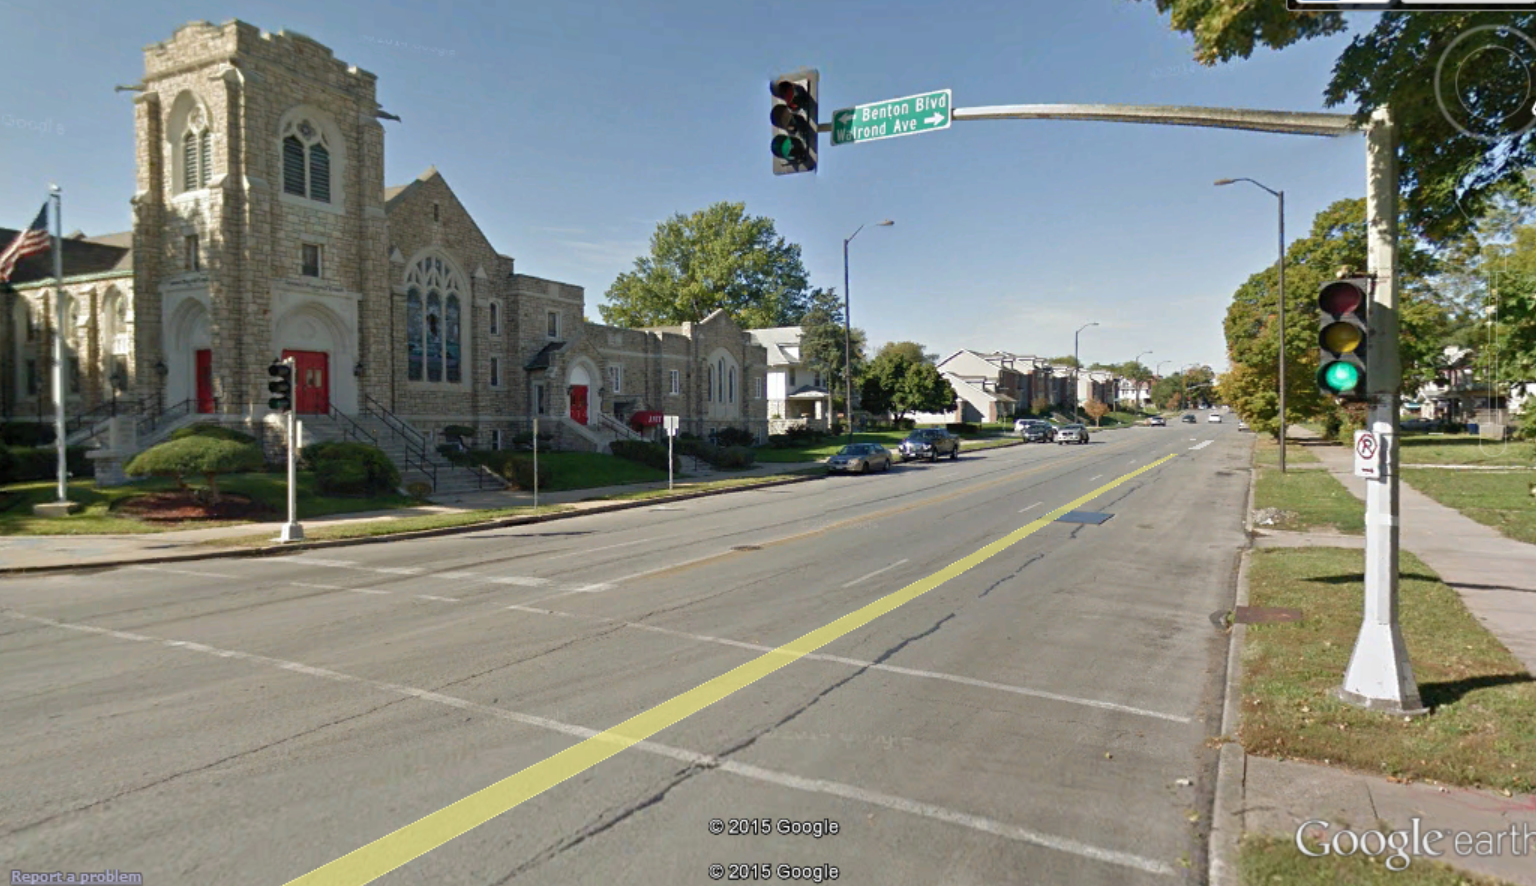
Linwood | Gillham Plaza to Holmes Street
This area began as primarily residential, before Linwood Boulevard or Gillham Plaza even existed. A home for the elderly resided on the grounds that would become the intersection of Gillham Plaza and Linwood until around 1925. Once the two streets were created, these two blocks quickly grew as a commercial area. 
1925 Atlas of Linwood Boulevard
By 1950, residential spaces lining Linwood would be replaced by commercial businesses (except for one apartment building). These businesses mainly catered to car owners – there were two gas stations and two auto service business in this one area, plus an auto yard. 1950 was the height of activity on these blocks. Nowadays, the businesses still target car owners – there’s a Jiffy Lube, O’Reillys, a gas station (this lot has always been a gas station since before 1950), and a car wash – but the area seems run down. The Acme Cleaning Company building, built in 1924, is still standing but is boarded up and not being used.
Linwood from Garfield to Park
To begin, Kansas City’s system of planned parks, boulevards, and infrastructure can be traced to the 1893 Plan for Parks and Boulevards. This early plan, championed by visionary urban designer George Kessler, emphasizes the need to design comprehensively, yet pursue goals incrementally. Like any organism, the city needed to be designed intelligently in order to function sensibly throughout time. The 1893 plan accounted for a series of boulevards, then outside of the city limits, to help organize urban growth moving forward. One of these east-west thoroughfares was Linwood Boulevard. There is no data of the intersections of Garfield to Park existing on Linwood Boulevard in 1895. Thus, one can assume that this artery had not yet been developed. Despite being undeveloped, the boulevard was instructed to be “60 feet wide and contain sections lined by 10-to-12-foot-wide grass strips and 5-to-6-foot-wide sidewalks.”
According to the Sanborn map of 1950, all the residential structures between Garfield and Brooklyn retained the same building footprints. Behind the buildings on the southern side of Linwood from Garfield to Brooklyn, underground gasoline tanks were installed. Also, parking lots behind residences begin to emerge on the Sanborn map. In 1963, the monument to Sanford Brown, Jr. was relocated to a masonic cemetery.
From 1950 to the present, Sanford Brown Plaza has experienced moments of deterioration and revitalization. According to the Kansas City Star in 2009, “at Sanford Brown Plaza, Linwood Boulevard and Brooklyn Avenue, both drinking fountains worked; one didn’t in 2003, about twenty new trees have been planted in recent years, with much less glass and graffiti than six years ago.” Presently, the park appears to be in good order. It is well-landscaped, with new playground equipment, functional facilities, and well-kept basketball courts and baseball diamond.
Thus, the spatial history of Garfield to Park Avenues along Linwood Boulevard is an example of idealistic beginnings that produced mixed results. Sanford Brown Plaza has bounced back to become an important anchor for the community, but the surrounding residential structures are depressing remnants of a bygone era.
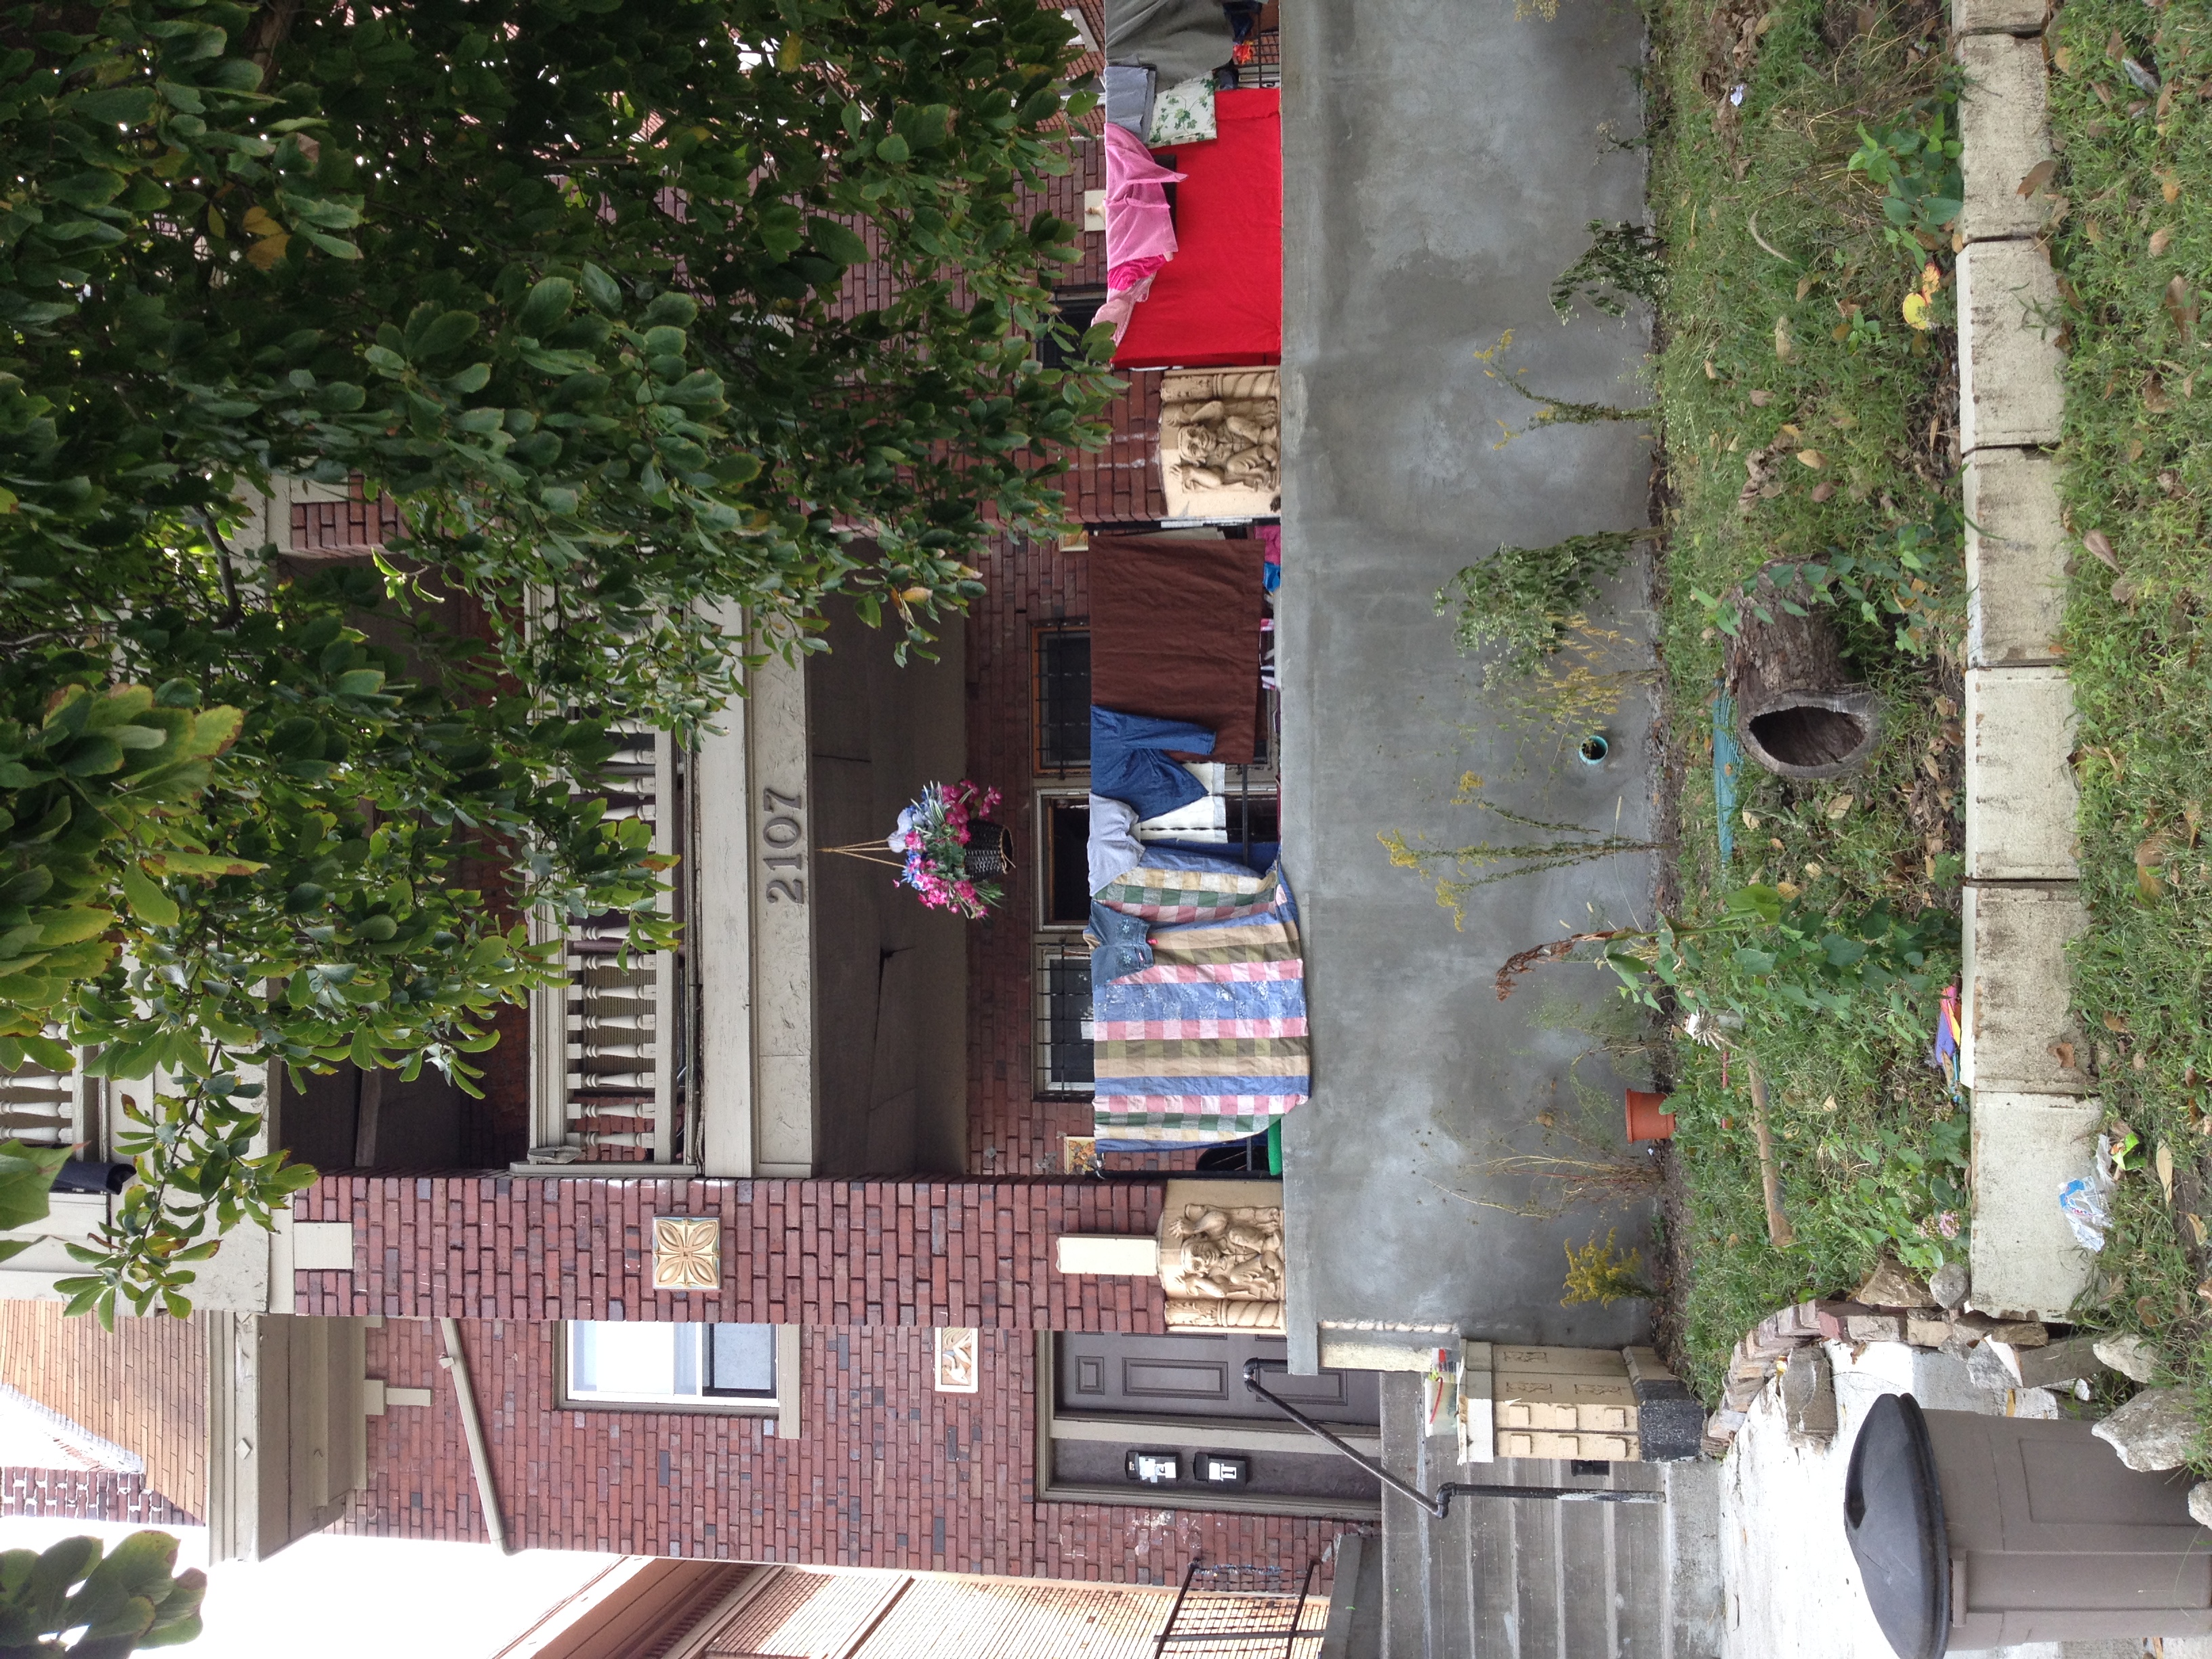
Linwood Boulevard from Campbell to Troost
Linwood Boulevard was an up and coming neighborhood in the early 20th Century. It formed in the late 1800s which a few established apartment buildings, filling vacant lots, and quickly grew as the first World War arrive. The blocks of Linwood, from Campbell to Troost began simply. In 1895, there was nothing but a few multi-family units, a Methodist Episcopal Church, and a Springfield Avenue Christian Church. Within a decade, Sanborn maps show the neighborhood found mixed-use function, and began to thrive. By 1925, the neighborhood filled with occupants such as Anthenaeum Club Building, Berkshire Arms Apartment Hotel, Cornell Apartments, LaSalle Apartment Hotel, Thornton and Minor Hospital, United States Post Office Station “E”, Wirthman Building, Isis Theatre.

After the 1950s, the neighborhood went quickly in decline. Crime rates skyrocketed, white flight took shape, and businesses fled. Today, the neighborhood looks nothing like the thriving downtown suburbia that was the idyllic dream of 1925. The small block is still mixed use, but occupied by a Family Dollar Store, a Sinclair Gas Station, empty lots, apartment homes, and the Anthenaeum, which holds historical significance for the community.
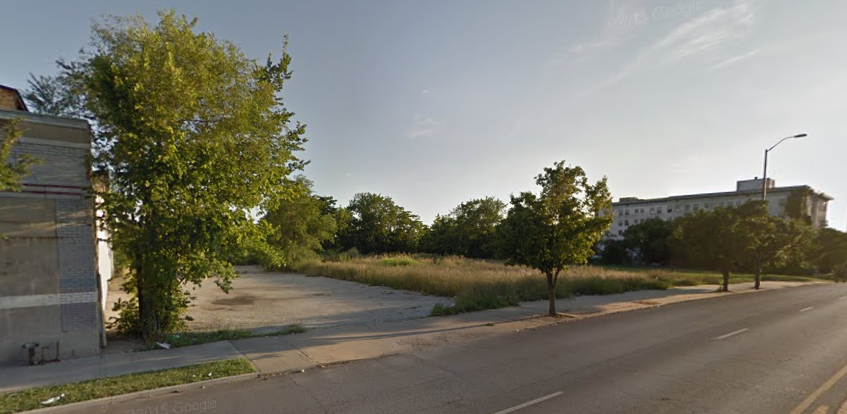

Linwood Boulevard to Cleaver II/Van Brunt (31st St)
The Kansas City Missouri Parks and Boulevards system was the first plan initiated by the city that focused on future development. One of the most ambitious boulevards was the southern boulevard connecting the east side of 31st to the west side of 31st, Linwood Boulevard.
On the far east end of the boulevard is a reserved green space in the shape of a triangle: Linwood Blvd to the North, 31st to the south and Raytown Road (eventually, Van Brunt & Emanuel Clever II). The natural drainage towards Brush Creek at this point served as the natural ending point for Linwood Boulevard. In the earliest depiction of this area from 1895 (Figure 1) shows that it is not within the city limits and Linwood Boulevard did not formally stretch to there yet. In 1897 Kansas City MO annexed Westport MO, effectively lengthening Linwood Boulevard the maximum length natural features permit (referring to the natural barrier, the Blue River). Immediately following the annexation, in 1899, the Parks and Boulevard System plan officially began.
Linwood Boulevard spanned 3.43 miles ending with a natural green space Kessler describes as, “a park like effect, and an appearance differing radically from that of the ordinary residence street”. This area, at the end of Linwood, has been and continues to be nothing but a green space (Figure 2).
(Figure 1)

(Figure 2)

Quote: http://www.georgekessler.org/images/1893_Plan/1893_Plan_Improvement.PDF
Linwood Boulevard | Park Ave to Wabash Ave
In 1909, this portion of Linwood Boulevard was starting to be settled, and two churches, First Baptist Church and Linwood Boulevard Methodist Episcopal Church, located on the north side of the street, dominated much of the landscape. At the time, the Linwood Boulevard M.E. Church was a simple chapel. There were a few residential buildings as well as empty lots.
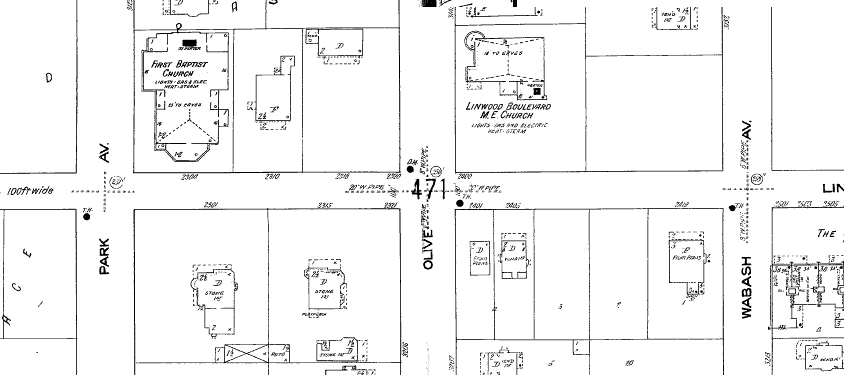
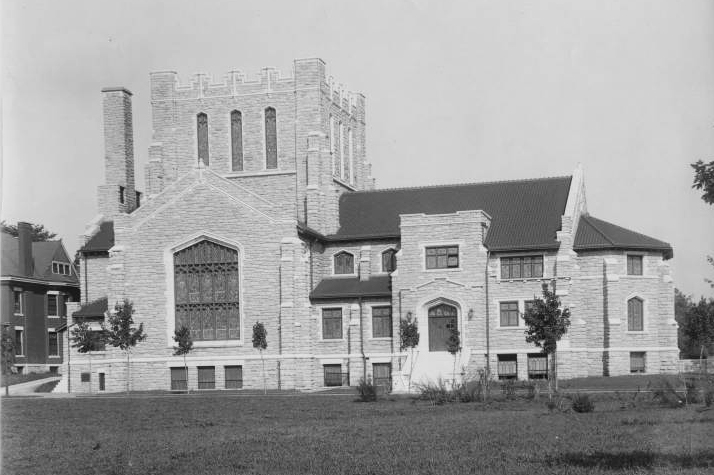
Comparing the 1909 Sanborn Fire Insurance Map to the 1925 Tuttle-Ayers-Woodward-Co. Atlas you can see additional development of the existing and empty lots, including expansions of both churches and the building of the Ivanhoe Masonic Temple on the south side of the street. In its heydey, the temple housed meetings and civic activities of the largest group of Freemasons west of the Mississippi (“Golden Spade,” 1920). It’s construction from 1920 – 1922, and its $1 million price tag (Penn, 1999), was big news among the ladies and gentlemen who lived, worked, and played in Kansas City’s inner suburbs.
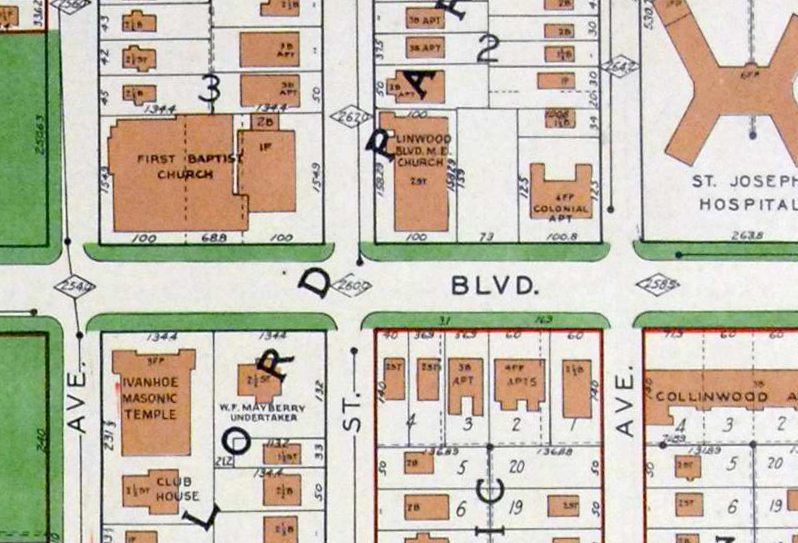
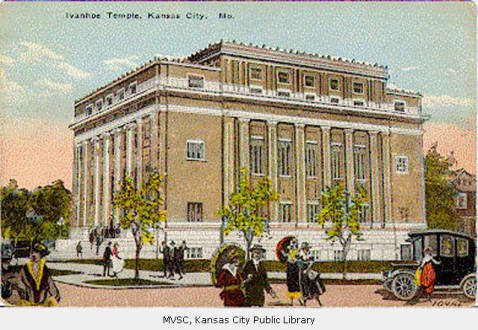
1951 saw the heaviest density of these two blocks with all plats being built up and additions of Sunday School buildings for both churches. However, between 1951 and present day, several of the original buildings were torn down including the temple and many of the residences. After being added to the National Register of Historic Places in 1985, the Ivanhoe Masonic Temple was demolished in 1999 at a cost of $400,000 to the city plus $65,000 already spent to purchase the building (Penn, 1999). Some members of the community, including architectural historian Cydney Millstein, fought to save the building for its historic value. Others, including the Reverend Wallace Hartsfield of the Metropolitan Missionary Baptist Church across the street (formerly First Baptist Church), wanted it torn down because it had become a blight on the neighborhood. Ultimately, the city was not able to find a suitable use nor a buyer (Penn, 1999).
The two churches still remain on these blocks and are currently open and operating. On the south side of the street three original multi-family residences remain in use. An original building called the Colonial on the north side of Linwood and Wabash remains as well but is used for commercial space.
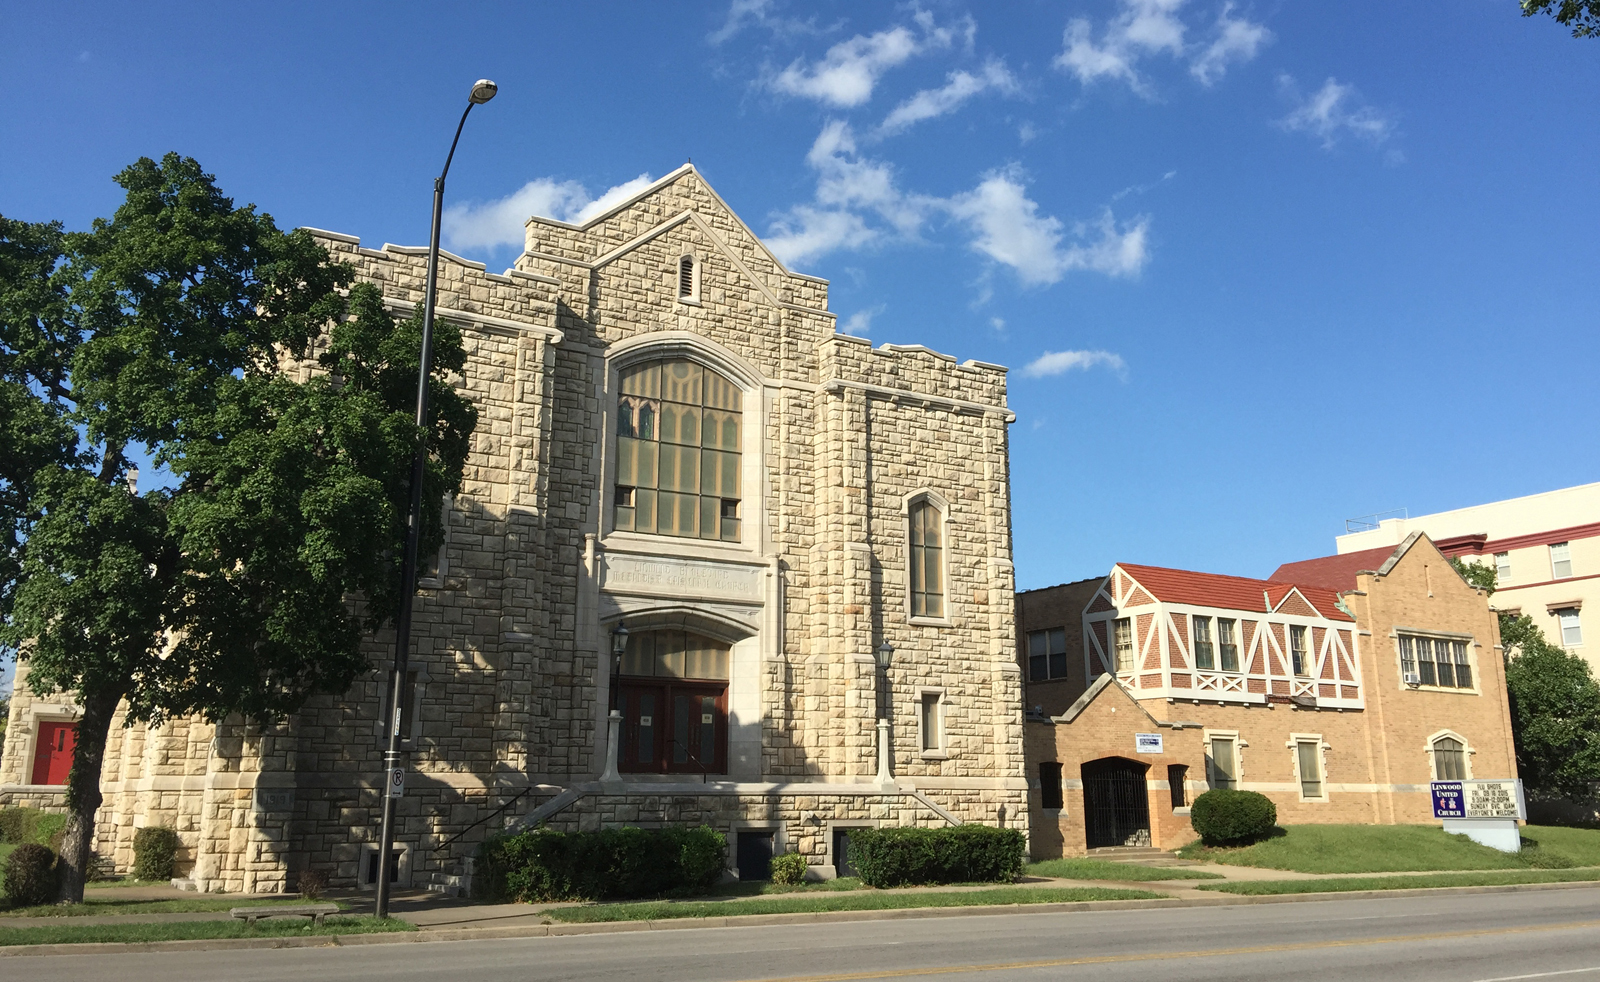
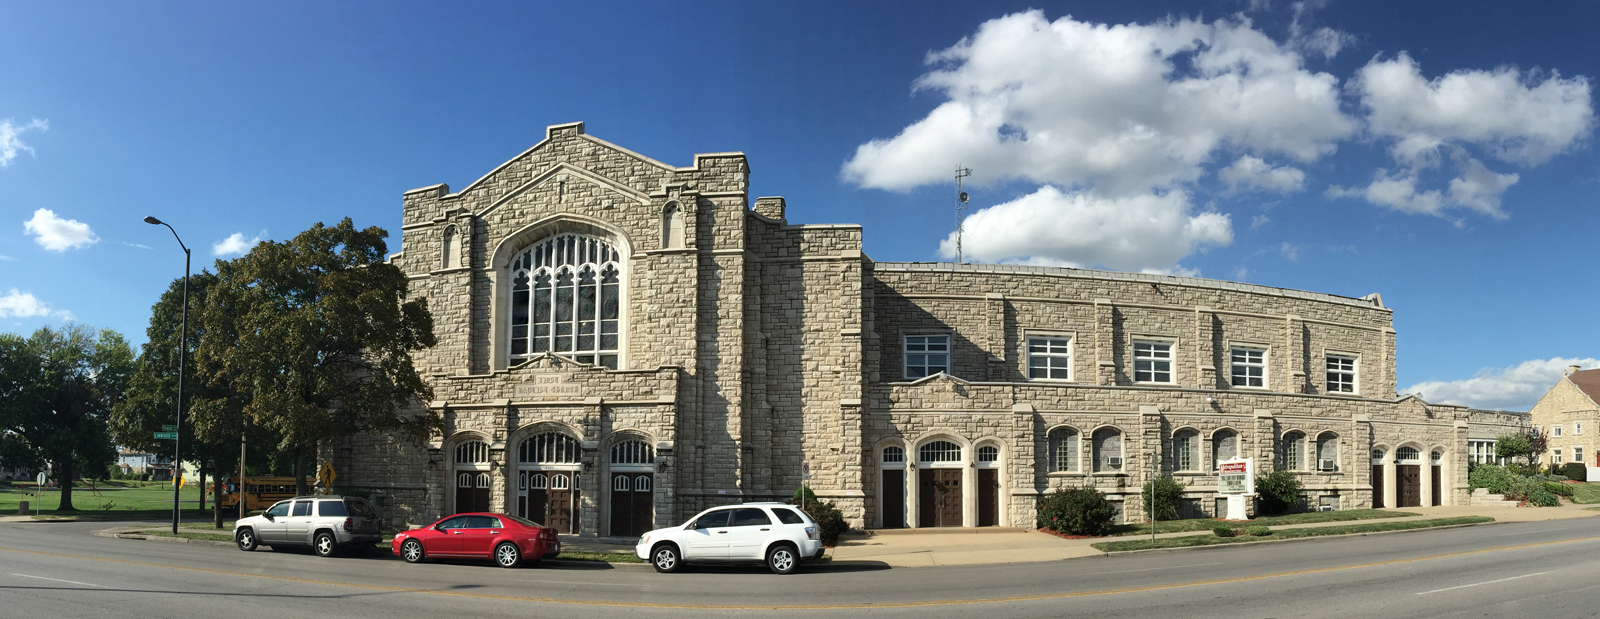
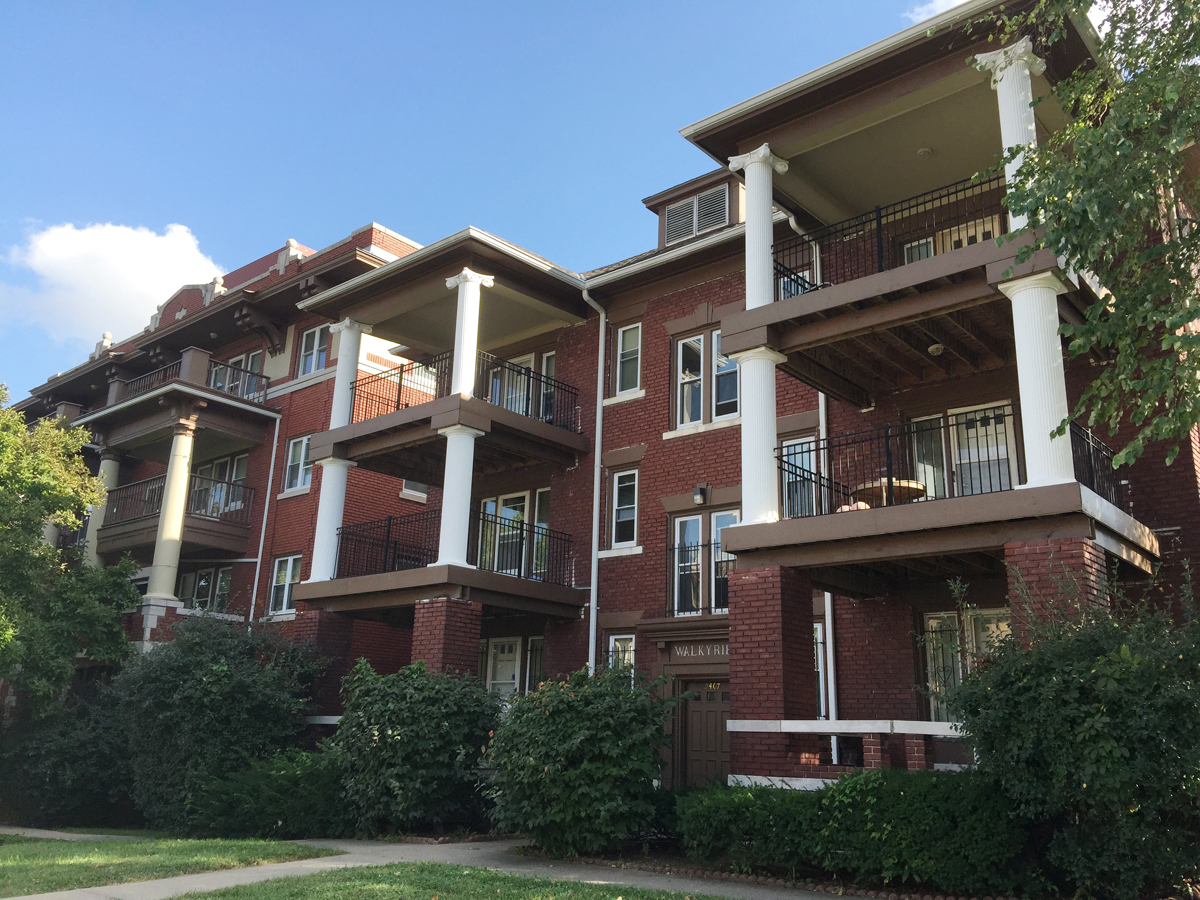

The figure ground studies below show the stark contrast in the built environment between 1951 and 2015.
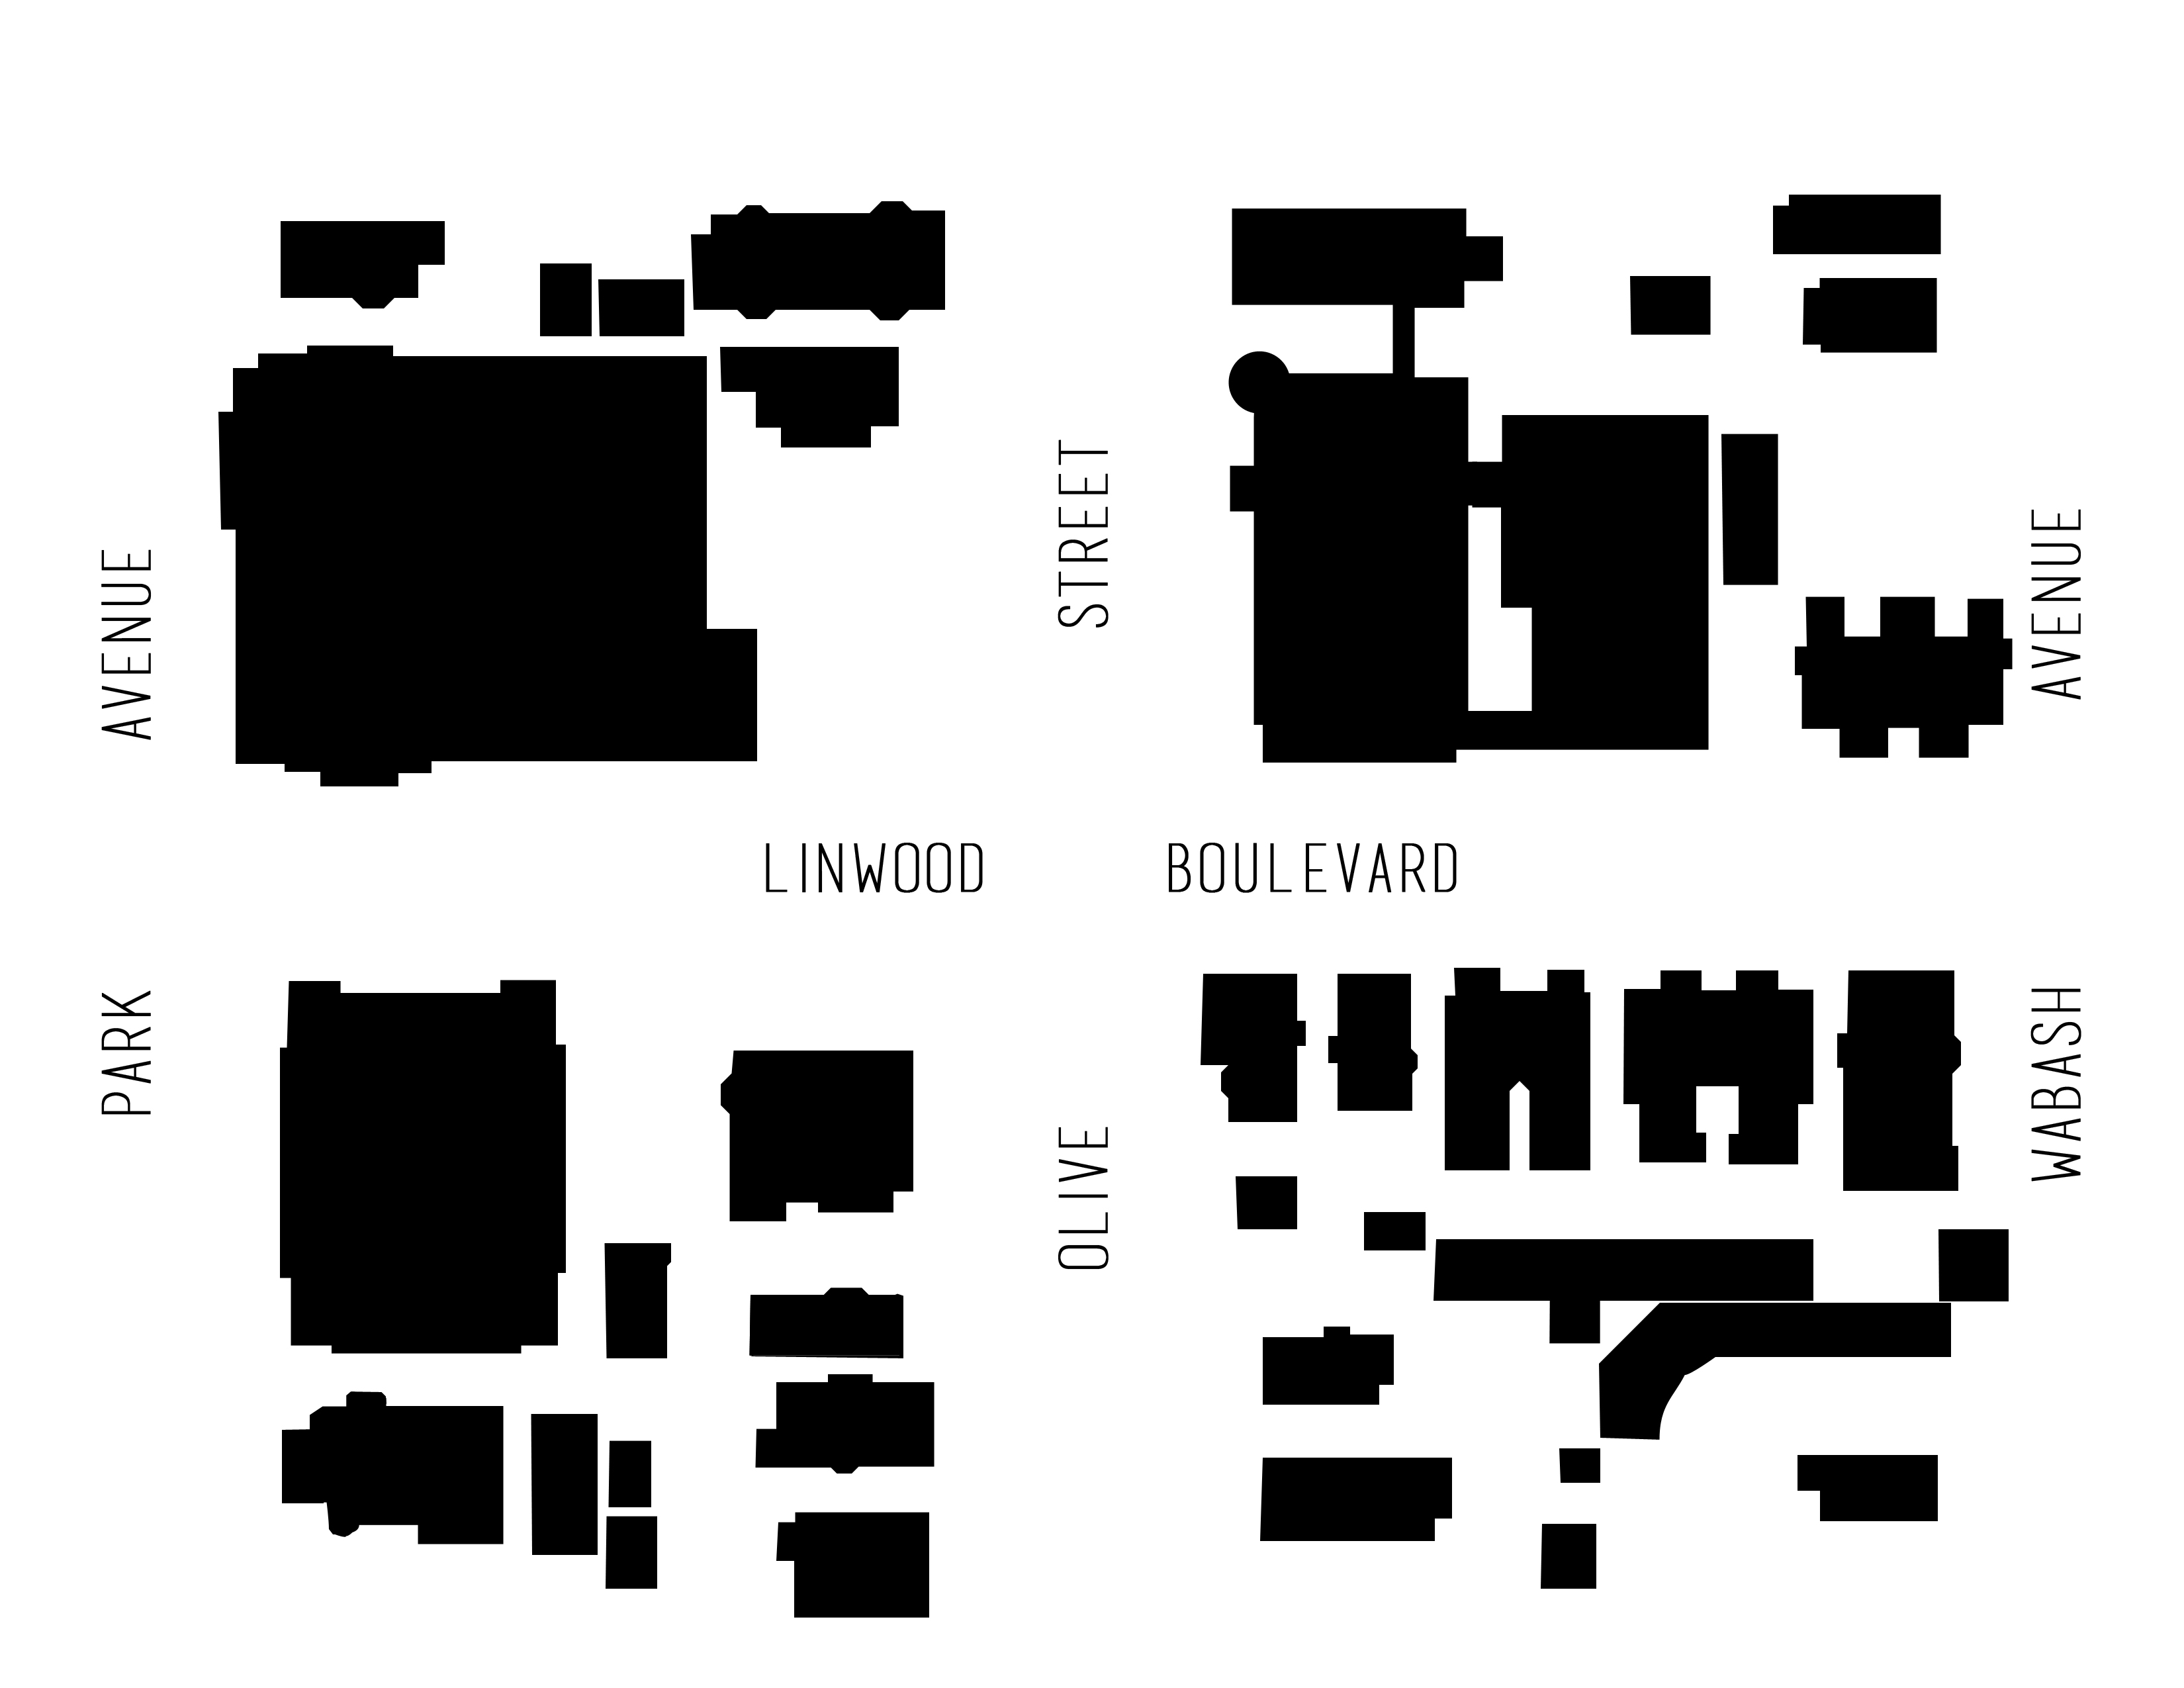

Jefferson Street to Broadway Boulevard
My assigned area is a portion of West 33rd Street to the beginning of Linwood Boulevard. The type of uses that currently characterize the area are primarily mixed use. There are commercial businesses on both the North and South sides of my blocks – such as Browne’s Irish Marketplace on the corner of West 33rd Street and Pennsylvania Avenue and Sheng Chinese restaurant on the corner of West 33rd Street and Broadway Boulevard – but there are also a small number of residential apartment buildings.
One major change that I observed when researching these blocks was the dramatic decrease in density that occurred in the area from 1950 to present day. In 1950, a number of residential homes lined the streets. In 2015, these homes no longer exist and have been replaced with parking lots on both the North and South sides of West 33rd Street.
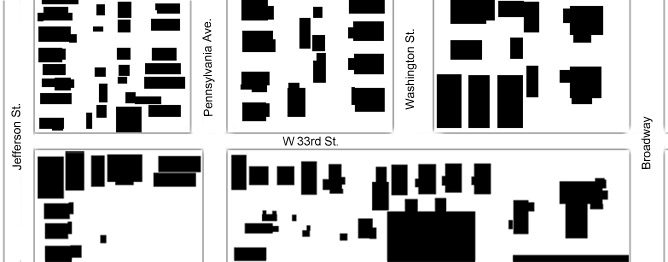
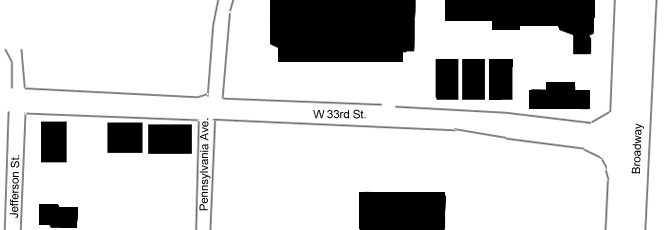
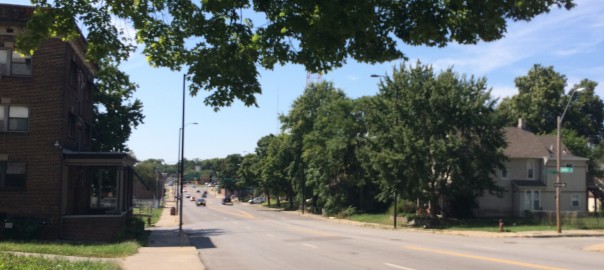
Holmes to Campbell
Researching Linwood Boulevard helped me gain an overall understanding of how Cities change of Time. There were new streets built, streets widened and streets renamed. The density of my are fluctuated, buildings were built, and then destroyed, sometimes replaced by new buildings other times by bare parking lots. It seemed that there was a theme of reusing buildings with a new purpose. Some houses became places of businesses and a gas station became a tire repair store. This section Linwood seemed to be at its height in 1950, there were more residential buildings and businesses, and over the years the block slowly died down. It was interesting to see how new streets formed, new buildings were built, older buildings were re-purposed and buildings like the Seventh day Adventist Church that ceased to exist.
The most historic building on the blocks is the Kansas City Athenaeum. The Kansas City Athenaeum was formed in 1894 by joining several women’s groups together. The members of the group formed as a way for women to receive a college level education in subjects such as art, music, literature, science, and economics. The group was also very active in civic and charitable events. Their building was completed in 1914, and remains in use today.
The block tells an interesting story and I only uncovered the surface. I would like to more of the details about the buildings that cease to exist. I wonder what their stories are? Perhaps sometime I’ll have to eat at that Texas Tom’s as well.

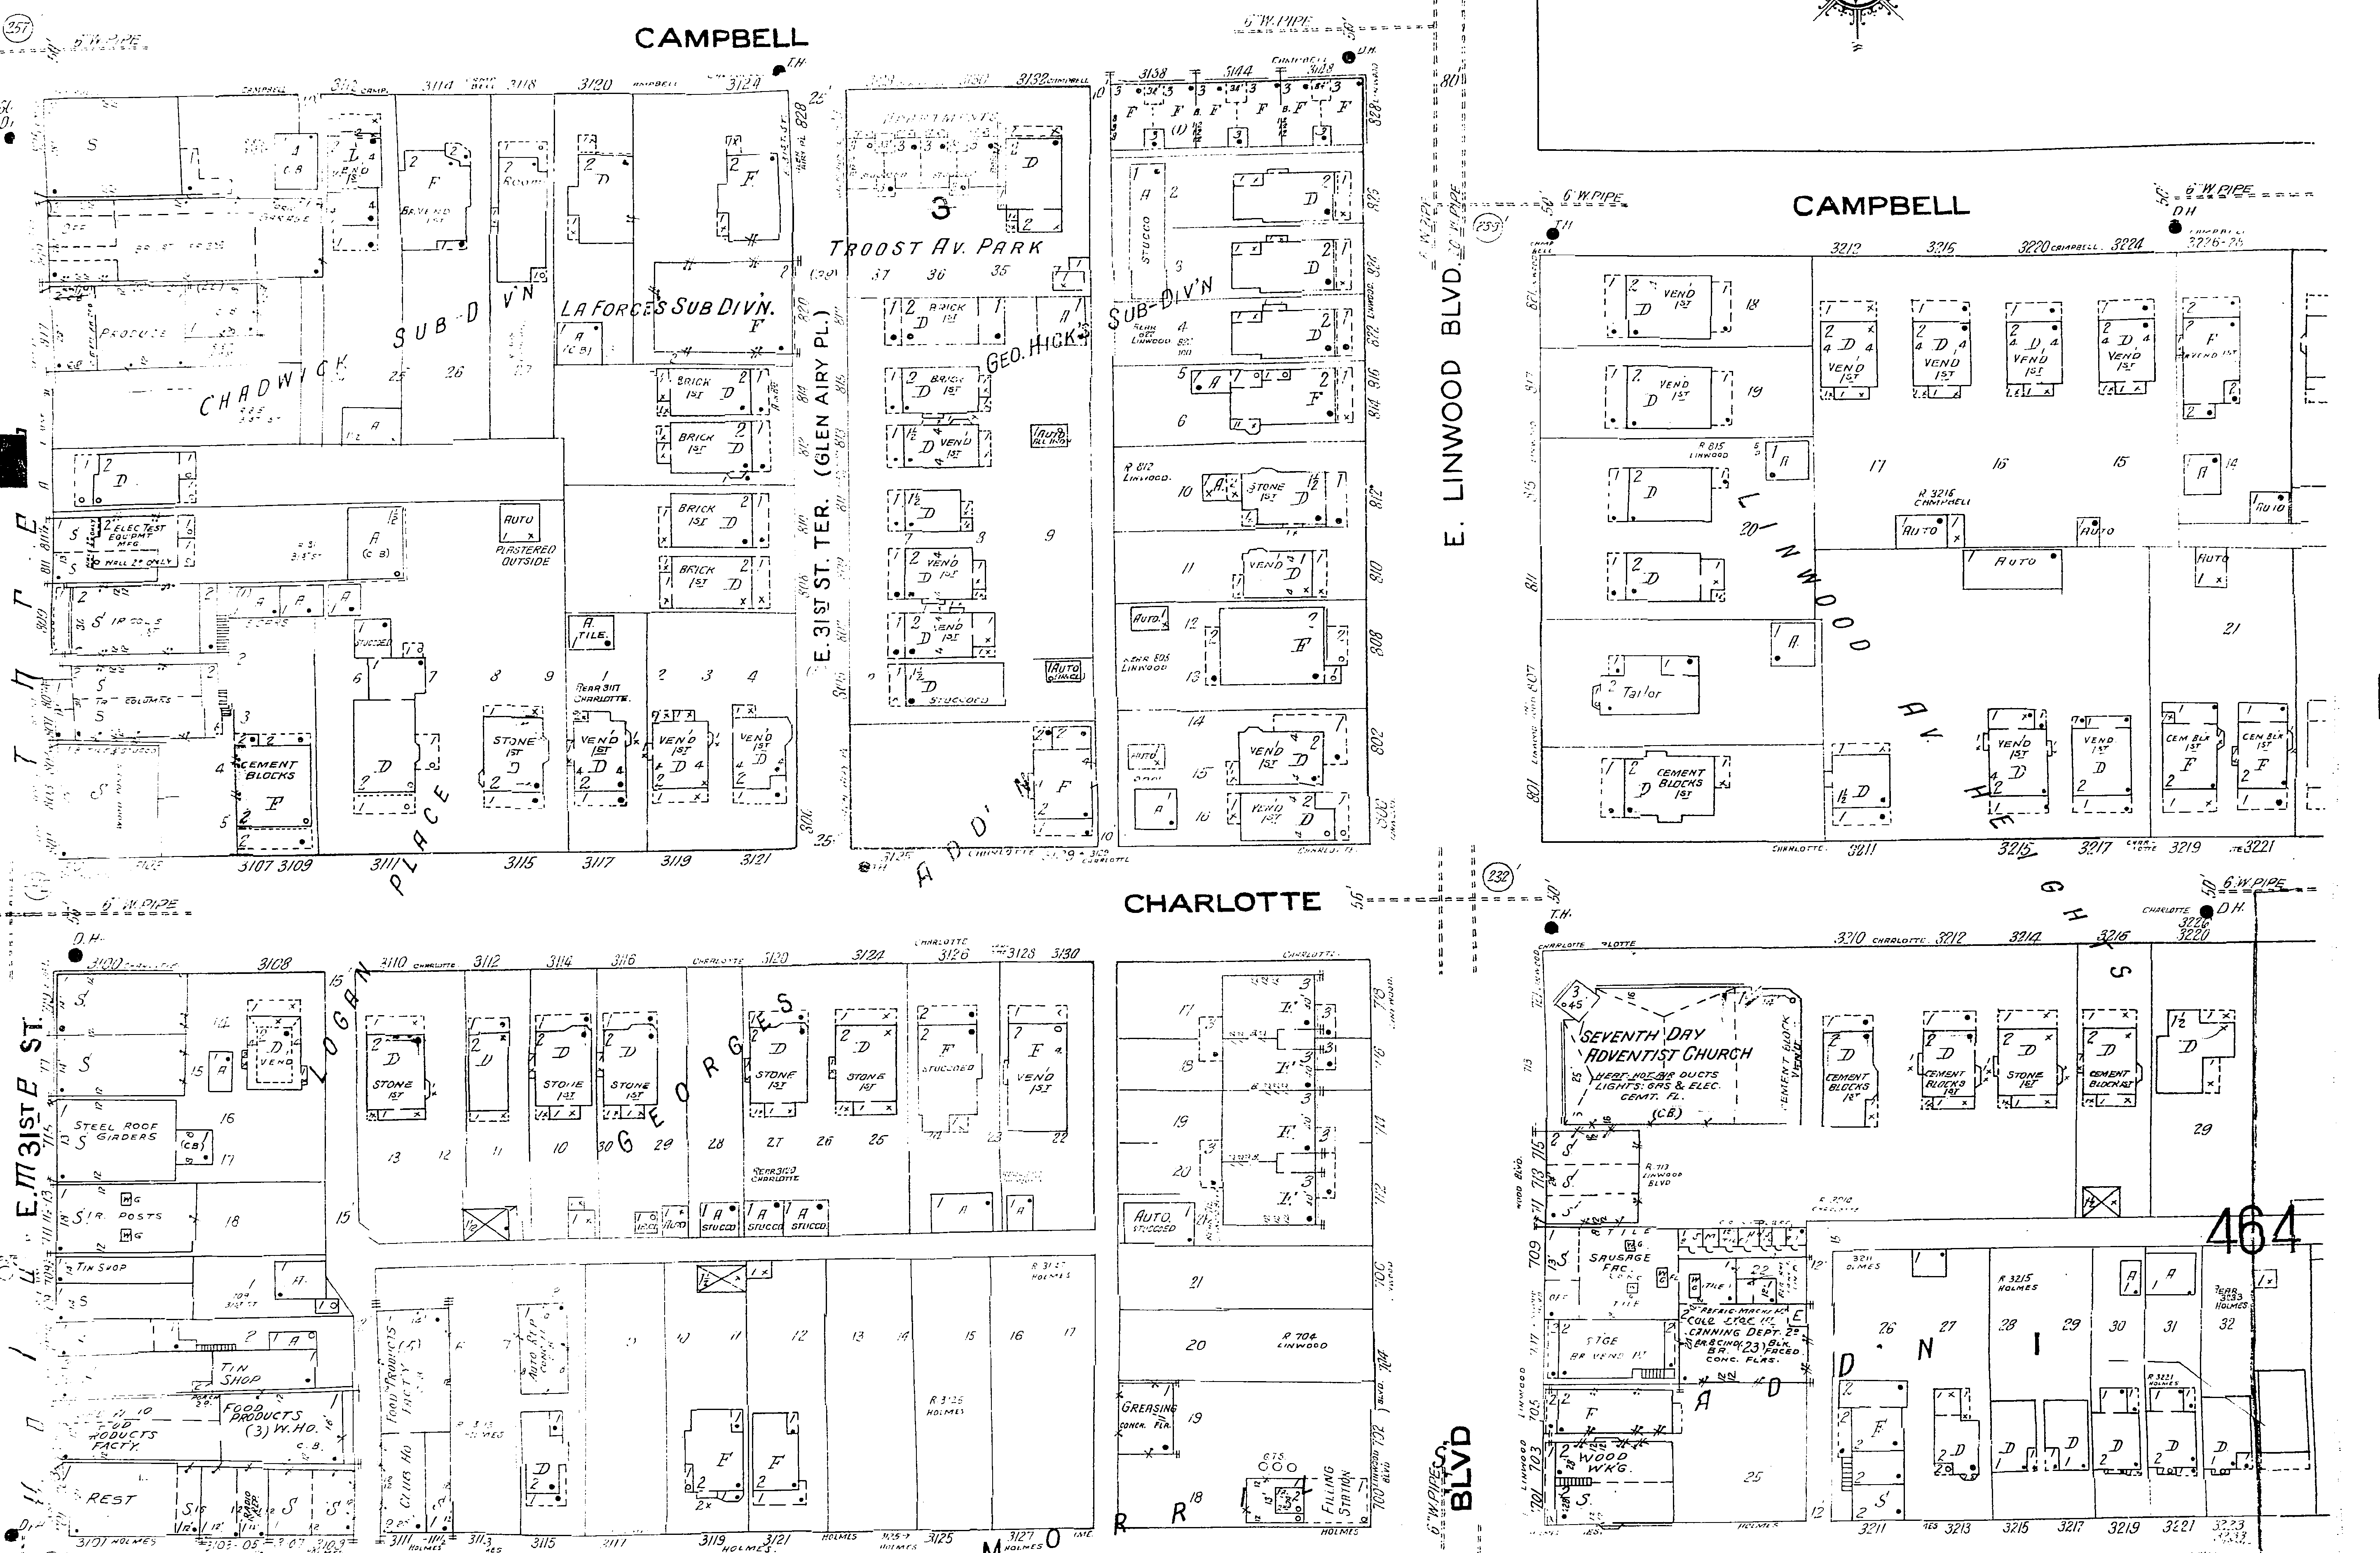
Linwood Boulevard: Elmwood Ave to Chelsea Ave
This area of Linwood Boulevard saw a considerable amount of change over the past ninety years. Not only did residences slowly rise, but the south side of Chelsea Avenue was entirely rearranged. This section of Linwood Boulevard transformed from an empty landscape to a residential area with features such as The Gospel Hall church and the Kansas City VA Medical Center which is just south of Linwood Green Park. This church, hospital, and park have created an interesting microcosm compared to it’s relatively blank state in 1925.
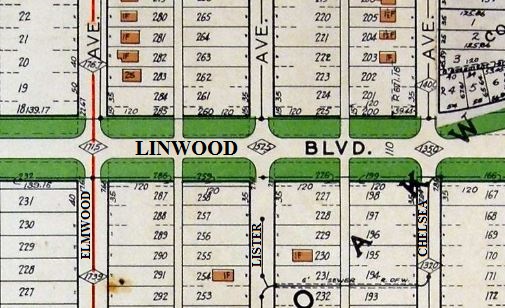
Linwood Boulevard – Highland Avenue to Michigan Avenue
My area of Linwood is immediately to the east Highway 71. It includes the church that is currently being restored. My area has two churches and a funeral home. Google Maps shows a third church in this area, presumably it was recently demolished or moved as there is currently an empty lot with both a church parking sign and a for sale sign. The multiple churches is this two block area demonstrate why Linwood Boulevard was also known as the Boulevard of Churches.
From my research of the area, the location was previously a mix of uses. There were dwellings that included at least one boarding house. An ad in the Kansas City Star listed 8 rooms for rent to couples or gentlemen. Linwood School was also located in my two block area. The current funeral home has been at this location for many years and prior to that was owned by another funeral home.
The church currently being remodeled has been standing at this location for almost 100 years. Originally built in 1923, the church remained open until the late 1970’s. After the church’s pastor was swept away in flash floods along the Plaza, the church struggled, finally closing it’s doors. The current renovation will result in space for a congregation, multiple non-profit’s will occupy office space, and senior living apartments will be added.
The current businesses in the area and the renovation of the Presbyterian Church will help drive further development in this area and revive Linwood Boulevard and the surrounding neighborhoods.