All posts by Tyler Lehde

Census Data

When looking at the all the census tracts I found a lot about the area and how it changed over time. In the 1950 census tract there were 14,954 residences that lived in the area by 2010 there are only 7,115. The area has changed demographically too, it was a majority white neighborhood then by 2000 in was a African American community. There was also a housing crisis. In 1950 there were 4,828 housing units and by 2010 there were only 3,192. After reviewing the data is kind of overwhelming to see a area that was thriving disappear.
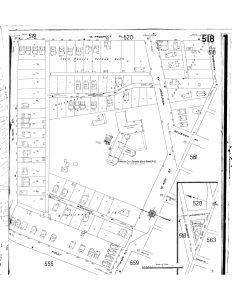
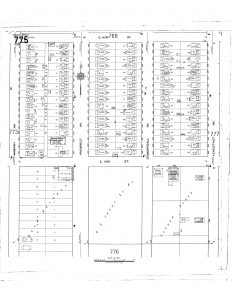
 

42nd through 44 Historical Development

1909 1917-775

The Map on the left is a Sanborn Map from 1909 showing 42nd street to Prospect and the Map on the right is a 1917 Sanborn Map. With the Map on the left showing roads that angle, they were reconstructed sometime between 1909 and 1917 to form a more grid like pattern. With new construction of the block came more lots that are formal to each other throughout the block. This made it easier to sell  for dwellings on the evenly divided  lots. The 1917 Sanborn map is what the block looks like currant day with a few less houses.