At first glance a map can seem a rather dull thing. Surely a map holds only the driest of data? Not so the map from the Miller Nichol’s Special Collections titled “Johnson’s Missouri and Kansas.” At first glance it’s a rather typical map showing squares and boxes, squiggly lines for rivers and railroads and all the usual map things. There are even a few black and white drawings of wagon trains and Native Americans to spruce the map up a bit. Then when you realize the map is from 1860 the drawings take on a new significance. These are drawings of what was current life for people on the frontiers of Missouri and Kansas. Add to that the building struggle between the free and slave states and Missouri and Kansas’ imminent Border War the map takes on a whole new life, steeped in frontier living, the movement Westward and the politics leading up to the Civil War.
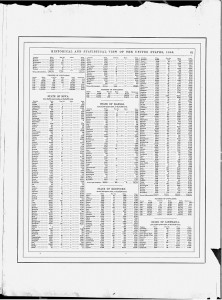
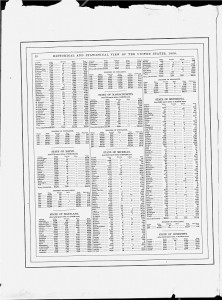
This map has yet more value to researchers than just the images. When the map is turned over it shows that it had been detached at some point from a larger publication titled “Historical and Statistical View of the United States 1860”. Sounds dull right? Not so! Statistics for populations of White, “Freed Coloreds” and Slaves are given, county by county for 1860 as well as for each census year available for the following states: Indiana (partial), Iowa, Kansas, Kentucky, Louisiana, Maine, Maryland, Massachusetts, Michigan, Minnesota and Mississippi (partial). Slavery statistics are hard to come by and this map unexpectedly provides a treasure trove of information. Being from Maine originally, I was intrigued to see that while there were no slaves in my home county of Aroostook (slavery having been outlawed in 1783) there were 26 freed slaves living there. As well as the fact that census data shows that between 1830 and 1840 two slaves were counted. One begins to wonder who owned them, what business the slave holder had in Maine and why he left. The numbers start to become real people. The fact that such data is given at all on such map probably indicates a strong Abolitionist view on the part of the publishers. Research material can come from many unexpected places and this map is certainly one of those rare gems.
Garth Tardy, Library Specialist, Special Formats
Like this:
Like Loading...